


The Toronto area market is still competitive and favouring sellers - but things are cooling down.
As Featured in the Move Smartly Report:

FREE PUBLIC WEBINAR: WATCH REPORT HIGHLIGHTS
Join John Pasalis, report author, market analyst and President of Realosophy Realty, in a free monthly webinar as he discusses key highlights from this report, with added timely observations about new emerging issues, and answers your questions. A must see for well-informed Toronto area real estate consumers.
While the Greater Toronto Area’s (GTA) housing market continues to show early signs of cooling, the market still remains a competitive seller’s market.
House sales in June were up 22% over last year but have been trending down since March. New listings have also been declining since March and were down by 4% in June year-over-year.
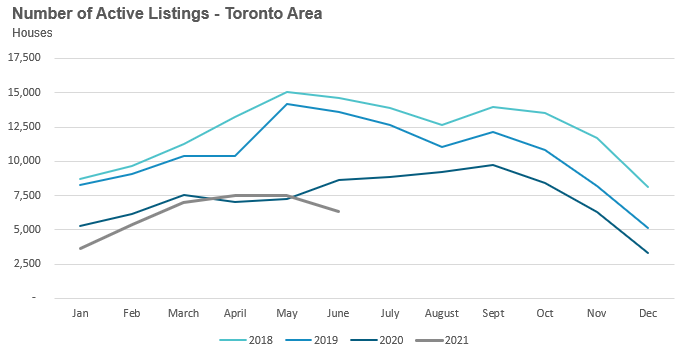
There were 6,353 homes available for sale at the end of June, a decline of 27% over the previous year and down over 50% from the pre-Covid times of 2018/19.
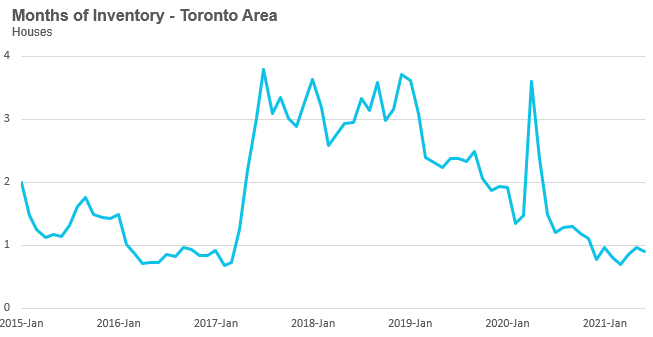
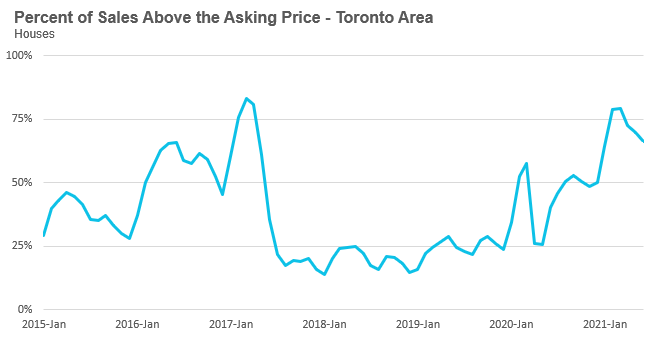
The months of inventory (MOI) has continued to be at or below 1 for the past eight months, but we are seeing a decline in the number of homes selling for over the owner’s asking price, down from 79% in March to 66% in June.
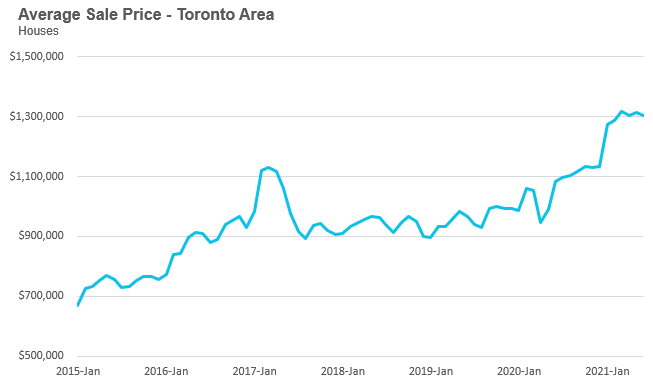
The price for an average GTA house in June 2021 was $1,305,092 and has remained close to the $1.3M range since February 2021.
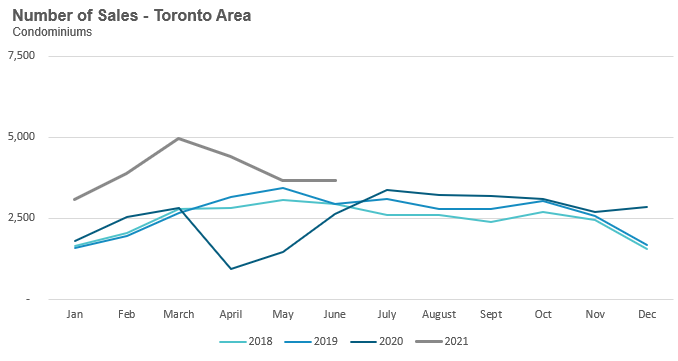
Condo sales in the Toronto area in June 2021 were up 49% over last year. But the strong growth in sales compared to houses is in part due to the fact that condo sales were far slower to rebound in June 2020 (after the first pandemic induced-lockdown) when compared to houses.
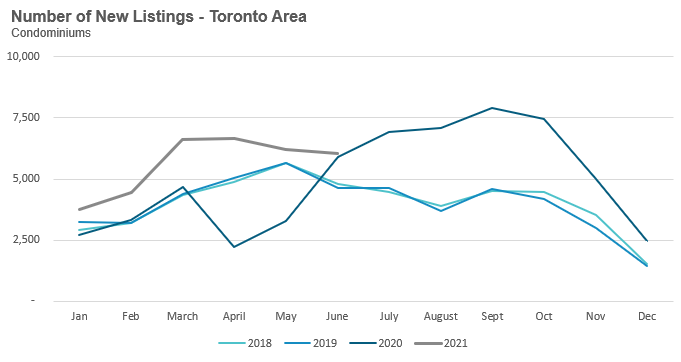
New condo listings were up 2% in June over last year. Since March, new listings for condos have not been declining as rapidly as they have been for houses. This has kept the number of active listings more inline with previous years though still down 7% over last year.
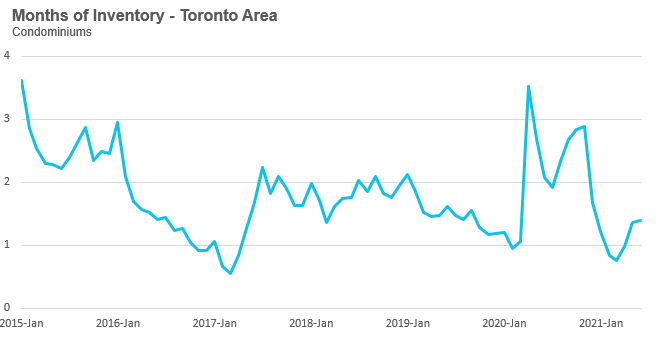
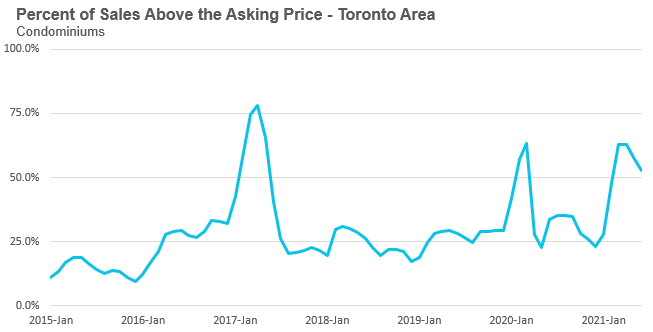
Given this level of new listings hitting the market, the MOI for GTA condos has been increasing from a low of 0.8 in March to 1.4 in June, taking some heat out of the condo market as buyers have more choice. The share of condos selling for over the asking price fell from 63% in April to 53% in June.
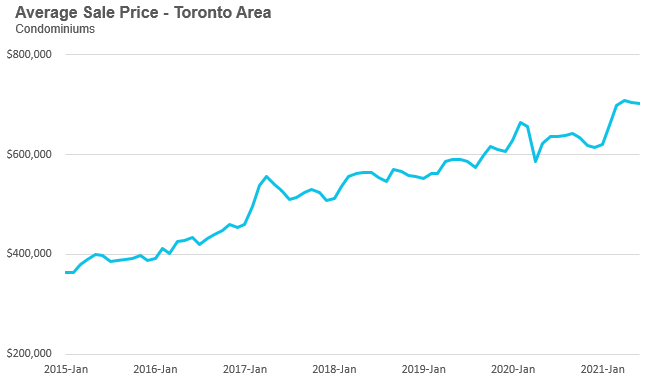
The average price for a condominium in June was $701,730 and has plateaued around the $700K range since March.
Monthly Statistics
House Statistics
House sales (detached, semi-detached, townhouse, etc.) in the Toronto area in June 2021 were up 22% over the same month last year.
Year-over-year comparisons in April and May were misleadingly inflated due to the dramatic drop in sales in April and May of the previous year due to the first round of COVID-19 lockdowns. But last June 2020 was the first month we saw an increase in buyers re-entering the market after the first round of lockdowns- so year-over-year comparisons will be more relevant going forward.
However, there is still one more COVID effect to account for as we continue to move into the summer months of July and August, when I expect to see sales begin to decline on a year-over-year basis as our comparison will be against a period of inflated home sales in 2020 caused by the demand shock of buyers rushing back into the market after the first COVID-induced lockdown.
We can also see this declining trend in house sales by looking at the change on a month-over-month basis. Sales have been declining each month since peaking in March 2021.
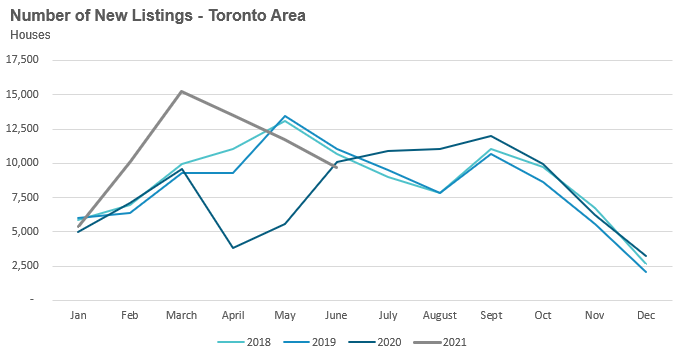
New listings in June were down 4% over last year, and much like the sales numbers, new listings are also showing a month-over-month decline since March.
The number of houses available for sale (“active listings”) was down 27% when compared to the same month last year and more than 50% below the inventory levels seen in 2018 and 2019.
The Months of Inventory ratio (MOI) looks at the number of homes available for sale in a given month divided by the number of homes that sold in that month. It answers the following question: If no more homes came on the market for sale, how long would it take for all the existing homes on the market to sell given the current level of demand?
The higher the MOI, the cooler the market is. A balanced market (a market where prices are neither rising nor falling) is one where MOI is between four to six months. The lower the MOI, the more rapidly we would expect prices to rise.
This June, the market remained very competitive with an MOI of just under 1.
While the current level of MOI gives us clues into how competitive the market is on the ground today, the direction it is moving in also gives us some clues into where the market may be heading. The MOI has remained relatively stable at or below 1 MOI for the past eight months.
The share of houses selling for more than the owner’s asking price dropped from 79% in March to 66% in June. While this figure still suggests a very hot and competitive market, at my brokerage, Realosophy Realty, we are finding that the number of offers that houses are receiving on their offer nights has declined significantly, and that in many cases houses may only get one offer; however,
a house priced lower to encourage multiple offers will still likely sell for more than the owner’s asking price because the buyer knows that the asking price does not reflect the actual market value of the house and will make their bids accordingly.
The average house price in June was $1,305,092 while the median was $1,140,500, up 21% and 26% respectively over last year.
While average house prices are up significantly over last year, house prices have plateaued in 2021 with average prices remaining relatively constant in the $1.3M range since the start of the year.
Condo Statistics
Condominium (condo) sales (condo apartments, condo townhouses, etc.) in June were up by 49% over last year. Unlike house sales, condo sales were flat on a month-over-month basis between May and June.
New condo listings were up by 2% in June 2021 over last year. Unlike the market for houses, the condo market is not seeing a dramatic month-over-month decline in new listings since March which is helping push the number of active listings up.
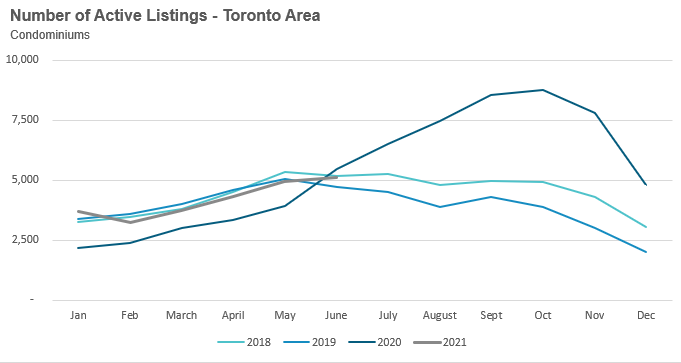
The number of condos available for sale at the end of the month, or active listings, was down 7% over last year but has been trending up since February and is inline with levels seen in 2018 and 2019.
The strong volume of new listings (supply) helped keep the MOI at 1.4 for the month of June, up from 0.8 MOI in March.
The competition for condos is easing slightly with the share of condos selling for over the asking price falling from 63% in April to 53% in June.
The average condo price in June was $701,730 while the median was $640,000, up 10% and 9% respectively over last year.
Average condo prices were in the low $600K range during the fourth quarter of 2020 and after a rapid acceleration during the first quarter of 2021 to approximately $700K, now appear to be plateauing.
Regional Trends
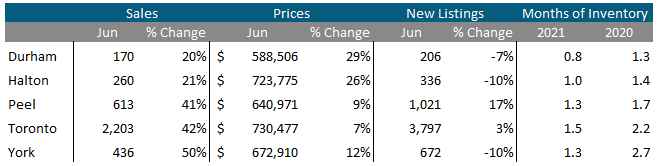
Houses
Sales across all five regions in the GTA were up in June as were average prices. Despite the increase in new listings, MOI is at 1 or below 1 across the entire GTA, indicating a strong seller’s market.
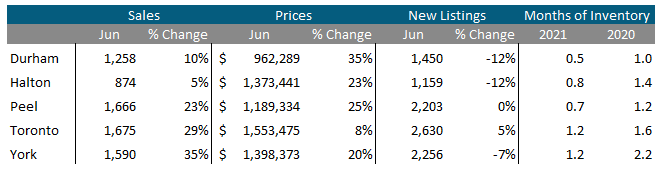
Condos
The surge in condos sales continued in June across the entire GTA. Average prices were up across the suburban regions, along with the City of Toronto. Also indicative of strong market conditions, current MOI levels are below last year’s levels for all five regions.
Browse All Live Regional Market Trends on Movesmartly.com:
Greater Toronto Area Market Trends
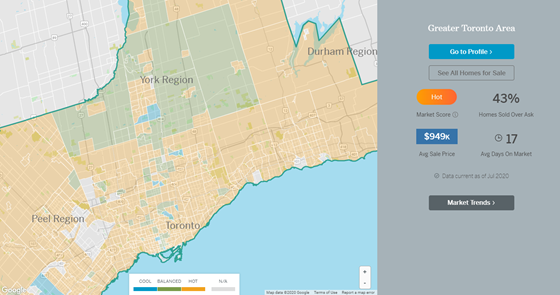
Market Performance by Neighbourhood Map, All Toronto and the GTA
GET MORE DATA
The Move Smartly monthly market report is powered by Realosophy Realty. Get the same up-to-date Toronto area market information on realosophy.com plus additional information on every home for sale, including building permit history, environmental alerts and more when you buy a home with Realosophy Realty.
Top Image Credit: Getty/iStock
The Move Smartly monthly report is powered Realosophy Realty Inc. Brokerage, an innovative residential real estate brokerage in Toronto. A leader in real estate analytics, Realosophy educates consumers at Realosophy.com and MoveSmartly.com and helps clients make better decisions when buying and selling a home.
