John Pasalis in Toronto Real Estate News
The average price for a Toronto home increased by 4% in 2009 to $395,460, the 13th straight year house values have increased in Toronto.
Browse year over year comparison charts on our new Toronto Real Estate Statistics page.
The following chart shows the average price for a home from 1975-2009.
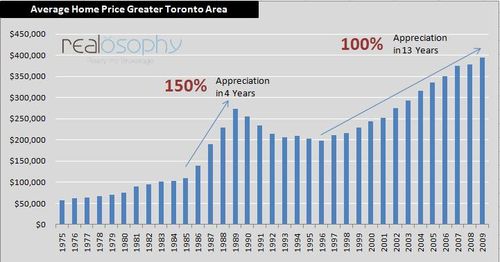
Note the difference in appreciation between the late 1980s to the appreciation we’ve seen over the past thirteen years. In the late 1980s house prices increased 150% in just 4 years compared to a 100% increase from 1996 to 2009.
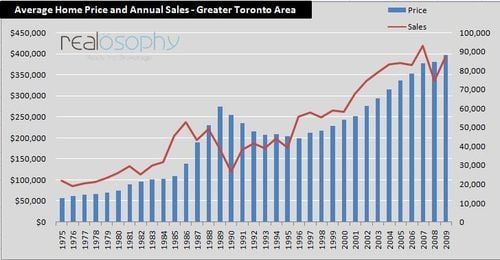
The number of house sales for 2009 increased by 11% over the previous year to 87,308. The following chart shows the average house price and total annual sales on the same chart.
“Market conditions became very tight in the latter half of 2009. Sales climbed strongly relative to the number of homes listed for sale, resulting in robust price growth that more than offset average price declines in the winter,” said Jason Mercer, TREB’s Senior Manager of Market Analysis. “A greater supply of listings in 2010 will see home prices grow at a sustainable pace.”
Download the Toronto Real Estate Board's Market Watch Report for December 2009 here.
John Pasalis is the Broker owner of Realosophy Realty Inc in Toronto. Realosophy Realty focuses on researching Toronto neighbourhoods to help their clients make smarter real estate decisions.


out of curiosity, what happened in the early 90s to cause the housing prices to drop?
Posted by: realosophy fan | January 06, 2010 at 01:12 PM
Hi Realosophy Fan,
Prices appreciated 150% in 4 years, it was a real estate bubble. But the crash was made worse by the recession and high interest rates.
You can read more in a previous post here
http://www.movesmartly.com/2008/09/how-is-torontos.html
Posted by: John Pasalis | January 06, 2010 at 02:40 PM
John, can you please tell us what changes TREB made to its boundaries, and at what point in time these changes occurred? Elsewhere, I have read that comparisons between the 1980s and later must be made with caution because of these changes.
Posted by: CinToronto | January 06, 2010 at 02:57 PM
CinToronto,
I don't think they've changed much since the mide 90's. Not sure about the 1980's. But even if they did change, I'm pretty sure they would have updated their historical data to take that into account.
Posted by: John Pasalis | January 06, 2010 at 07:41 PM
That is how real estate works! Prices of properties continues to skyrocket, yet there are still potential buyers despite the expensive price tag. Hope real estate realtors are like malls, they do monthly sale.
Posted by: 2Go Media | January 07, 2010 at 01:51 AM
Great Post and Graph!
Posted by: Cliff Peskin | January 07, 2010 at 09:08 AM
I think the slower growth more recently has been tempered somewhat by the increasing proportion of condo apartment units.
I wonder what the graph would look like for just single-detached units. Probably a much steeper increase over the past 10 years than with all unit types mixed in.
Posted by: DJWK | January 07, 2010 at 10:18 AM
I don't think you are correct, John. The oldest Market Watch on the TREB site (Jan 1996) has historical data using the same average prices that you use in your chart. The report cautions against making historical comparisons because of district changes. Another agent, Randy Emmott, says that the changes were made between 1986 and 1996. Yet another agent, Mark Argentino, writes that TREB has been expanding outward into lower price areas for years. I think the 1980s bubble was in a much smaller, more expensive part of Toronto than the TREB boundaries of today.
The reason I care about this is because you are putting yourself out as something of an expert. At times, however, you sound like just another salesperson.
Posted by: CinToronto | January 08, 2010 at 10:21 AM
Hi CinToronto,
I did a little digging after posting my last comment and was going to issue a correction but you happened to beat me to it.
My hunch that TREB updated their historical annual figures was incorrect.
With respect to your concern about changes in TREB’s boundaries, I definitely would not compare figures at an MLS district level this far back because the samples are too small and the boundaries changed a fair bit.
With respect to the annual sales figures in this post, I don’t think there’s very much to be concerned about. TREB’s figures have included most of the GTA since the early 1980s. They made a pretty big change in 92 when they introduced areas that were on the outskirts of the GTA at the time (Oshawa, Newcastle, Georgina, Tecumseth,Caledon, Oakville etc.). These additional areas accounted for just 4% of total sales in 92. But more interesting than that, more than half of these additional areas had an average house price that was at or above the total average for TREB.
So given the small sample size for this relatively big change and the fact that prices were not skewed down by the introduction of these new mls districts, I think the impact on the annual sales figures is very limited.
Posted by: John Pasalis | January 08, 2010 at 12:06 PM
Thank you for the response, John. I still think you are wrong. Adding areas that were 4% of sales means that comparisons between 1992 and 1993 would not be particularly affected. These areas have experienced tremendous growth though, and do not represent 4% of sales today. So, comparisons between 1992 (or the 1980s bubble) and 2009 need to be made more carefully. It is also not the case that these areas are on average more expensive than the old, smaller TREB area. TREB's expansion outward has had the effect of reducing average price, even if some relatively expensive areas have been included.
Posted by: CinToronto | January 09, 2010 at 03:35 PM
Thanks for the info, great post
Posted by: Akad | January 12, 2010 at 10:37 AM
Interesting data. It appear that this is happening in other parts of Canada as well. For example, real estate in Calgary has seen a increase in price as well.
Posted by: Chris Smith | January 18, 2010 at 06:02 PM