John Pasalis in Toronto Real Estate News
The Toronto Real Estate Board published their monthly sales statistics last week and the slow down we’ve been seeing in the real estate market continued in June.
Sales were down 5.4% across the GTA in June but the City of Toronto accounted for virtually all of the decline showing a 13% drop in sales. Sales in the 905 were comparable to last year.
In TREB’s press release they unfortunately attempted to explain this decline in sales by arguing that home buyers may be opting to buy homes in the 905 vs the 416 to avoid paying the City of Toronto’s land transfer tax. TREB has recently stepped up their PR efforts to get the City of Toronto to repeal the land transfer tax which explains how it suddenly crept into their press release. As I told the CBC last week, it’s silly to suggest that home buyers suddenly woke up in June 2012 (four years after the tax was introduced) and decided they want to buy a house in the suburbs rather than in Toronto because of the land transfer tax.
Instead of just focusing on the sales figures for June I thought it would be interesting to take a quick look at how the real estate market in Toronto has changed during the first six months of 2012.
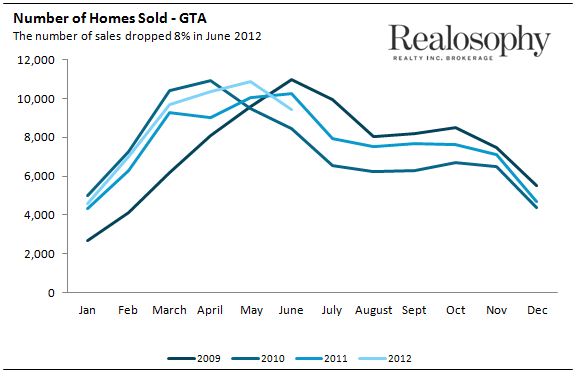
As I mentioned in a previous post, sales in Toronto got off to a very quick start in 2012 with a significant number of homes getting multiple offers. The following chart shows the number of sales per month over the past four years.
You’ll note that the sales cycles over the past 4 years have varied slightly. In 2009 and 2011 sales kept their upward trend until June before declining in July and in 2010 sales started to fall as early as May. In 2012 sales remained strong until May before dropping 8% in June.
The press made a big deal out of the decline in sales in June but the fact is that these kind of seasonal declines are normal. The decline in sales between this year and last year has a lot to do with the fact that sales were much stronger between January and May this year (up 9% over last year) so by the time we hit June there were fewer buyers in the market
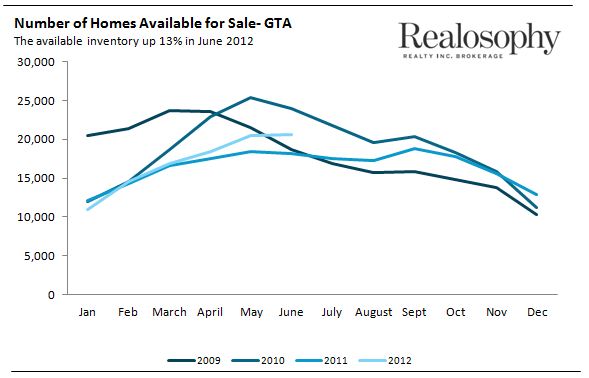
We have also seen the inventory of homes available for sale gradually increase this year. In June there were 13% more houses available for sale then there were the same time last year.
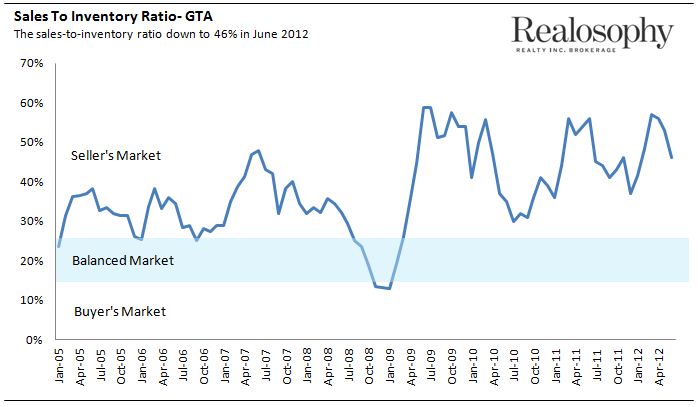
The decrease in sales and increase in inventory means that we are moving slowly towards a more balanced market. The sales-to-inventory ratio for June dropped to 46% from 53% in May. This means that in June for every 10 houses that were available for sale 4.6 actually sold.
It’s interesting to note that even though the market feels quite slow right now we are still in seller’s market territory. In order for us to move to a more balanced market we’ll need to continue to see sales drop and inventory rise.
During the first six months of 2012 we have seen a very competitive market followed by a sudden slowdown. These mini cycles are normal. We can actually see them historically by looking at the sales-to-inventory ratio (abpve chart). The higher the sales-to-inventory ratio the more competitive the market is, the lower the ratio the cooler it is.
Understanding these mini cycles is a key part of the home buying and selling process. As a seller you can’t just look at the price your neighbor got three months ago and expect to get the same price today. There are many factors that impact a home’s sale price and it’s possible that in a hot competitive market your neighbor got more than their house was actually worth.
As buyers, you need the right strategy that reflects what is happening in the market today. Back in April our company noticed that the market was showing signs of slowing down slightly and we expected this trend to continue so we advised many of our active buyers who had houses to sell to list their homes for sale immediately even though they hadn’t bought a house yet. Most agents at the time were advocating a “buy first” strategy because of the high number of multiple offers which made it difficult to buy a house. But the high volume of multiples is one of the reasons we advocated selling first. We believed that with every week that passed the market was going to be less competitive which meant that the longer our clients waited to sell the less they would get for their home.
We recommended selling first and negotiating a long closing date giving them extra time to find a house to buy. There were of course risks with this strategy, namely the risk of not being able to buy a home in the 1-2 month window they had. But for the clients who were comfortable with the risks it certainly paid off. They sold their houses for more than market value and ended up buying in a less competitive market.
The real estate market can change from one month to the next. You need a home buying and selling strategy that reflects what is happening in the market today.
John Pasalis is the President and Broker-Owner of Realosophy Realty Inc. Brokerage in Toronto. A leader in real estate analytics and pro-consumer advice, Realosophy helps clients buy or sell a home the right way. Email John
July 10, 2012
Market |


