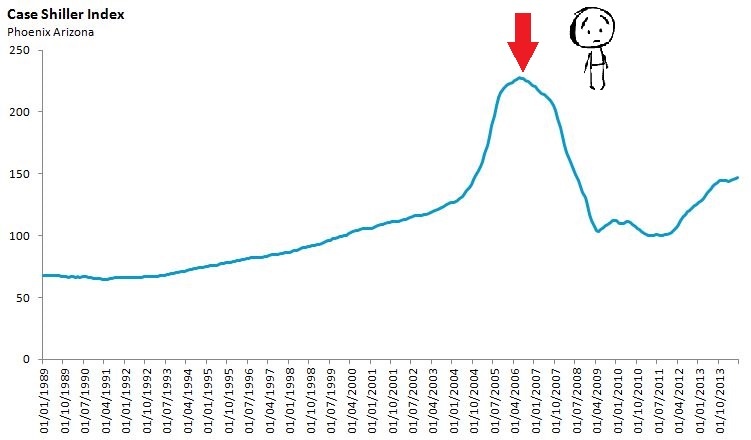
No home buyer wants to be the sad buyer in our chart below who bought their house at the absolute peak of a real estate bubble, just before prices crashed.
The chart below shows an index of house values in Phoenix Arizona.
The conventional wisdom is that it’s impossible to predict when house prices are going to decline so home buyers shouldn’t worry too much about it. While this type of thinking may hold true in the stock market where stock prices respond instantly to changes in demand – and can drop 20-30% in a single day – which makes them truly unpredictable, the same is not true about the real estate market.
House prices do not adjust instantly to changes in demand and they do not drop 20-30% in a single day. In fact many real estate economists (including Karl Case here) have found that unlike the stock market, declines in the real estate market typically follow a very predictable pattern.
Understanding this pattern can help us avoid costly mistakes.
Step 1 – Demand Drops
Declines in the real estate market typically start with a drop in the demand for homes.
Step 2- Inventory Rises
With fewer buyers in the market the inventory of homes available for sale gradually begins to rise.
Step 3 – Prices Stick
Despite the falling demand and rising inventory house prices don’t decline right away, they stick very close to where they were before demand dropped. The short answer for why prices stick in a down market is that sellers are stubborn. Sellers see what similar neighbouring houses sold for (during the peak of the market) and they want to hold out for a similar price even if it means they have to wait a bit longer to get it. Economists Karl Case and Robert Shiller found evidence of this stickiness in prices in their research that looked at how buyers and sellers act in boom and post-boom markets.
To see how the above ideas look in like in real life I’m going to walk through how the real estate market in Phoenix Arizona declined between 2005-2008. Phoenix was among the hardest hit cities during the most recent US housing crash with prices falling over 50% from their peak.
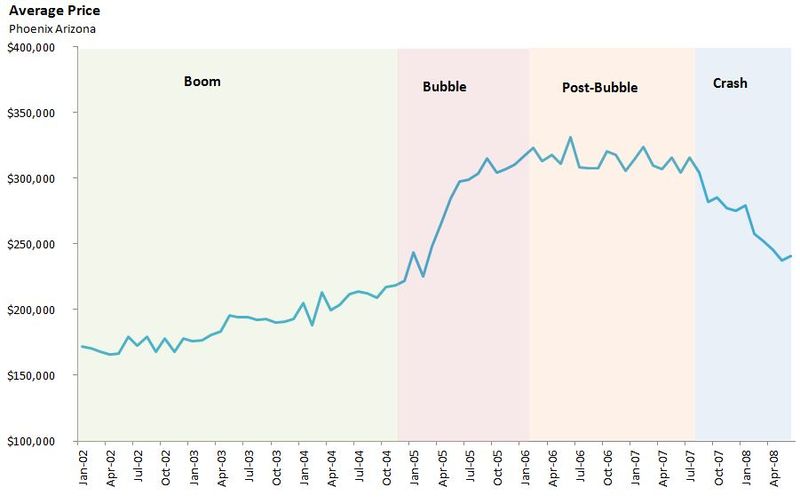
The chart below has been colour coded into four distinct periods and shows the average price of homes in Phoenix Arizona. The bubble period saw the steepest increase in house prices with the average price for a home rising over 50% in one year. Between 2006 to late 2007, the post-bubble period, prices remained relatively flat before finally falling in late 2007.
By looking at the above chart, and in particular only up to the post-bubble period, there’s no obvious sign that prices were going to fall in late 2007. House prices could have leveled off and maintained the plateau they reached in 2007 and they also could have increased as many pundits predicted in 2006 and 2007.
The conventional wisdom tells us that figuring out whether prices were going to go up, down or remain flat after the post-bubble period was completely unpredictable at that time.
But if we ignore what we’ve been told and the real estate market and instead listen to what economists like Case have found, we know that housing declines begin with a drop in demand.
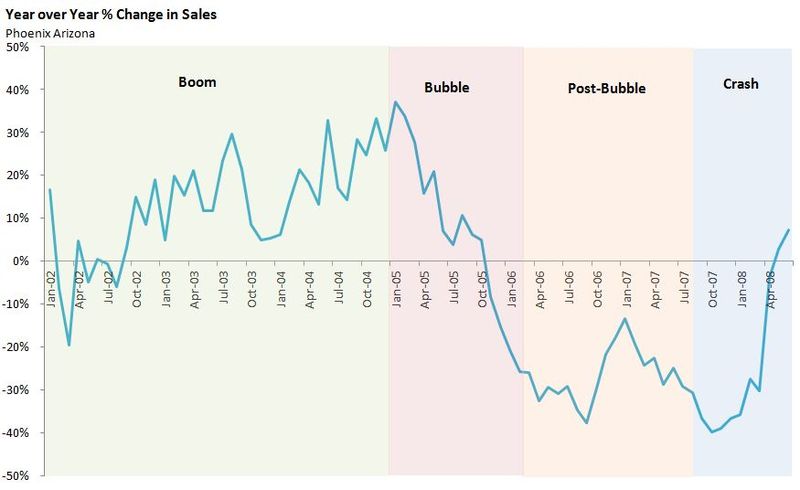
When we look at the change in sales (demand) in the market, we see a slightly different picture from the one above.
The above chart shows the year over year change in sales which we can see reached its peak at the beginning of the bubble period but then fell rapidly during that year. By the end of the bubble period sales were down 30% over the previous year and remained in negative territory for over two years.
The next predictable step is that the inventory of homes begins to rise.
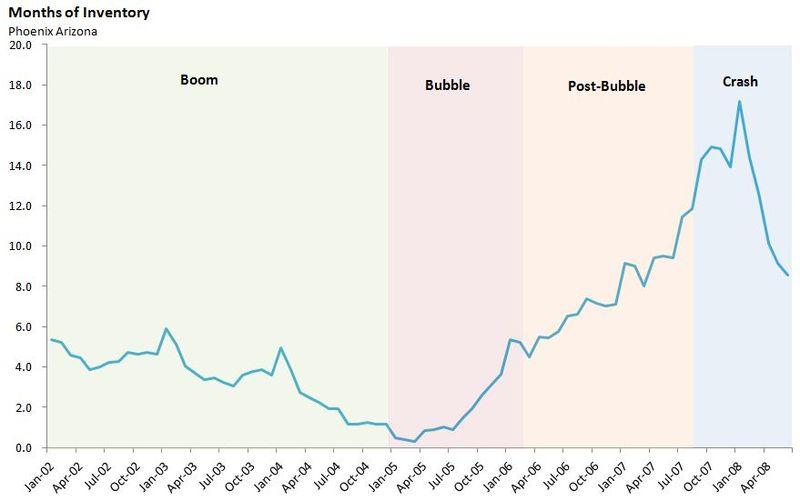
The chart below shows the months of inventory for Phoenix during the same period. The months of inventory is a metric we use to gauge how many homes are available for sale in a given month. It approximates how many months it would take to sell all the homes currently available for sale.
We can see that the months of inventory was the lowest at the beginning of the bubble period (at 0.5 months) and increased rapidly to over 5 months of inventory within a year. To put this into context the average months of inventory in Toronto is just under 2 months and if we look at just the condo market in Toronto, there is just under 3 months of inventory in Toronto’s condo market.
If we just focus on our condo market and try to imagine Toronto had twice as many condos available for sale each month - that would give us a pretty good idea of what five months of inventory looks like in the real estate market.
It’s in the post-bubble period where we see can begin to see the final step in this predictable process, where house prices stick even though inventory is rising.
The number of homes available for sale ballooned during the post-bubble period with the months of inventory climbing from five months to twelve months. Despite this surge in the inventory of homes, prices remained pretty much unchanged during the post-bubble period (refer to average price chart above).
This price stickiness happens because home owners are for the most part very predictable when it comes to their desire to maximize the sale price of their home. Surveys by Case and Shiller found that in declining markets sellers are most inclined to either:
- Keep their asking price the same knowing full well it might take a long time for their house to sell
- Take their home off the market.
- Lower their price step by step hoping to find a buyer.
Relatively few sellers are willing to lower their price aggressively until a buyer is found.
Prices eventually fell in Phoenix because their market reached a point where there were far too many homes available for sale, which was partly driven by an oversupply of newly built homes. Eventually, even the most stubborn seller had to give in to this imbalance between supply and demand.
In my recent post titled The Science of Home Buying, I quoted nobel prize winning economist Paul Krugman who said this about real estate markets:
In fact, prices often keep rising for a while even after a housing boom goes bust.
The above charts highlight Krugman’s point. The common assumption is that the housing boom goes bust when prices fall. But we can see pretty clearly that the housing boom in Phoenix went bust years before prices started to fall. We can see the bust through the plummeting demand and the steep increase in the number of homes available for sale.
So if the bust was so obvious why did any home buyer buy at the peak? The reality is that the bust wasn’t obvious to the average home buyer because the average buyer wasn’t looking at the data the way we are today. The fact that real estate prices stick in down markets is not part of the common wisdom about real estate markets, most buyers still believe real estate markets are completely unpredictable – like the stock market.
Smart buyers know better.
Sign up for my talk here or below where I’ll walk through what the data is telling us about Toronto's real estate market and share more examples of how buyers can avoid making preventable mistakes (like buying at the peak of a bubble).
John Pasalis is the President and Broker of Realosophy Realty Inc. Brokerage in Toronto. A leader in real estate analytics and pro-consumer advice, Realosophy helps clients buy or sell a home the right way. Email John
February 24, 2016
Buying |


