
Why we are not out of the Sugar Maples by a long shot.
Last Friday Statistics Canada confirmed that our economy added another 378,000 jobs last month, well above the consensus forecast of 150,000.
Our employment data are notoriously volatile, to the point where Stats Can’s monthly Labour Force Survey is sometimes jokingly referred to as “the random number generator.”
That said, if the recent data are anywhere near accurate, there is no denying that our jobs recovery is evolving at a much more robust pace than previously expected.
Will it continue?
That’s an important question for anyone keeping an eye on mortgage rates, because most forecasters now predict that those rates won’t rise materially for quite some time (some predict it will take until 2022, while others, myself included, now expect that it will take until 2023 or later).
If we keep adding jobs at the current rate, maybe our economic recovery won’t be as “slow and painful” as the Bank of Canada (BoC) recently predicted. Mortgage rates would move up sooner if that proves to be the case.
To study this question, let’s begin with a look at some of the details in last week’s stronger-than-expected employment report:
- The total number of net jobs lost to COVID fell to 720,000 in September. That’s down from a peak of 3 million in April.
- The number of Canadians who worked less than half of their normal hours dropped to 605,000 in September, down from a peak of 2.5 million in April.
- The benefits of children returning to school was evident. Core-age women (who are defined as between the ages of 25 and 54) with children aged 18 and younger started 171,000 new jobs in September. That puts core-aged women within 2.1% of their pre-COVID employment levels, which Stats Can noted is the narrowest gap among all major demographic groups.
- Service-sector employment increased by 303,000 jobs last month, led by a 72,000 gain in accommodation and food services. (Although, in a broader context, this sub-sector is still down 188,000 jobs from its pre-COVID level and is the furthest away from a full recovery.)
- Three-quarters of the remaining lost jobs are now confined to four industries: accommodation and food services, retail trade, construction, and transportation and warehousing.
- Low-wage employees, whom Stats Can defines as those earning $16/hr or less, remain the hardest hit. In September, low-wage employment was still down 22.1% on a year-over-year basis, while other wage groups (combined) are now actually up 2.3%. At its peak, low-wage employment was down 38.1% on a year-over-year basis, compared to an overall drop of 12.7% across all wage groups. Simply put, and to quote economist Benjamin Tal, “the lower the wage, the more dramatic the remaining jobs gap.”
For now, job losses have been skewed towards workers who are only marginally attached to the work force. Many of them work in the gig economy. The numbers also skew disproportionately towards the 15-24 age group, which has accounted for 35% of the net jobs lost since February.
That explains why real-estate markets have largely shrugged off COVID’s initial economic impacts. Low wage-earners are far more likely to be renters than property owners. That said, landlords who own condos that they rent still miss their rental income, and that helps to explain why condo prices have been softening of late in Toronto and Vancouver.
Let’s now step back from the detail and look at the broader employment picture.
The BoC recently explained that our recovery would occur in three phases: containment, reopening and recuperation.
Over the past several months our economy has been transitioning from the reopening phase to the recuperation phase, but that changed in late September when our policy makers responded to the recent surge in COVID infection rates by re-tightening lockdown measures.
Many businesses that barely hung on during the first lockdown won’t survive a second wave. Employment losses that have been restricted to low-wage earners may well now spread into higher wage groups.
Here is a chart to illustrate how the jobs recovery will most likely play out, courtesy of Manulife Investment Management:
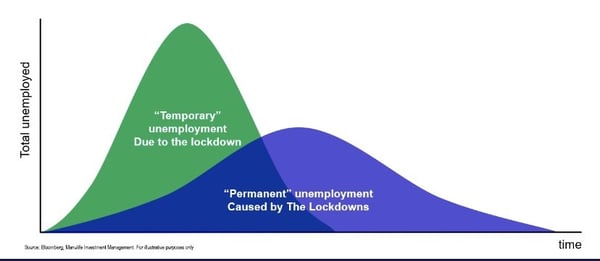
The green curve is consistent with the recent employment data. We see a temporary spike in job losses followed by a recovery that offsets much of the initial impact. But then as businesses close, the blue curve rises, and permanent job losses start to mount.
Businesses have been hard pressed for many reasons in addition to mandatory shutdowns. Some have experienced supply-chain disruptions or simply don’t have enough cash to ride out another shutdown. But others have been impacted by changes in consumer behaviour that have caused longer-lasting losses in demand for a product or service that may become permanent.
Economist David Rosenberg explained that one of the qualitative differences between recessions and outright depressions is that after recessions, things return to the way they were before. Depressions produce permanent changes in behaviour. Which one would you say we are experiencing now?
COVID has obviously dragged us into a period of major economic disruption. Thus far our policy makers have tried to counteract the negative shocks with massive stimulus, but that will only work over the short term. Keeping companies alive on government support isn’t a long-term strategy because it will impede the creation of new businesses tailored to meet new consumer demands (which is a lengthy and painful process under even ideal circumstances).
Isolated job losses and generous government stimulus programs have protected most Canadian workers to date, and they have also benefitted from emergency low borrowing rates and payment-deferral programs in the bargain. But if the second wave triggers more business failures and an increase in viral contagion spurs an increase in economic contagion, our employment picture will look very different.
The BoC understood this risk when it predicted that our recuperation phase would be slow and painful, and a short-term surge in the employment data isn’t going to convince the Bank otherwise.
.jpg?width=600&name=Rate%20Table%20(October%2013,%202020).jpg)
The Bottom Line: Five-year fixed and variable mortgage rates continue to inch down last week, and I don’t think September’s stronger-than-expected employment data will do anything to reverse that trend.
That latest employment report isn’t saying that we’ll be out of the woods any time soon, but it is saying that low-income wage earners need all the help they can get. Remember that, and tip generously if and when you can.
Image credit: iStock/Getty Images
David Larock is an independent full-time mortgage broker and industry insider who works with Canadian borrowers from coast to coast. David's posts appear on Mondays on this blog, Move Smartly, and on his blog, Integrated Mortgage Planners/blog.
Published: October 14, 2020


