
In last week’s post I made the case for five-year variable rates over their fixed-rate equivalents, based on my current view of where our economy is headed.
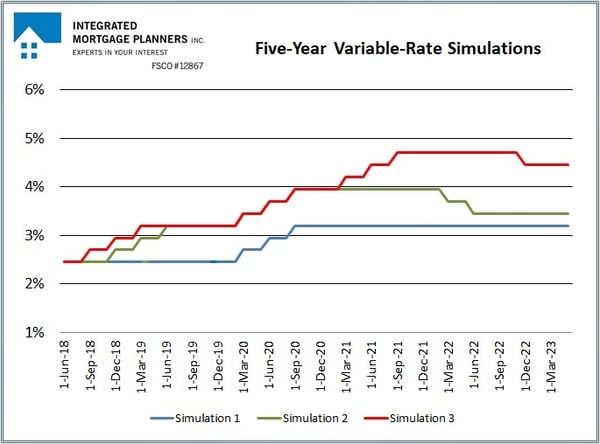
Today, I’ll simulate three different scenarios for variable rates over the next five years - one where the variable rate saves you money, one where fixed and variable rates break even, and another where the fixed rate wins out. You can then decide for yourself which rate path seems most likely for the years ahead.
Let’s start with a quick outline of the assumptions that I used to run the numbers:
- Purchase price: $600,000
- Mortgage amount: $480,000
- Amortization period: 25 years
- Five-year variable rate: 2.45% (today’s prime rate minus 1.00%)
- Initial variable-rate monthly payment: $2,138
- Five-year fixed rate: 3.39%
- Fixed-rate monthly payment: $2,369
In each simulation we’ll compare the total interest cost of the fixed and variable-rate options, with one additional wrinkle.
I always advise my variable-rate borrowers to make their monthly mortgage payment equivalent to what it would have been if they had taken a five-year fixed rate instead. They can do this by calling their lender and asking them to automatically take an additional monthly payment that is equal to the initial difference between the two rates (which in this case works out to $231). Note that Canadian mortgages typically come with generous prepayment allowances, there is no cost/fee for making additional payments, and they can be cancelled at any time.
Variable-rate borrowers who use their initial interest-rate saving to accelerate their mortgage repayment in this way can significantly reduce their total borrowing cost over time. To illustrate the impact that this make-hay-while-the-sun-shines approach can have, I will add a borrower who uses this trick to each simulation, and we’ll call that borrower Mr. Samar T. Pants.
Simulation #1 – Variable Wins
The BoC has used the word caution a lot in recent commentaries, and in simulation #1 we assume that the future unfolds roughly as follows:
- Canadian Economy – Our GDP grew by an average of 3% in 2017, but it had slowed to 1.7% by the fourth quarter and continued to sputter at the start of 2018. This simulation assumes that GDP growth hovers at about 2% in the years ahead, and that estimate is fairly consistent with the BoC’s current GDP forecasts of 2.0% in 2018, 2.1% in 2019 and 1.8% in 2020.
- U.S. Economy – U.S. GDP growth has declined for three straight quarters to 2.3% in the first quarter of 2018. Here we assume that the U.S. federal government’s recently enacted (and ill-advised) tax cuts and spending stimulus force the U.S. Federal Reserve to continue raising its policy rate several more times in 2018 to stave off rising inflationary pressures. By 2019, the Fed’s ongoing rate hikes choke off growth, and the second longest economic expansion in U.S. history comes to an end as the U.S. economy enters a recession. It doesn’t last long, but the ensuing recovery is stifled by high debt levels and the federal government’s huge budget deficit (which limits its ability to provide additional stimulus and help spur growth). The BoC is currently projecting 2.7% GDP growth for the U.S. economy in 2018 and 2019, and then a drop to 2.0% growth in 2020, so its expectations are far more optimistic.
- Inflation – Canadian inflationary pressures have been rising of late and our overall CPI came in at 2.2% in April, which is above the BoC’s 2% target. But the Bank is predicting that the current rise is fuelled by temporary factors that will dissipate over time, and in this simulation the BoC’s belief that our economy has more room for non-inflationary growth than the bond market currently expects proves correct. The Bank is currently expecting our overall CPI to rise by 2.3% in 2018 and by 2.1% in 2019 and 2020.
- Exports and Investment – The simulation assumes that export growth is hampered by ongoing NAFTA uncertainty, by a lofty Loonie and by a reduction in American consumer spending (relating to the forecast made for the U.S. economy above). These factors, combined with slowing consumer demand at home, also weigh down business investment. The BoC’s current forecast is a bit rosier. It expects no export growth in 2018 but then projects that exports will add 0.9% to our overall GDP growth in 2019 and 0.8% in 2020 (which would be significant). Meanwhile, business investment is expected to contribute 0.4% to our GDP growth in 2018 and 0.3% thereafter.
- Consumption, Debt and House Prices – Simulation #1 assumes that recent interest-rate increases slow overall household borrowing and reduce consumption. Mortgage credit growth slows in response to the latest round of mortgage rule changes and real-estate markets across the country continue to cool. This evolution allows the BoC to hold its policy rate steady and to maintain the cautious approach that it currently espouses. The Bank currently expects that consumption’s contribution to our GDP growth will fall steadily from 1.5% in 2018 to 1.2% in 2019 to 1.0% by 2020. Meanwhile, the BoC doesn’t expect housing to contribute to GDP growth at all in 2018 and 2019 and forecasts that housing will actually reduce our GDP by 0.1% in 2020. Simulation #1 basically assumes that the BoC’s projections for consumption, debt and house prices are on the mark.
Simulation #1 Summary: We assume that the two additional rate increases that the bond market consensus is expecting in 2018 do not materialize. Instead, the BoC waits about two years for the three 0.25% rate increases it made between July 2017 and January 2018 to work their way through the economy (which is how long the Bank has estimated that complete process can take). The BoC doesn’t raise its policy rate again until March of 2020, when it repeats the pattern we saw in 2017, raising a total of three times with about a three-month gap in between each hike. The Bank then allows time for the economic impact of those rate hikes to be fully absorbed.
The chart below summarizes how today’s five year fixed- and variable-rate borrowers will fare under this scenario:

In this simulation the variable-rate saving is significant.
Note: As variable rates rose and his regular payment increased, Mr. Samar T. Pants asked his lender to reduce his extra payment by the same amount each time. This meant that his total monthly payment of $2,369 stayed the same throughout his term. And while his extra monthly payment of $231 got smaller as rates rose, Mr. Samar T. Pants’ mortgage balance is still an additional $8,000 lower at renewal (and that will reduce his interest cost over the remainder of his amortization period).
Simulation #2 – A Fixed/Variable Tie
In Simulation #2 the Canadian and U.S. economies show more resilience than is expected in Simulation #1, and inflationary pressures prove more persistent.
- Canadian Economy – While our overall GDP declined by 0.1% in January, the 0.4% GDP growth we saw in February ends up being the first sign of a sustainable uptrend. As our economic momentum increases, the BoC feels more confident about continuing to raise its overnight rate (which our variable-rate mortgages are priced on).
- U.S. Economy – The U.S. federal government’s tax cuts and spending stimulus spur economic growth, and tough talk about tariffs and trade wars dissipates. U.S. GDP growth rebounds to 2.7%, in line with the BoC’s current forecast, but inflationary pressures also rise and the U.S. economy overheats. The Canadian economy imports rising U.S. inflation over time and that compels the BoC to continue raising rates to relieve our own inflationary pressures.
- Inflation – Inflationary pressures prove more stubborn than the BoC expected. Stronger-than-expected GDP growth increases the demand for labour, and labour costs rise. Also, businesses have difficulty adjusting to increases in demand after years of neglecting investments in capacity expansion and productivity enhancements, and that also fuels price rises.
- Exports and Investment – The NAFTA talks are wound up and the final agreement leaves the Canada/U.S. trade relationship still on solid footing. Meanwhile, the Loonie weakens when the BoC lags the Fed’s rate-hike timetable, and stronger-than-expected U.S. consumer spending also gives our exporters a boost. Canadian businesses become more confident as the NAFTA uncertainty dissipates and they invest in capacity expansion. This increases our economy’s maximum potential output and gives it more room for non-inflationary growth.
- Consumption, Debt and House Prices – As our economic momentum increases, the demand for labour rises alongside it, and average wage growth continues to outpace inflation. This increases the purchasing power of the average consumer, and consumption levels rise. The real-estate market cooling that we saw in 2018 levels off and regional housing markets are mostly balanced.
Simulation #2 Summary: We assume that the BoC raises its policy rate by 0.25% three times between this December and next June. Then, as U.S. inflationary pressures continue to rise and we import that inflation over time, the BoC raises by 0.25% three more times between March 2020 and September 2020. After that point, in year four of the borrower’s five-year term (2022), we assume that the cumulative impact from the BoC and Fed rate increases pushes both economies into recession. The BoC then cuts rates by 0.25% in both March and June of 2022. (If the BoC rate cuts seem crazy in the current context, consider that we haven’t had a single five-year period over the last twenty-eight years that didn’t include at least one cut).
The chart below summarizes how today’s five-year fixed- and variable-rate borrowers will fare under this scenario:
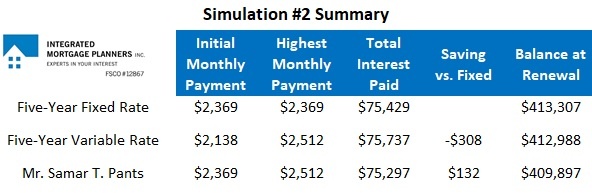
In this simulation today’s five-year fixed and variable rates basically break even.
Note: Even though the variable rate rose by 0.25% six times over his term, Mr. Samar T. Pants still ends up with a lower balance at renewal because he used his initial saving to accelerate his mortgage repayment. And Samar T. didn’t actually have to increase his monthly payment until the fourth rate increase (because he reduced his extra payment of $231 to absorb the the earlier increases instead).
Simulation #3 – The Fixed Rate Wins
In Simulation #2 inflation rears its ugly head and the BoC and the U.S. Federal Reserve have no choice but to hike their policy rates precipitously in response.
- Canadian Economy – In Simulation # 3 we assume that our GDP growth accelerates more quickly than expected and rapidly absorbs our economy’s remaining spare capacity. Alternatively, in a worst-case scenario, our economic growth could stagnate while prices rise anyway, perhaps pushed higher by rising oil prices and a shortage of skilled labour. In either case, the BoC has to rapidly raise rates to stave off inflationary pressures.
- U.S. Economy – The U.S. economy is already operating at or even above its full capacity and the U.S. federal government’s recent tax cuts and spending stimulus cause it to overheat. At that point, wage growth, which often responds to improving economic conditions with a lag, takes off. The Fed raises its policy rate repeatedly in response.
- Inflation – Inflation accelerates to a degree that leaves the BoC no choice but to aggressively hike its overnight rate. That acceleration is likely to be fueled by a combination of rising labour costs, higher oil prices, a general rise in commodity prices and/or sustained weakness in the Loonie (which raises the cost of our imports). If we’re lucky, these price rises will be a result of improving economic momentum.
- Exports and Investment – Here we assume that stronger-than-expected U.S. economic growth causes a surge in demand for our exports. At the same time, the NAFTA talks are resolved more quickly than expected and Canadian businesses ramp up production, investing in expansion and productivity enhancements. Supply shortages ensue and as the demand for labour steadily increases and wage costs rise, the BoC becomes more confident that our economy can withstand the additional rate increases that are needed to keep it from overheating.
- Consumption, Debt and House Prices – This simulation assumes that wage growth is robust and that after a short pause, the hottest real-estate markets recover their upward trajectories. Consumption rates are higher than expected but so are borrowing rates. These trends convince the BoC that more rate rises are necessary.
Simulation #3 Summary: We assume that the BoC raises its policy rate by 0.25% this September and then again in December and March of 2019. The Bank then pauses to allow those rate increases to work their way into our economy. By early 2020 the BoC decides that more tightening is needed, and it raises again by 0.25% in March, June and September of that year. The same pattern then repeats. The Bank pauses to observe the impact of its rate hikes before raising by 0.25% in March, June and September of 2021. Finally, after nine 0.25% rate hikes, our economy falls into recession and the BoC begins to cut its overnight rate in December 2022.
The chart below summarizes how today’s five-year fixed- and variable-rate borrowers would fare under this scenario:
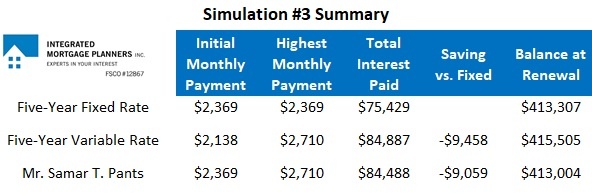
In this simulation today’s five-year fixed rate proves the far cheaper option.
While Mr. Samar T. Pants no doubt wishes that he had opted for a five-year fixed rate, by setting his initial variable-rate payment as if he had taken the fixed rate, he experienced less payment shock than a variable-rate borrower who just paid the minimum. Samar T. started his payment at $2,369 and it eventually peaked at $2,710, which was an increase of $341/month. Meanwhile, the variable-rate borrower who always paid the minimum saw his initial payment rise by $572/month (and his balance was also $2,500 at renewal).
.jpg?width=600&name=Rate%20Table%20(May%2022%202018).jpg)
David Larock is an independent mortgage broker and industry insider specializing in helping clients purchase, refinance or renew their mortgages. David's posts appear on Mondays on this blog, Move Smartly, and on his own blog, Integrated Mortgage Planners.
Published: May 22, 2018


