With key housing metrics giving a mixed message on demand in Prince Edward County in the second quarter of the year, new home sales continue to climb.
Summary
The key housing metrics gave a mixed message in the second quarter of this year, with some pointing to stronger demand and others suggesting the opposite. On another front, new home sales continued to grow dramatically in their share of the market (admittedly starting from a very low level in previous years).
Listings Grew Fuelled By New Homes
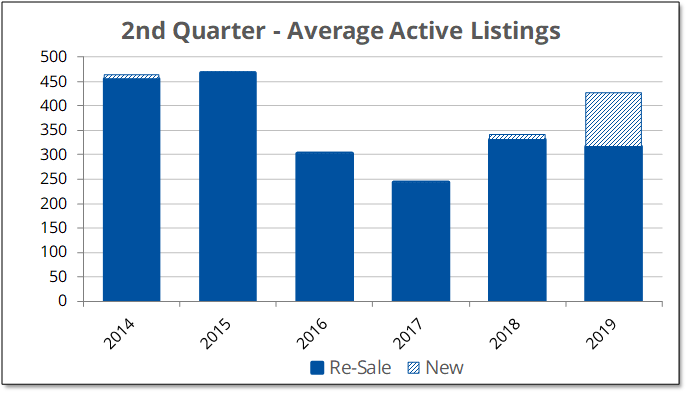
Starting with the good news for buyers, the number of MLS listings on the market at any given time during the quarter increased significantly from last year. This increase in overall supply potentially means more competition among sellers.
On closer scrutiny, it becomes clear that the markets for re-sale and newly-built homes moved in different ways. For re-sale homes, the number listed fell slightly and selection was not as good as a year ago. On the other hand, listings for newly-built homes grew significantly over last year. (The growth of new listings does not directly translate into improved selection because builders often have several listings of the same model.)
Sales Up For New Builds Up, Down For Re-Sales
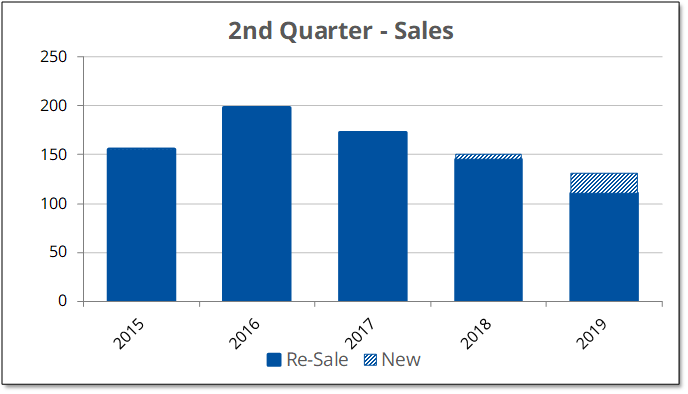
Second quarter sales told a similar story. Although the month of June saw the highest monthly sales since the peak of the bubble market in the summer of 2017, combined sales for April, May and June fell compared to last year. Once again this was the outcome of two different trends: the number of re-sale homes fell while the number of newly-built homes sold increased from last year.
Homes Took Longer To Sell
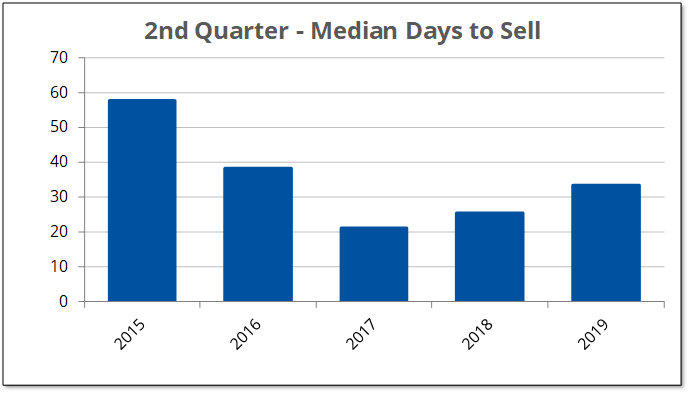
Homes sold quickly during the hot market in 2017, when the median time needed to sell a house approached 20 days. The number of days needed to sell increased last year and then again this year. (Although homes took longer to sell during the last quarter than they did in 2018, they are still selling faster than they did in 2015-16 before the bubble.) When homes take longer to sell, it usually points to an excess of supply over demand.
Selling Closer To Listing Price
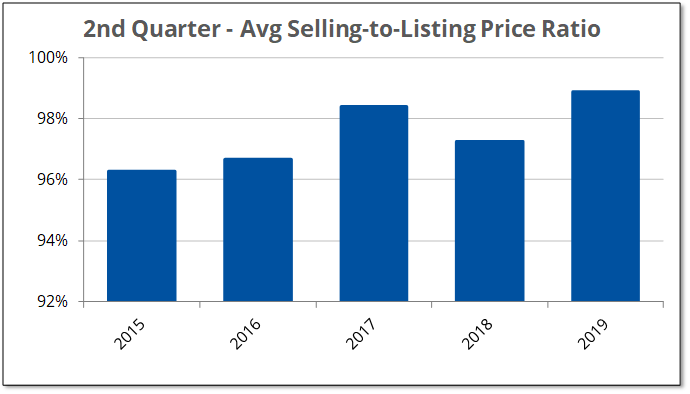
While the decline in sales of previously-owned homes would suggest that the market softened this year, the selling-to-listing price ratio told a different story. The ratio increased compared to last year with homes selling closer to listing price on average than they did last year.
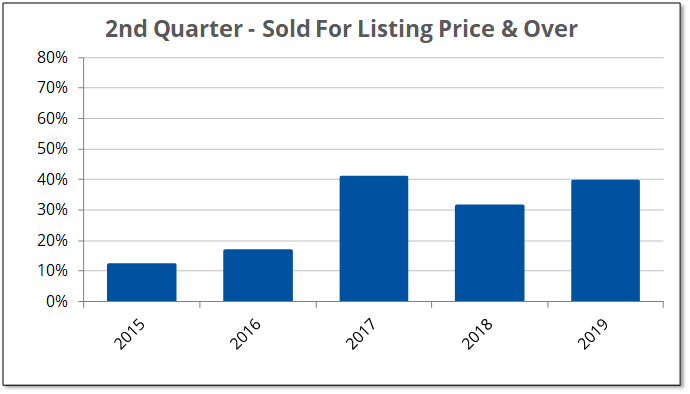
The same data can be presented in another way which may be more intuitive. The chart (above) shows that during the hot market in 2017, the percentage of homes on MLS selling for the listing price or more reached an all-time high of 41%. The percentage fell last year but has increased since then reaching 39% during the second quarter this year. Put differently, the majority of homes (61%) sold last quarter went for less than listing price, but this percentage shrunk compared to last year.
Median Price Resumes Its Climb
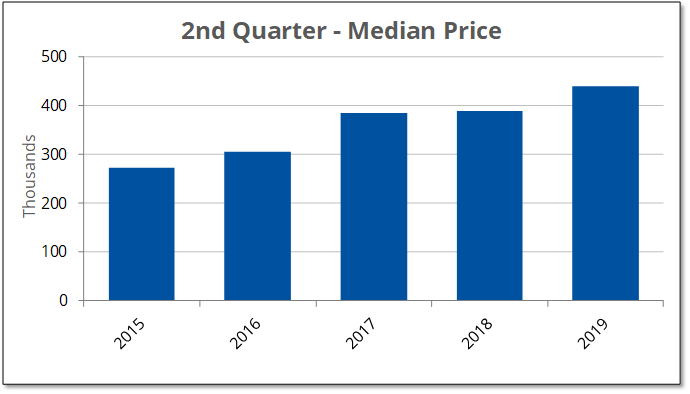
After a rapid increase during the hot market of 2016-17, the median price for homes sold in the County showed almost no increase last year. However, this year prices resumed their climb with the median price increasing by 14% compared to the second quarter of 2018.
In total, the median price of homes selling on MLS increased by 61% between 2015 and 2019.
Top image credit: SimplyCreativePhotography
Treat Hull spent three decades as a management consultant and marketing executive before moving to the County and taking up real estate. He is broker/owner of Treat Hull & Associates Ltd., a Prince Edward County brokerage which takes no listings and represents only buyers.
Published: July 30, 2019