
Home sales across the Greater Toronto Area remained historically low in June, continuing a multi-year trend of subdued activity that has kept sales volumes near 20-year lows. But what sets this year apart is the sheer number of homes now sitting on the market.
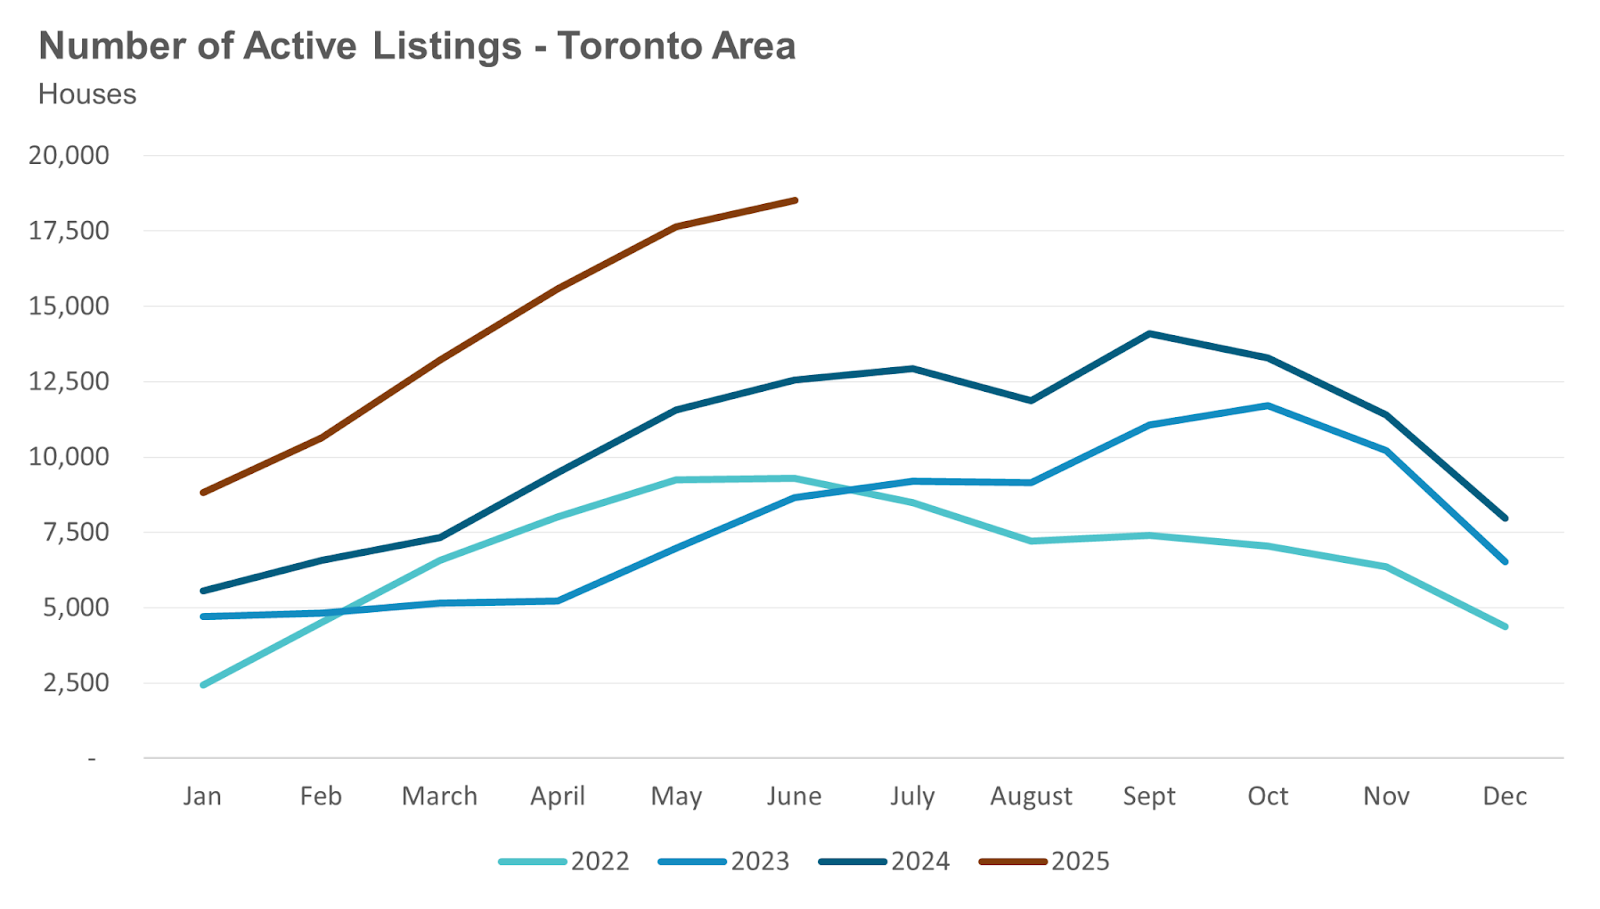
Detached home inventory has surged to over 14,000 active listings—more than double the 6,519 available in June 2023 and 65% above the 10-year average for this month. This is the highest June inventory level for detached homes since 2008, in the aftermath of the global financial crisis.
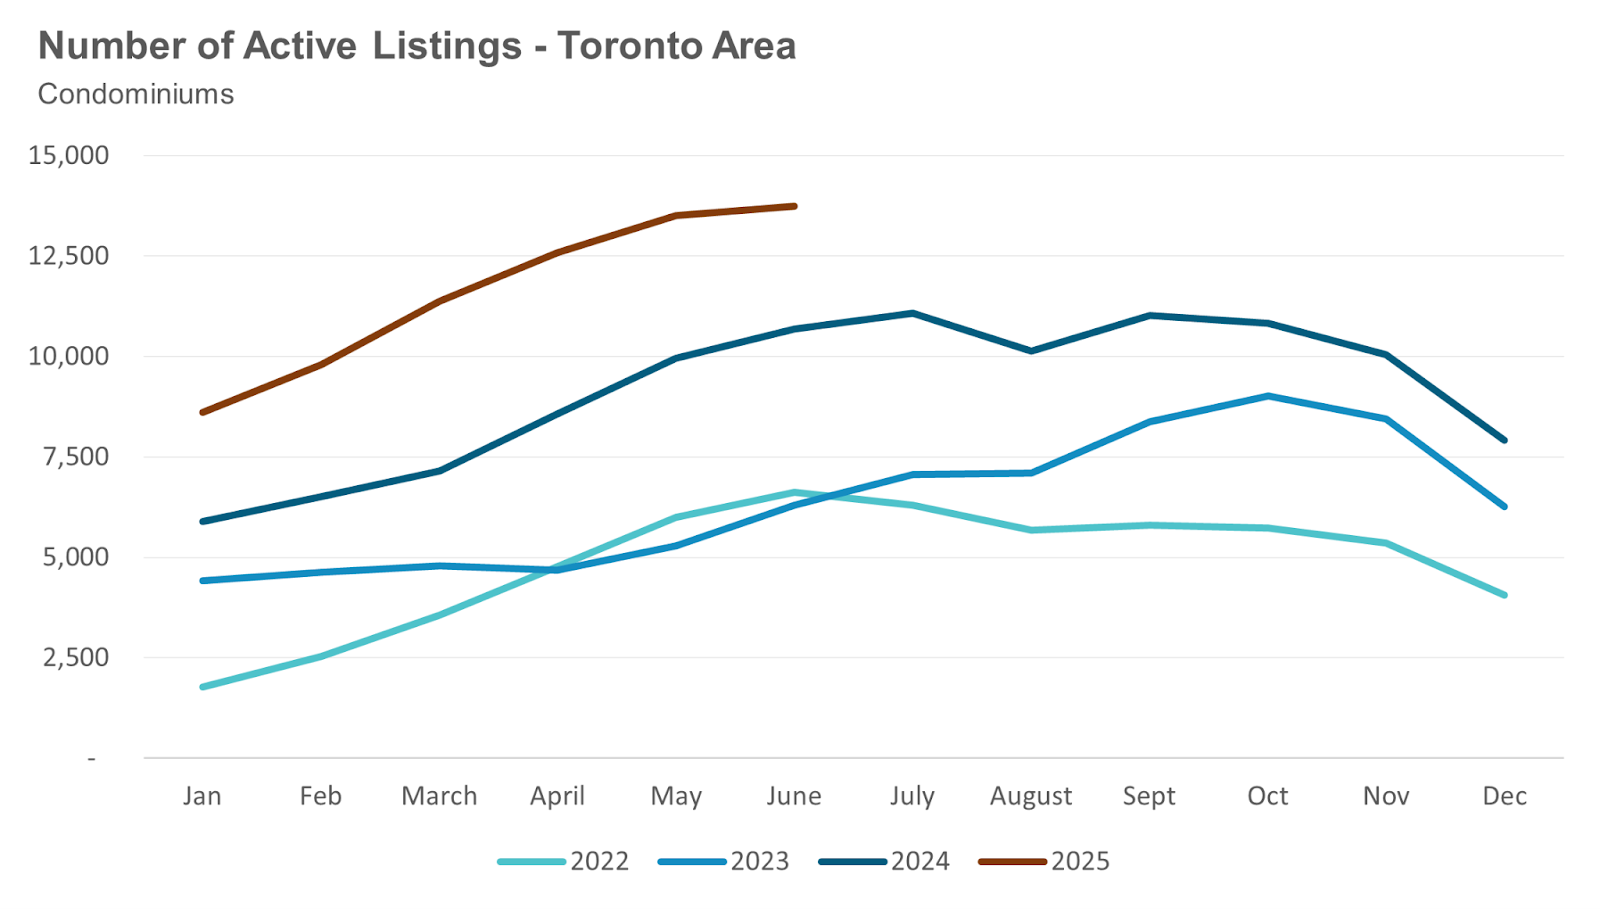
The condo market is seeing a similar dynamic. The number of condo apartments for sale has doubled compared to last year, climbing from 4,848 in June 2023 to over 10,000 today—marking an all-time record and well above the 10-year seasonal average.
This steady buildup of listings over the past few years has pushed active inventory to levels that are now putting downward pressure on prices, which are about 5% lower than a year ago.
Looking ahead, activity will likely stay muted through the summer as many buyers put their searches on hold. The real test will come in the fall. A new trade deal with the U.S. could help stabilize buyer sentiment, but with economic uncertainty still lingering, households facing job insecurity may remain cautious about making a move.
LIVE MARKET UPDATE: WATCH REPORT HIGHLIGHTS & Q/A - THURSDAY JULY 10th 12PM ET

Join John Pasalis, report author, market analyst and President of Realosophy Realty, in a free monthly webinar as he and his guests discus key highlights and answers your questions. A must see for Toronto area real estate consumers!
By the Numbers: June 2025
The average price for a house in the Toronto area was $1,303,089 in June, down 6% from the same month last year. Last month's median house price was $1,130,000, down 6% from the same month last year.
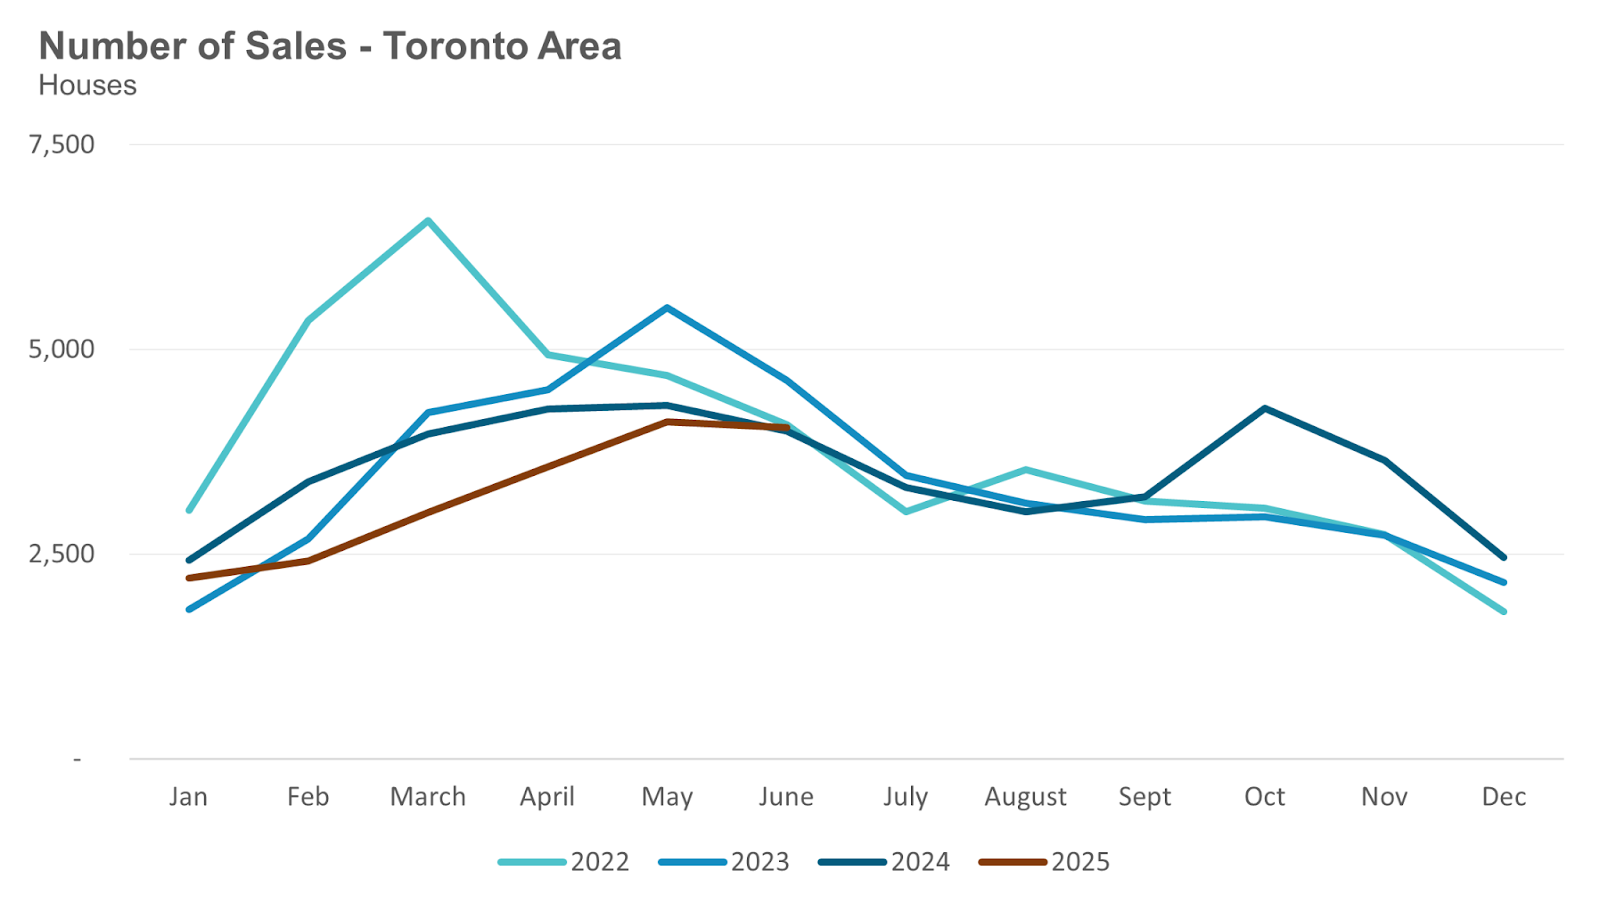
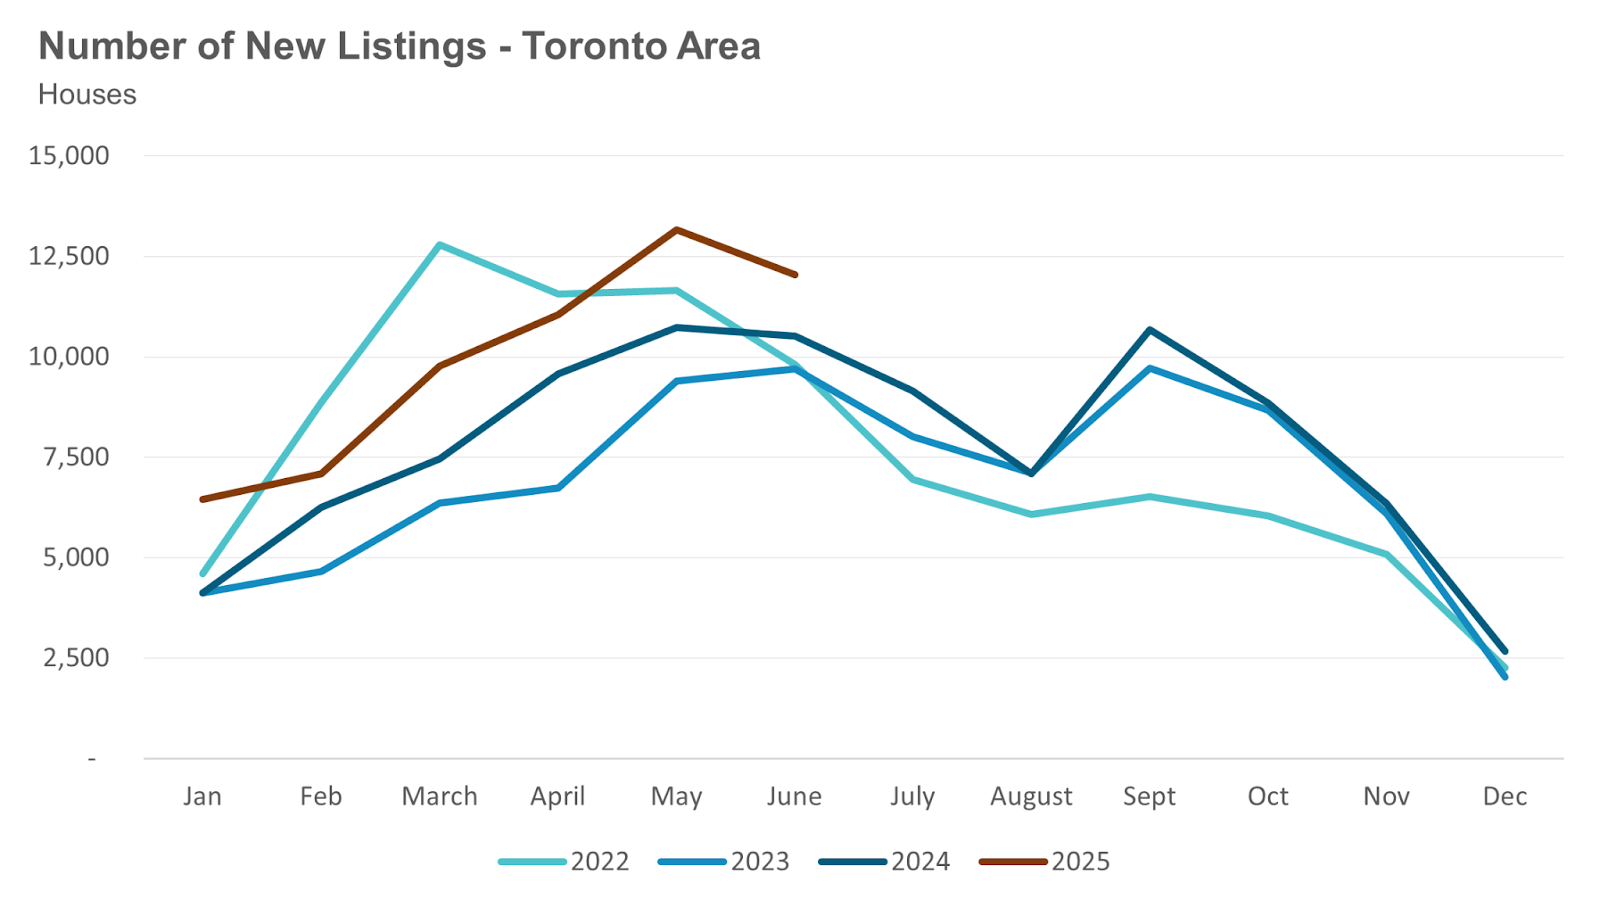
House sales in June were up 1% over last year, while new house listings were up 15%. The number of houses available for sale at the end of the month, or active listings, was up 48% over last year.
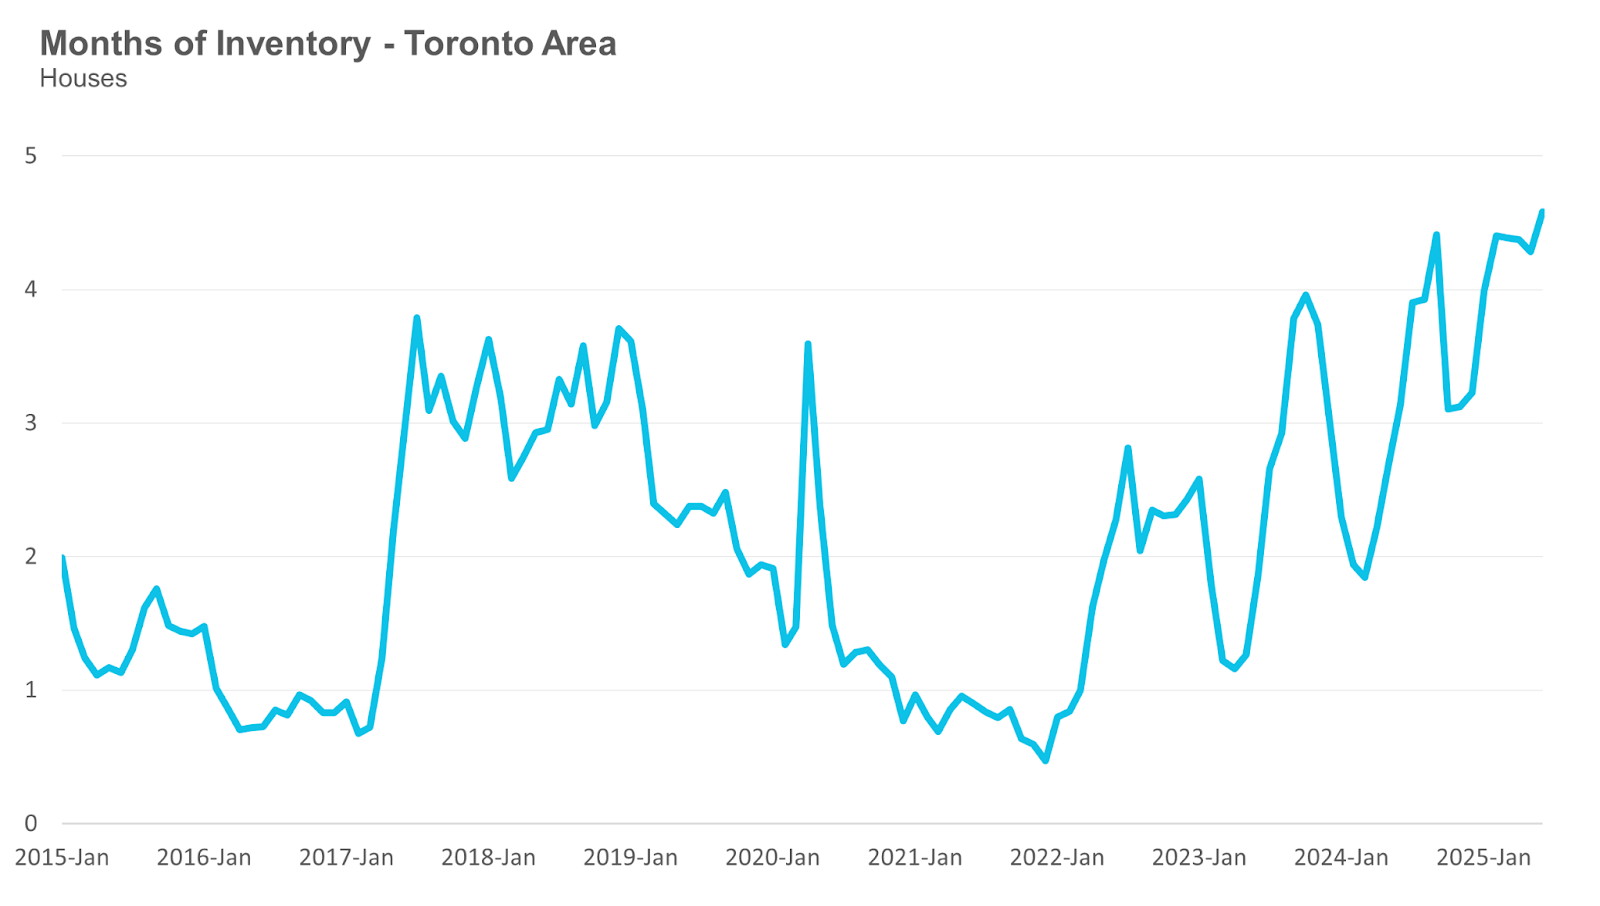
The current balance between supply and demand is reflected in the MOI, which measures inventory relative to the number of sales each month. In June, the MOI for houses was 4.6.
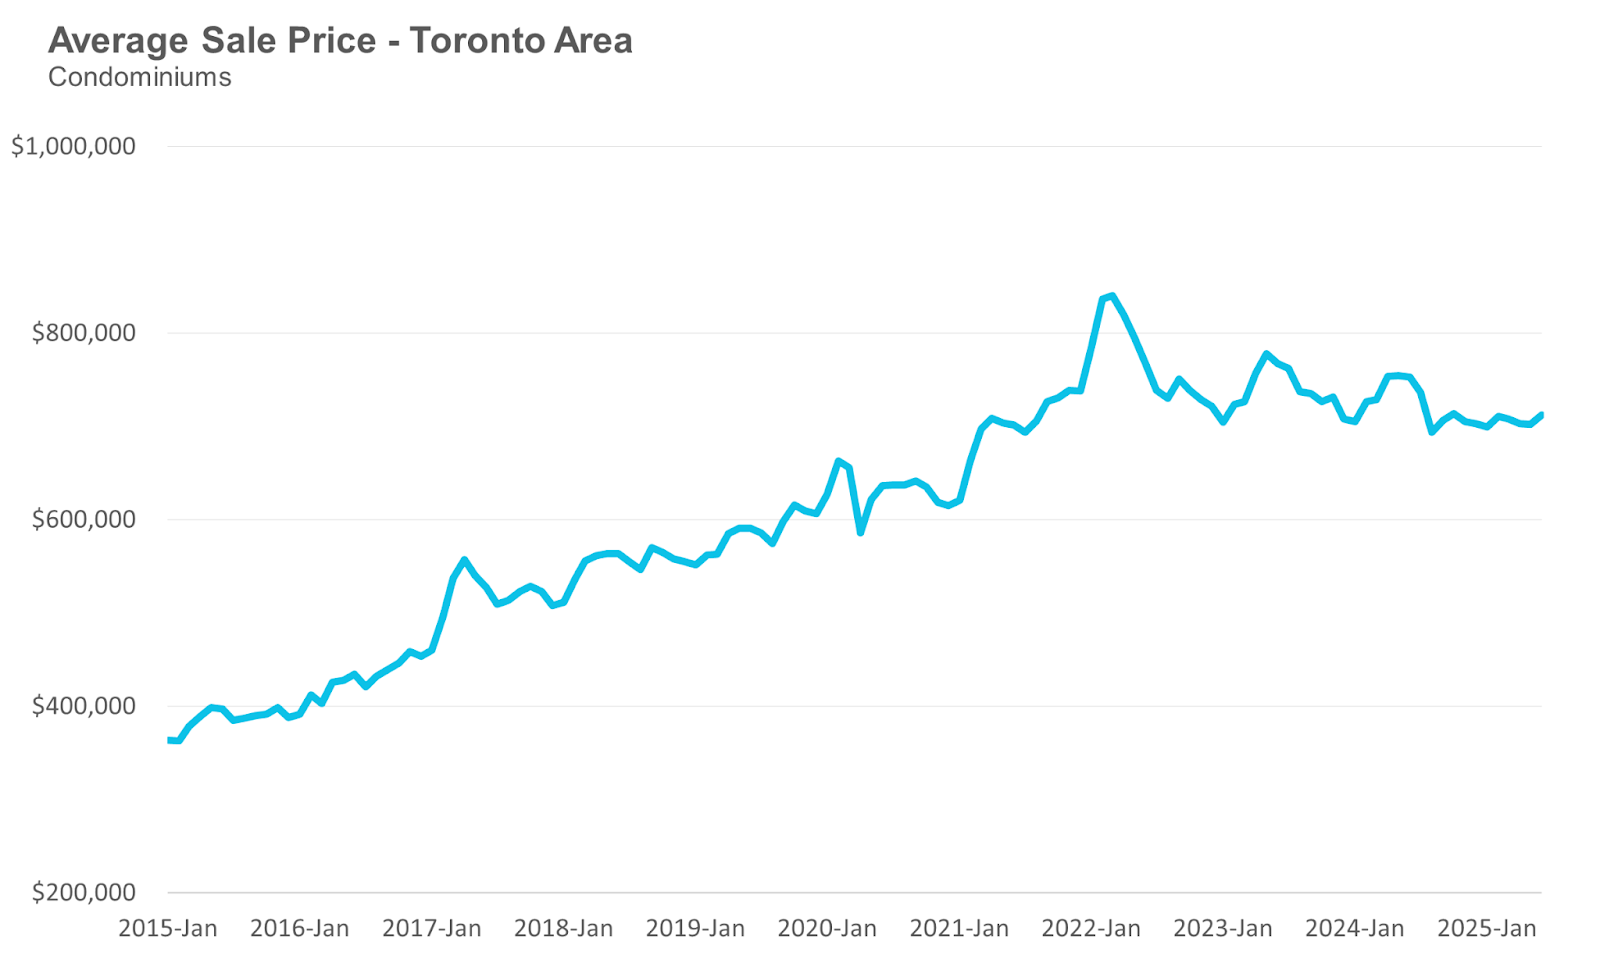
The average price for a condo in the Toronto Area was $712,548 in June, down 5% from the previous year. The median price for a condo in June was $630,000, down 6% from the previous year.
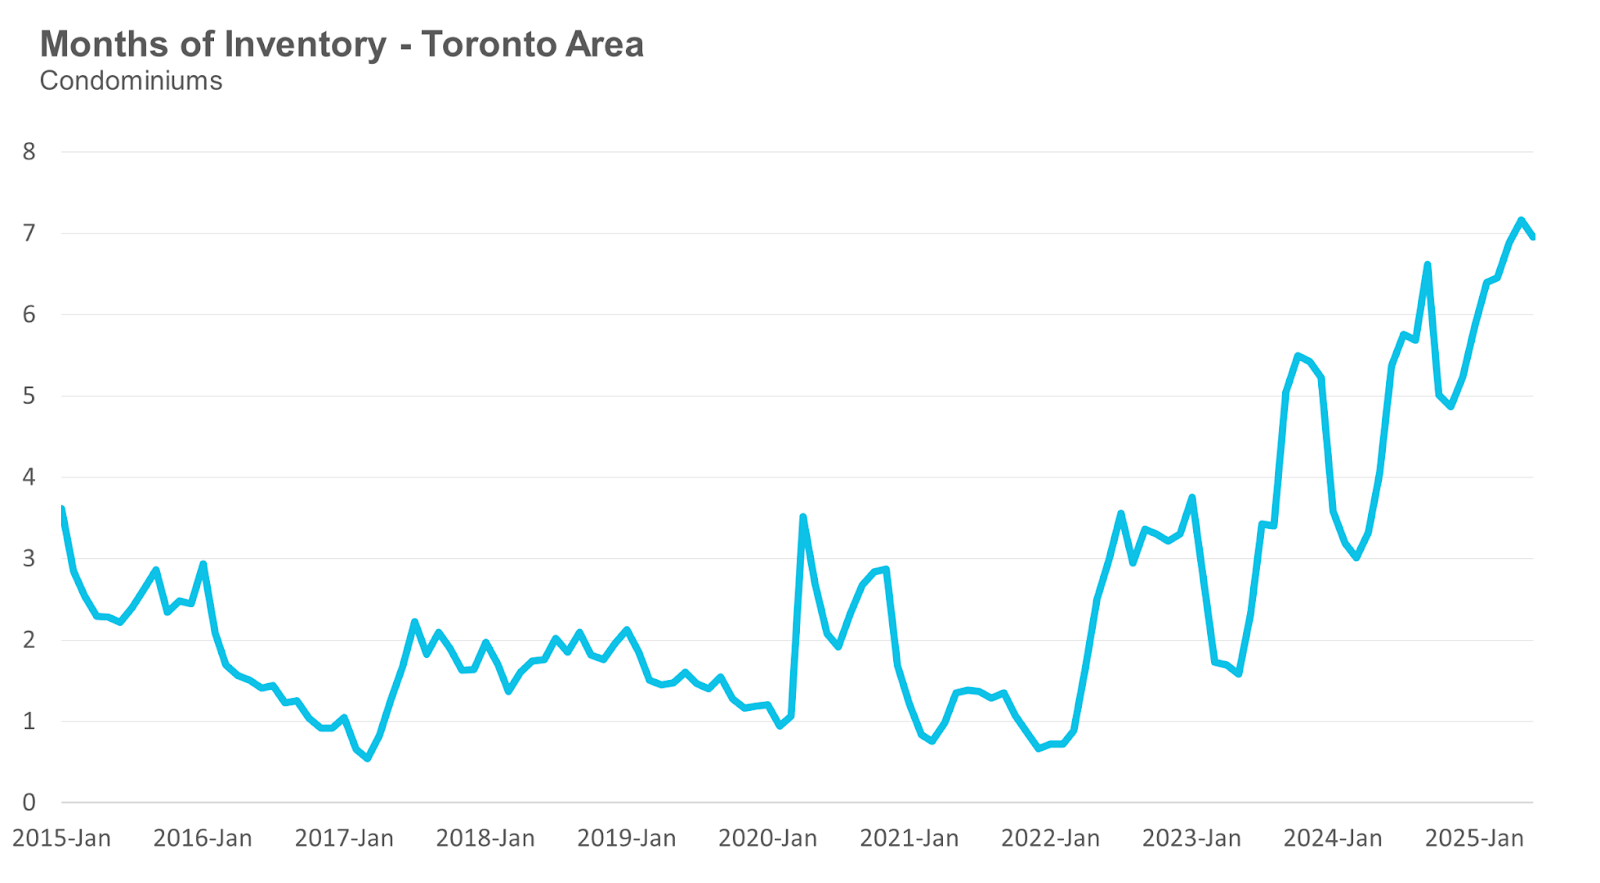
Condo sales in June were down 1% over last year, and new condo listings were up 3%. The number of active condo listings was up 29% from last year. The MOI decreased slightly to 7.
Browse detailed monthly statistics for June 2025 for the entire Toronto area market, including house, condo and regional breakdowns below.
Monthly Statistics
House Statistics
House sales (low-rise freehold detached, semi-detached, townhouse, etc.) in the Greater Toronto Area (GTA) in June 2025 were up 1% compared to the same month last year.
New house listings in June were up 15% compared to last year.
The number of houses available for sale (“active listings”) was up 48% in June compared to the same month last year.
The Months of Inventory ratio (MOI) looks at the number of homes available for sale in a given month divided by the number of homes sold in that month. It answers the following question: If no more homes came on the market for sale, how long would it take for all the existing homes on the market to sell, given the current level of demand? The higher the MOI, the cooler the market is. A balanced market (a market where prices are neither rising nor falling) is one where MOI is between four to six months. The lower the MOI, the more rapidly we would expect prices to rise.
While the current level of MOI gives us clues into how competitive the market is on-the-ground today, the direction it is moving in also gives us some clues into where the market June is heading.
The MOI for houses was up slightly at 4.6 in June.
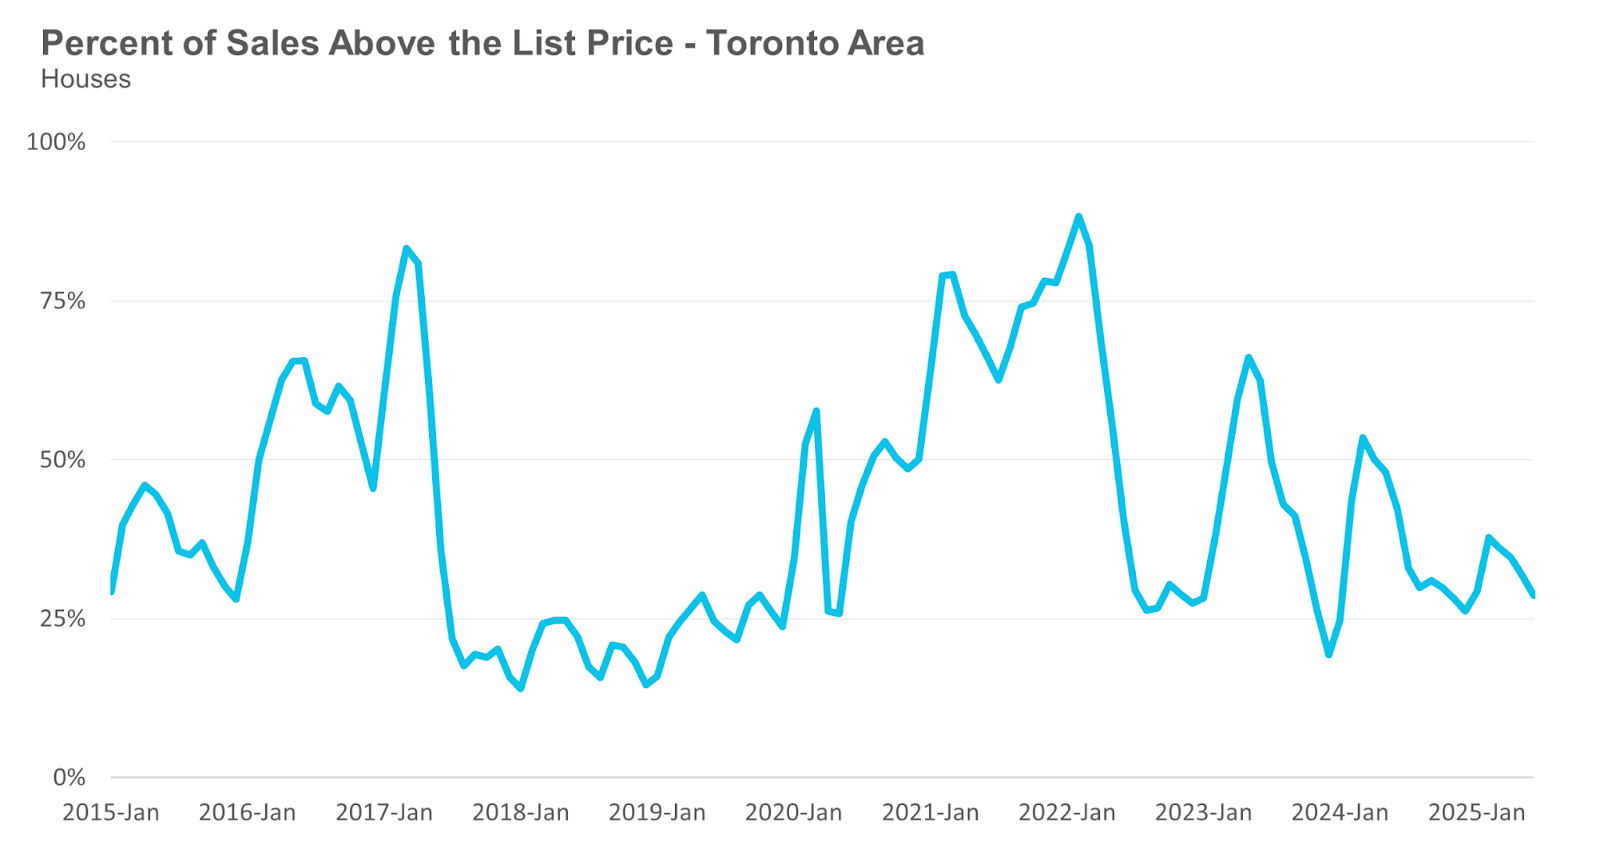
The share of houses selling for more than the owner’s list price decreased to 29% in June.
The average price for a house in June 2025, $1,303,089, was down 6% from the same month last year.
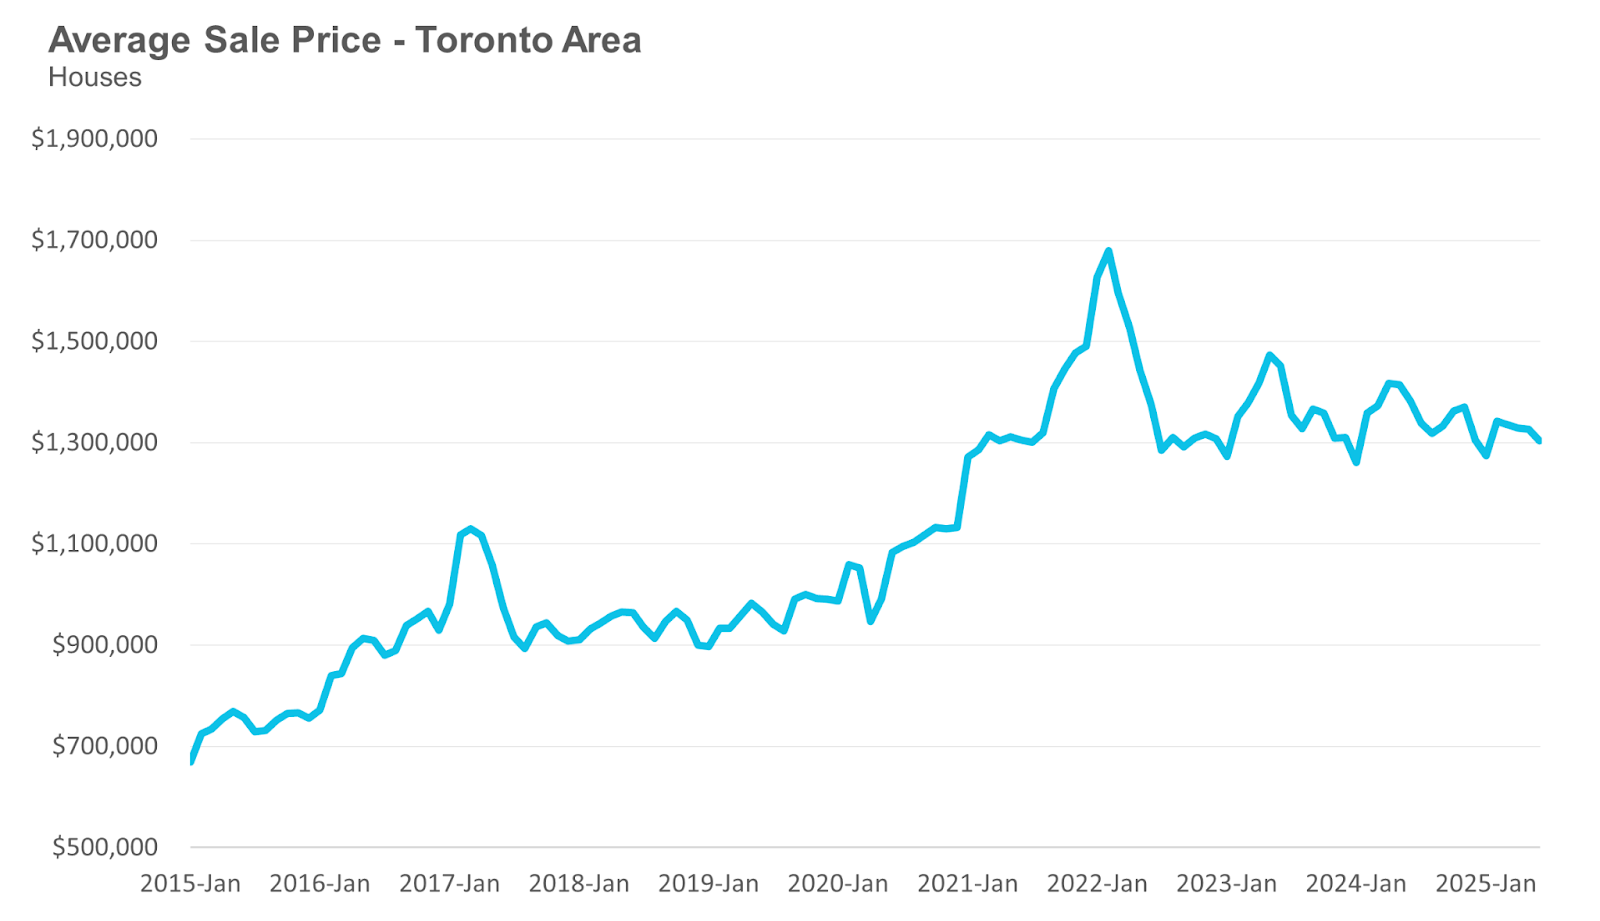
The median house price in June was $1,130,000, down 6% over last year.
The median is calculated by ordering all the sale prices in a given month and then selecting the price at the midpoint of that list such that half of all home sales are above that price and half are below that price. Economists often prefer the median price over the average because it is less sensitive to big increases in the sale of high-end or low-end homes in a given month, which can skew the average price.
Condo Statistics
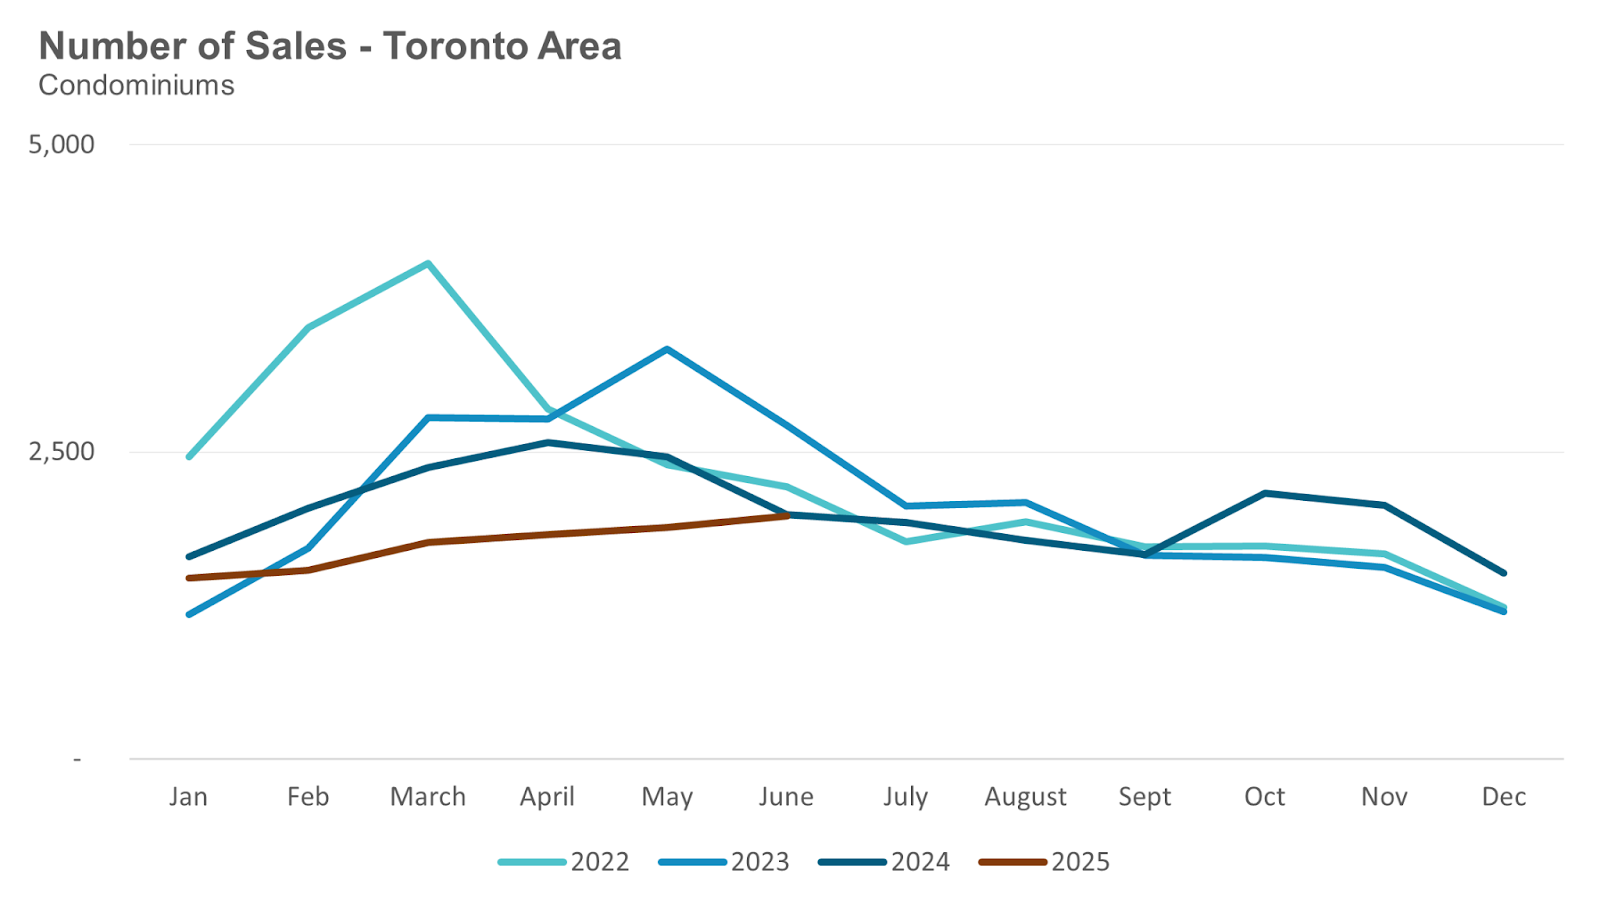
Condo (condominiums, including condo apartments, condo townhouses, etc.) sales in the Toronto area in June 2025 were down 1% compared to the same month last year and at their lowest level in twenty years, aside from the first months of the COVID lockdowns in 2020.
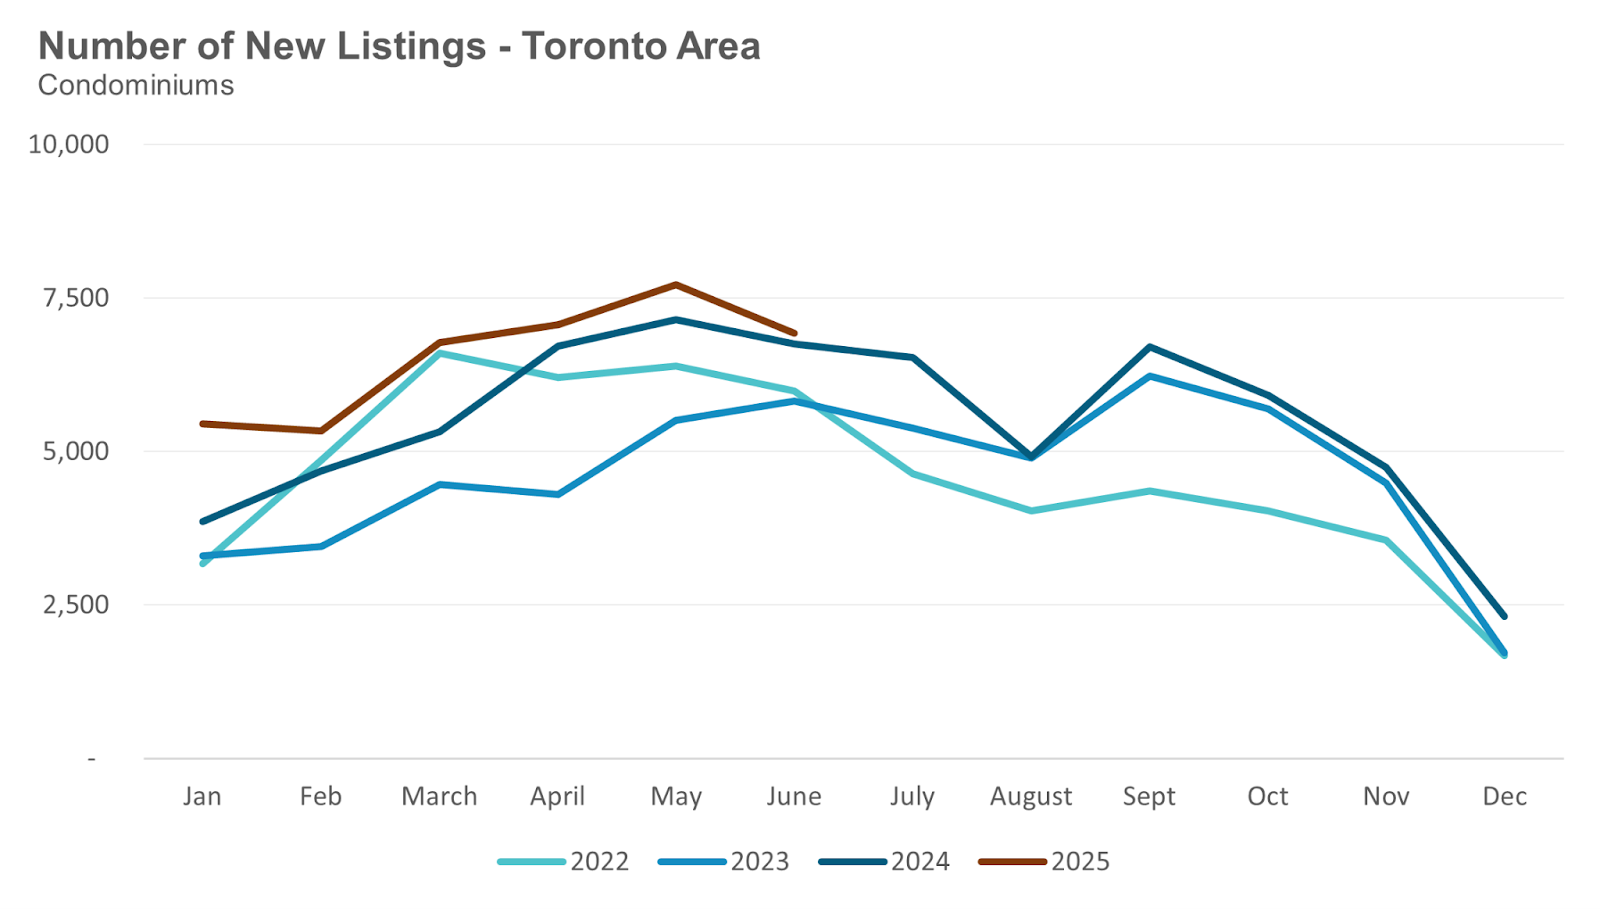
New condo listings were up 3% in June over last year.
The number of condos available for sale at the end of the month, or active listings, was up 29% over last year.
Condo months of inventory decreased to 7 MOI in June.
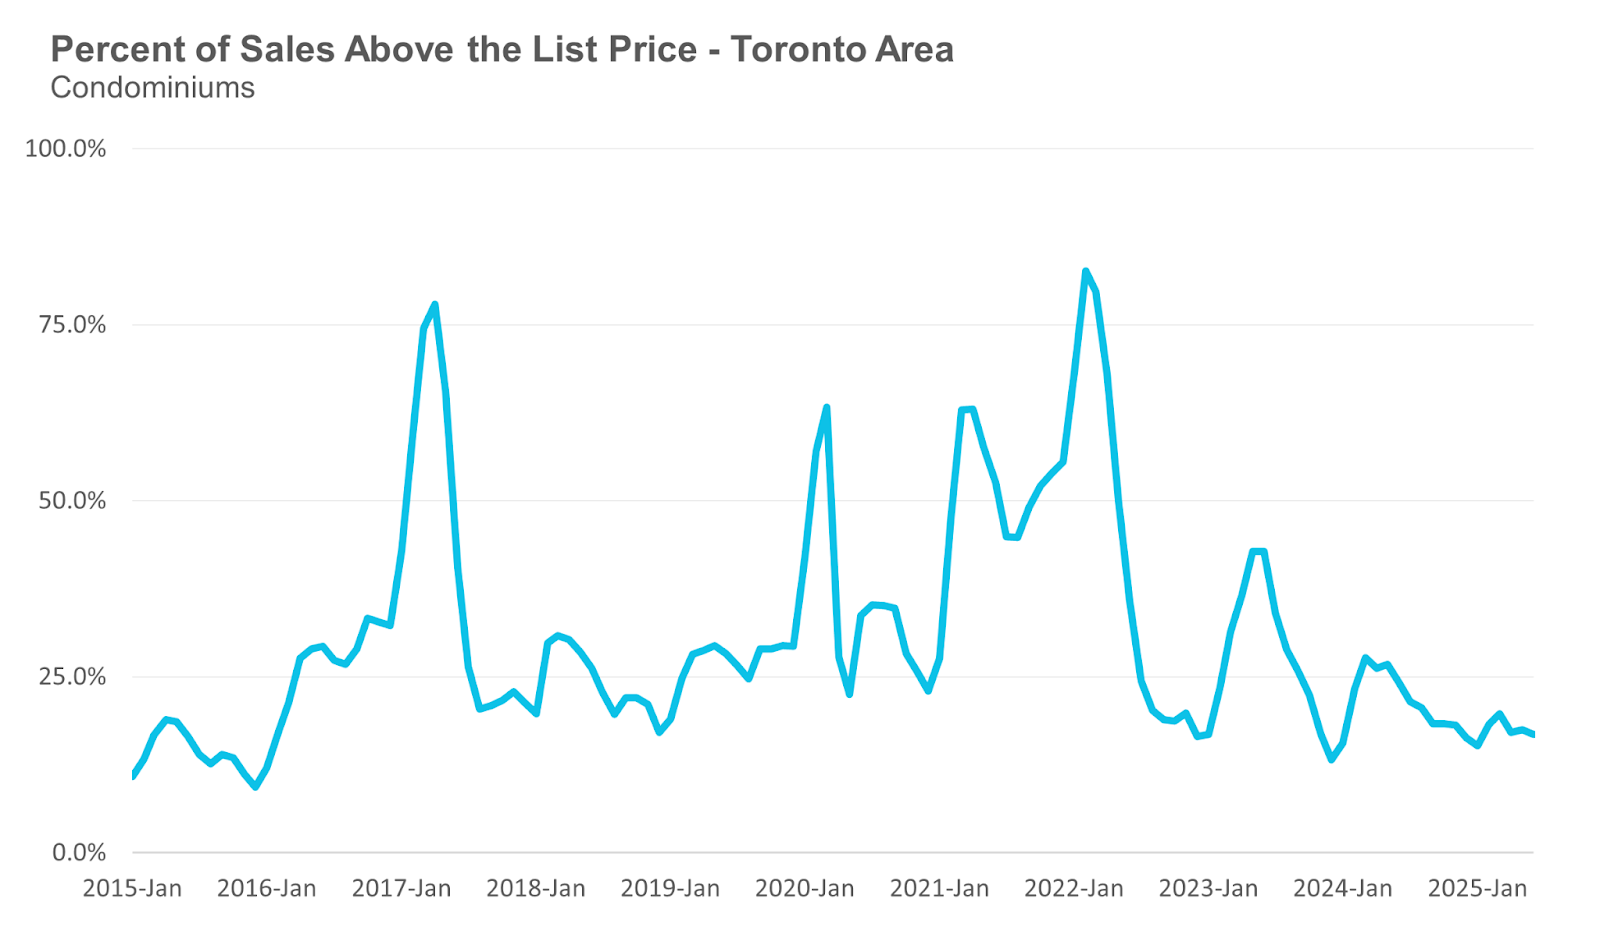
The share of condos selling for over the asking price decreased modestly to 17% in June.
The average price of a condo in June was $712,548, down 5% from last year. The median price was $630,000, down 6% from last year.
Browse Real-Time Market Trends on Movesmartly.com:
See Market Performance by Neighbourhood Map, All Toronto and the GTA
Greater Toronto Area Market Trends
John Pasalis is President of Realosophy Realty. A specialist in real estate data analysis, John’s research focuses on unlocking micro trends in the Greater Toronto Area real estate market. His research has been utilized by the Bank of Canada, the Canadian Mortgage and Housing Corporation (CMHC) and the International Monetary Fund (IMF).
Have questions about your own moves in the Toronto area as a buyer, seller, investor or renter? Book a no-obligation consult with John and his team at a Realosophy here: https://www.movesmartly.com/meetjohn
Published: July 09, 2025


