Lack of government data and competing explanations for Toronto’s skyrocketing real estate prices have resulted in uncertainty about whether the market is becoming unstable. Using an innovative method of measuring investor demand, Realosophy’s John Pasalis finds evidence of speculative activity across the region.

Download Document Icon.jpg
Download a PDF version of this guide.
Download Guide

1

A Different Kind of Buyer

When people are eager to buy homes as investments that lose money every month because "prices always go up", the market may be reaching a tipping point.

2

What the Data Says

Is there any quantitative evidence of speculation on the rise?


3

A Losing Investment

Investor demand could be strategic rather than speculative if single-family homes are a good investment - but they're not.

4

Key Takeaways

Our research reveals a number of trends in Toronto’s real estate market that consumers should be cautious about.

5

Advice for Buyers and Sellers

Many buyers worry that they might be buying at a peak of a speculative bubble – but they cannot put their lives on hold trying to time the market.

Get Toronto real estate reports. Tomorrow's headlines, today.

In 2015, I began to notice an interesting trend in the Greater Toronto Area (GTA) real estate market – more people, both domestic and foreign, were contacting our real estate brokerage to buy freehold houses (detached, semi-detached and rowhouse properties that are not condos) strictly for investment purposes. This was not too unusual, but what was unusual about these investors was their attitude and thoughts about the properties they were purchasing. 


Generally, real estate investors want to buy a property that can be rented out for enough money to cover all expenses including the monthly mortgage payment (“carrying costs”). But when speaking with these investors, we found that many of them were not particularly concerned about the rental income that the home could generate and in many cases were content with personally paying to cover the shortfall between the rent and the carrying costs. When we asked these investors why they would want an investment that loses money each month, they would respond by saying that they don’t mind losing $1K each month because if the house is increasing in value by 15%-25% per year, the appreciation in the property’s value will more than make up any shortfall in their rent when it comes time to sell.


So what's the problem? 


Many real estate investors we hear from either at our office or at dinner parties believe it’s completely rational to buy houses that lose money every month as investments – and given that house prices have been on the rise in Toronto for over 20 years, it’s not immediately obvious why this might be a problem.

When we began to see investors act on the assumption that the price of houses will continue to rise indefinitely, we start shifting from a market driven by an investor's mindset to a speculator’s mindset.

Leading economists such as Nobel prize winner Robert Shiller and Karl Case have noted that this shift in attitude is in itself a sign of a market moving into unstable territory. In 2010, Warren Buffett gave this explanation to the U.S. Financial Crisis Inquiry Commission (FCIC) about how a housing bubble develops:

So this sound premise that it’s a good idea to buy a house this year because it’s probably going to cost more next year and you’re going to want a home, and the fact that you can finance it gets distorted over time if housing prices are going up 10 percent a year and inflation is a couple percent a year. Soon the price action – or at some point the price action takes over, and you want to buy three houses and five houses and you want to buy it with nothing down and you want to agree to payments that you can’t make and all of that sort of thing, because it doesn’t make any difference: It’s going to be worth more next year.

For virtually all of the past 20 years that Toronto house prices have been on the rise, our market has been largely driven by buyers who need to buy a single family home for themselves and a smaller number of investors looking to buy and rent out properties that make them an income (or at least break even). Toronto largely avoided the speculative mood that plagued many U.S. cities during the boom that ended in the 2008 subprime mortgage implosion, but that doesn’t mean we’re immune to it. In fact, we may even suffer because of it – because property prices did not decline in the years before and after 2008 (except for a brief period in which consumer confidence fell in response to the U.S. crisis), in spite of experts warning that they would, many of us have begun to believe that Toronto is exceptional – we are the one city that disproves the economic rule that what goes up, must come down.

Just like our own mood changes, our collective mood changes can be unpredictable. A market can quickly shift from one rooted in real demand from buyers and investors to one pushed over the edge by a boost in demand from speculators. And when we start to hear from those eager to buy money losing investments because prices must always go up, it’s time to ask ourselves if we have reached that tipping point.

“Soon the price action – or at some point the price action takes over, and you want to buy three houses and five houses and you want to buy it with nothing down and you want to agree to payments that you can’t make and all of that sort of thing, because it doesn’t make any difference: It’s going to be worth more next year.”

- Warren Buffet


Competing Theories


Toronto’s real estate market is already at a critical point. Detached house prices are appreciating at a rate of over 30% year over year and if public policy makers want to introduce policies that cool our housing market, they need to act now.

But first, they need to diagnose the problem correctly. Rising house prices are merely a symptom of underlying problems – they do not reveal the cause of it. Understanding the cause is critical if government is to introduce a policy that actually works to cool our market safely by targeting unhealthy behaviours instead of all behaviours (or the wrong behaviours altogether). Misunderstanding the cause could instead result in a prescription that exacerbates problems.

It does not help that our market is full of commentators who always argue that the Toronto real estate market is on the verge of collapse. As there are many factors that affect supply and demand in real estate, these commentators move from one suspect factor to another (e.g., price to income ratio, price to rent ratio, etc.). It is not that these factors are unimportant, but more precision is needed to determine what factor at a particular point in time is causing a particular problem.

Conversely many in the real estate industry see perennially healthy markets. One long standing view, held by the Ontario Real Estate Association (OREA) and the Toronto Real Estate Board (TREB), is that the problem with Toronto’s housing market has nothing to do with ‘improper’ demand – high demand for houses is understandable because Toronto is a world-class city that many people, both Canadian and foreign, want to live in. Rising immigration and migration to the GTA explains why demand and prices continue to rise. The real problem, this theory suggests, is that our municipal and provincial governments are preventing builders from building enough homes (a “supply” problem). The solution is to allow builders to get their projects approved more quickly so we could build ourselves out of this problem. This argument is not entirely without merit – governments do impact supply, for example, by introducing policies to prevent housing sprawl and promote higher density housing (condos) over lower density housing (detached houses).

But the numbers for this theory don't add up.

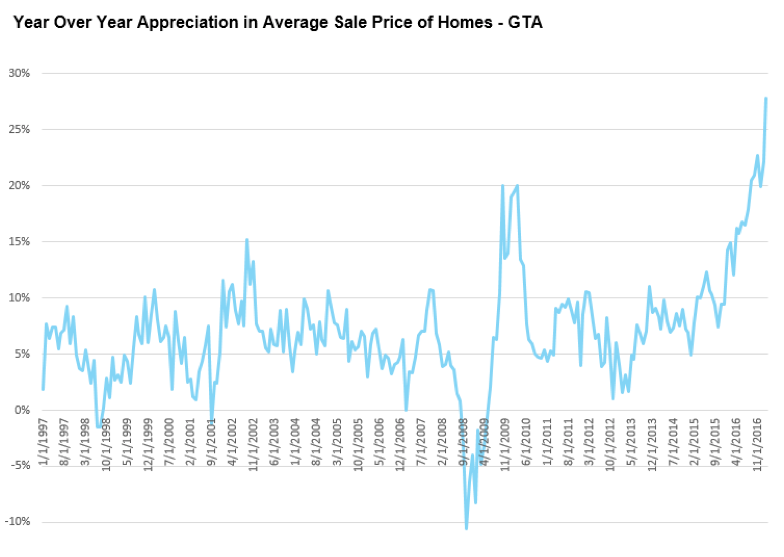
Toronto’s house price appreciation has seen an average growth rate of 7% annually over the last twenty years, with a rapid acceleration to the 20%-30% range last year. The only other time appreciation reached the 20% range in Toronto over the last 20 years was in late 2009, one year after the US crisis.

Part of Toronto’s 7% growth story is no doubt due to high demand from those looking to live in Toronto coupled with restricted housing supply.  But if immigration is responsible for the 20-30% increase in house prices we are seeing, we would expect the data to show this but Statistics Canada Census data shows that Toronto’s population only grew by 6.2% during the 2016 Census, down from 9.2% in 2011 and the slowest population growth rate over the past 40 years.  

Government policies restricting sprawl and promoting density (Ontario’s Places to Grow Act, was introduced in 2006, other initiatives date back further) have had some impact on house prices (such policies are intended to), but there have been no marked changes to those policies over the last few years which can explain skyrocketing appreciation rates from 2016 onwards.


If, as we have been hearing anecdotally, speculative investor demand is driving the rapid increase in house prices then government policies that curb this kind of demand would be the most effective and safe way to cool down the market.

The goal of this research was to see if there is any quantitative evidence that corroborates many of the observations we have made about the demand from these investors as well as their attitudes towards their investments.

Specifically, I wanted to answer two important questions:

1)      Is the GTA seeing a rise in the number of people buying single family homes strictly to rent them out?

2)      What percentage of those investors would be breaking even assuming they made a 35% down payment?


Determining the number of investors


In many areas of real estate, the government and the real estate industry are surprisingly poor at gathering, tracking and sharing data, though they should presumably be enacting policies in response to such data. For example, the impact of government policies on house building is hard to measure because the supply, use and development of land (mostly in the hands of private companies) is not well tracked. The impact of foreign investors in Toronto has been hard to measure because of lack of data on the precise immigration status of individuals buying properties.

However, real estate listing data which reflects the details of how properties are being bought and sold, such as the data contained in the Toronto Real Estate Board’s Multiple Listing Service (MLS) database, can tell us a lot about larger trends, if we look at it carefully.

For the purposes of my analysis, an investor is defined as someone who has bought a property that was listed on the MLS and subsequently listed it for lease on the MLS either in the same calendar year or in the first two months of the following calendar year.

To answer whether or not we are seeing an increase in the number of investors buying homes in the GTA, I first calculated how many freehold houses (detached, semi-detached and rowhouse) sold each year over the past 5 years through the MLS.

To calculate the number of homes purchased by investors each year, I checked all the homes that sold in a given year to see if the property that sold was also listed for rent (lease) on the MLS after the new owner took possession.

This is not to say that every single person renting their home after taking possession is an investor – I expect there to be a certain percentage of buyers each year who for various reasons cannot move into their home and have to rent it out. But I don’t expect the number of buyers who fit this description to fluctuate much from one year to the next.

One advantage to this methodology is that it provides quantitative evidence of homes that were purchased by investors strictly to be rented out. It also gives us some insight into the actual price investors are paying for their investments and how much they are actually earning in rent when they lease them.

The downside to this approach is that it understates the actual number of investors in the market because not all investors list their properties for rent on the MLS after they buy.

Specifically, there are four main types of investors that would not be captured in our analysis:

  1. a) Investors that decide to rent their properties themselves through third party websites rather than listing it on the MLS;
  2. b) Investors that decide to leave their home vacant;
  3. c) Owners who decide to hold on to their existing house as an investment property rather than selling it after they have moved to a new residence; and
  4. d) Homes that are left partially or infrequently occupied.


While this approach has its shortcomings by understating overall investor demand, it should offer some insight into investor behaviour.


What the data shows


There is a significant increase in investors across the GTA


In 2012, approximately 4% of all freehold houses that were sold on the MLS system were listed for lease shortly after the new owner took possession. 

In 2016, four years later, that percentage more than doubled to 10% with investors buying 5,705 out of the 58,3330 freehold houses.

When we look at how demand from investors has changed across the GTA by municipality we see a number of interesting localized trends.


Percent of Homes Purchased by Investors-2012-vs-2016


York Region


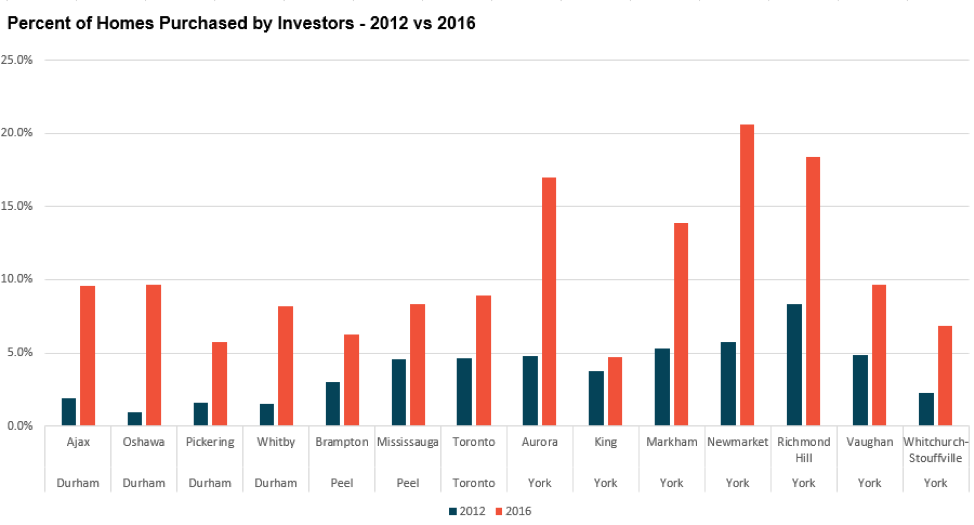
The top four in demand municipalities in the GTA were all in York Region. Newmarket topped the list where 20.6% of all homes sold were purchased by investors. Demand from investors increased by 260% from 2012 when investors made up 5.7% of all sales.


Picture1


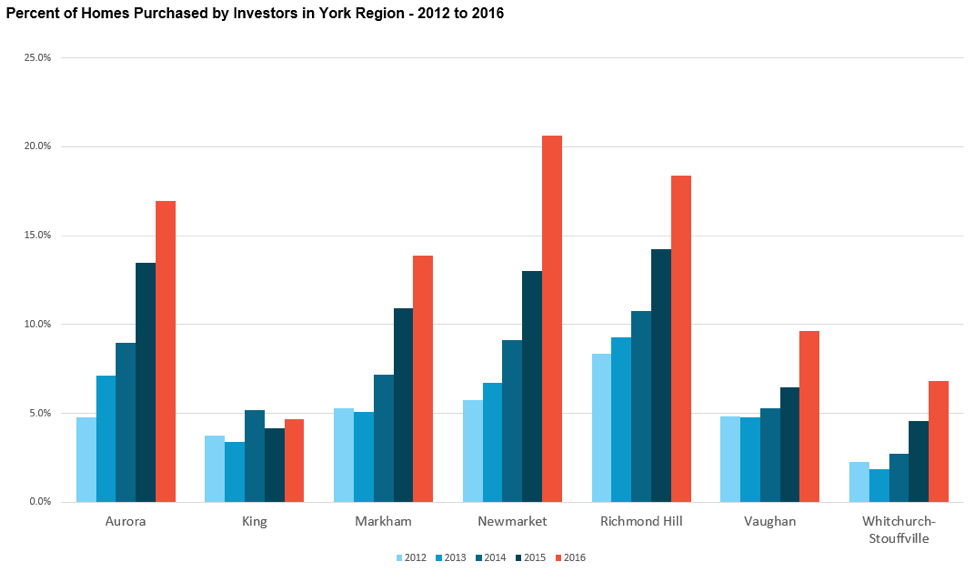
In 2012, Richmond Hill was the most sought after municipality in the GTA for investors where they accounted for 8.3% of all sales. Since then investor demand has continued to grow and is responsible for 18.4% of all sales in Richmond Hill.

Aurora saw sales to investors climb 255% from 4.8% in 2012 to 17% in 2016 while Markham saw investor demand climb from 5.3% to 13.9% in the same period.

Investors made up 9.6% of all transactions in Vaughan in 2016, an increase from 4.8% in 2012.  Whitchurch-Stouffville saw investors make up 6.8% of sales in 2016, an increase from 2.3% in 2012.

King saw the most modest demand from investors in 2016 where they made up just 4.7% of all sales, a 25% increase from 3.7% in 2012.

The table below shows the average sale price of homes that were purchased by investors in 2016, along with the average rent earned for those properties.


Average Price

Average Rent

Aurora

$937,625

$2,201

King

$1,186,909

$2,470

Markham

$1,137,166

$2,241

Newmarket

$784,268

$1,943

Richmond Hill

$1,183,763

$2,277

Vaughan

$1,001,616

$2,451

Whitchurch-Stouffville

$787,135

$1,967


Looking at sales at the neighbourhood level, we found that the two most attractive neighbourhoods for investors in York Region were Markham’s Bullock (McCowan Road & Hwy 407) where investors accounted for 39% of all transactions and Richmond Hill’s Crosby (Yonge St & Major Mackenzie Dr E) where investors purchased 36% of all homes in 2016.   

The average price of the homes purchased by investors in Bullock in 2016 was $1,160,229 while average rents were $1,870 per month.

The average price of the homes purchased by investors in Crosby in 2016 was $1,058,497 while average rents were $1,812 per month.


Durham Region


While the percentage of homes purchased by investors for the municipalities in Durham in 2016 was relatively average for the GTA, Durham is noteworthy because it has seen the most rapid increase in the demand from investors.


Picture2


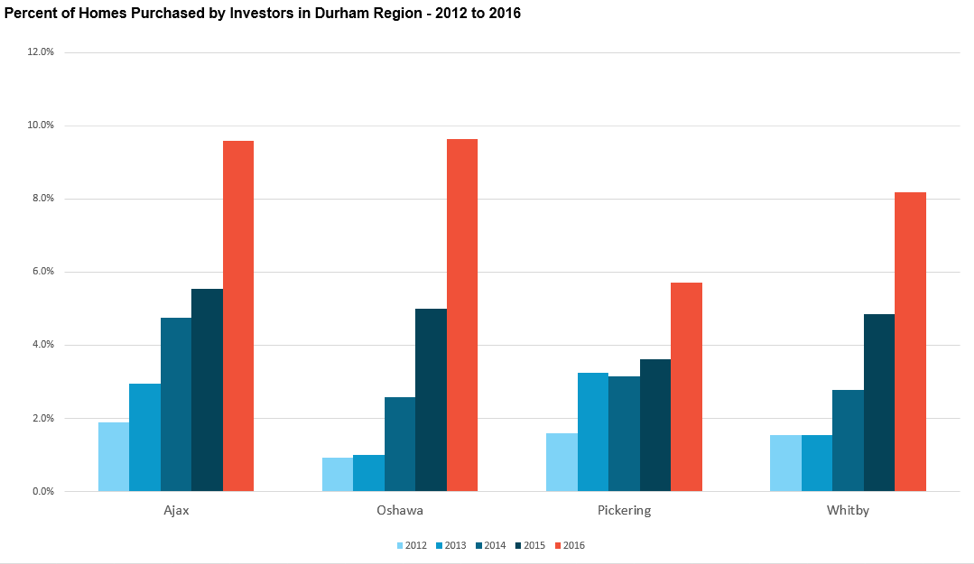
Oshawa in particular saw the biggest increase in demand from investors over the past four years. In 2012, less than 1% of properties were purchased by investors. By 2016, demand from investors increased by 944% with investors making up 9.6% of all purchases in 2016.

Investors made up fewer than 2% of transactions in Ajax and Whitby in 2012. Both municipalities saw demand increase by more than 400% as sales from investors made up 9.6% and 8.2% in Ajax and Whitby respectively in 2016.

Pickering saw the most gradual increase for the region, with sales to investors climbing from 1.6% in 2012 to 5.7% in 2016.

The table below shows the average sale price of the homes that were purchased by investors in 2016 along with the average rent earned for those properties.


Average Price

Average Rent

Ajax

$612,304

$1,928

Oshawa

$518,363

$1,797

Pickering

$653,364

$1,898

Whitby

$581,960

$1,892


Looking at demand from investors at the neighborhood level, we found the demand from investors strongest in Oshawa neighbourhoods Taunton (Wilson Rd N and Tauton Rd E) and Windfields (Simcoe St N and Conlin Rd) where investors drove 18% and 15% of sales respectively.

The average price for the homes purchased by investors in Taunton and Windfields were approximately $636,000 while average rents were approximately $2,000 per month.


Peel Region


Brampton and Mississauga were among the municipalities with the slowest rate of growth in demand from investors.


Picture3


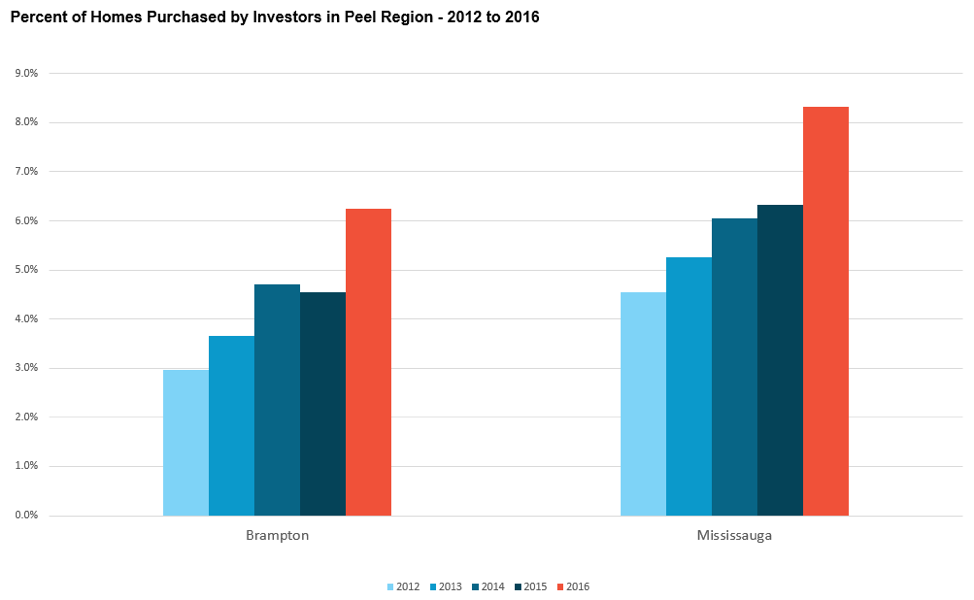
In 2012, investors accounted for 3% of sales in Brampton and 4.5% of sales in Mississauga; in 2016, this increased to 6.3% and 8.3% for Brampton and Mississauga respectively.

The table below shows the average sale price of the homes that were purchased by investors in 2016 along with the average rent earned for those properties.


Average Price

Average Rent

Brampton

$577,431

$1,820

Mississauga

$814,776

$2,278


The most popular neighbourhoods for investors in Peel were the Mississauga neighbourhoods of Fairview (Mavis Rd & Burnhamthorpe Rd W) and Central Erin Mills (Britannia Rd & Winston Churchill Blvd) where investors accounted for 16% and 15% of sales respectively.

The average price of the homes purchased by investors in Fairview in 2016 was $745,000 while average rents were $2,230 per month.

The average price of the homes purchased by investors in Central Erin Mills in 2016 was $1,003,000 while average rents were $2,653 per month.


Toronto 


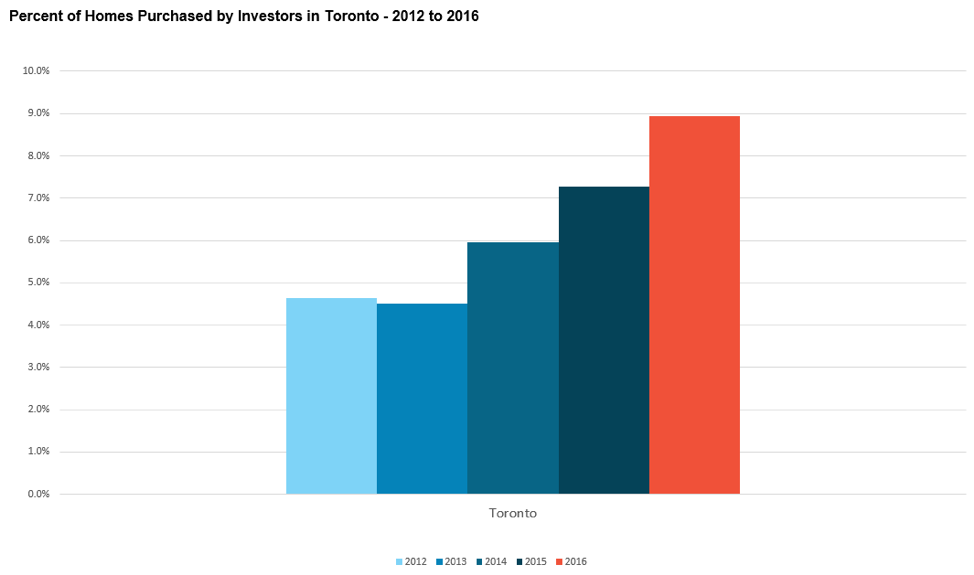
The City of Toronto saw demand from investors increase by 93% in the four years from 2012 to 2016. Investors accounted for 9% of all sales in Toronto in 2016.

Picture4


The table below shows the average sale price of the homes that were purchased by investors in 2016 along with the average rent earned for those properties.


Average Price

Average Rent

Toronto

$1,195,789

$2,777


The highest demand neighbourhoods from investors in Toronto were Henry Farm (Sheppard Ave E & Leslie St) and Lawrence Park North (Lawrence Ave E & Yonge St) where investors accounted for 22% and 20% of all sales respectively.

The average price of the homes purchased by investors in Henry Farm in 2016 was $1,505,500 while average rents were $3,015 per month.

The average price of the homes purchased by investors in Lawrence Park North in 2016 was $1,653,900 while average rents were $4,381 per month.

Are single family homes a good investment?

One of the main metrics investors use to measure the potential return on a real estate investment is something called the capitalization rate (cap rate for short). To calculate the cap rate, investors first estimate the net income of the rental property by adding up the estimated rents for the entire year then subtracting all expenses (excluding mortgage payments). Once they have the net income for the property, they divide it by the estimated purchase price to get the cap rate.

As an example, suppose I bought a $500,000 home as an investment and I estimate that I’ll be able to collect $2,000 in rent each month and the annual expenses for the home are approximately $4,000.

My net income for the home would be $20,000 ($24,000 in rent minus $4,000 in expenses).

This would leave me with a cap rate of 4% ($20,000 net income / $500,000 purchase price).

Real estate investors would generally be satisfied with a cap rate in the 4%-6% range for a residential property.

Single family homes have never been popular investments in Toronto because the cap rates are quite low making them less attractive when compared to other investments.

Below is a chart showing the average cap rate for all the properties purchased by investors between 2012 and 2016.

 Image7


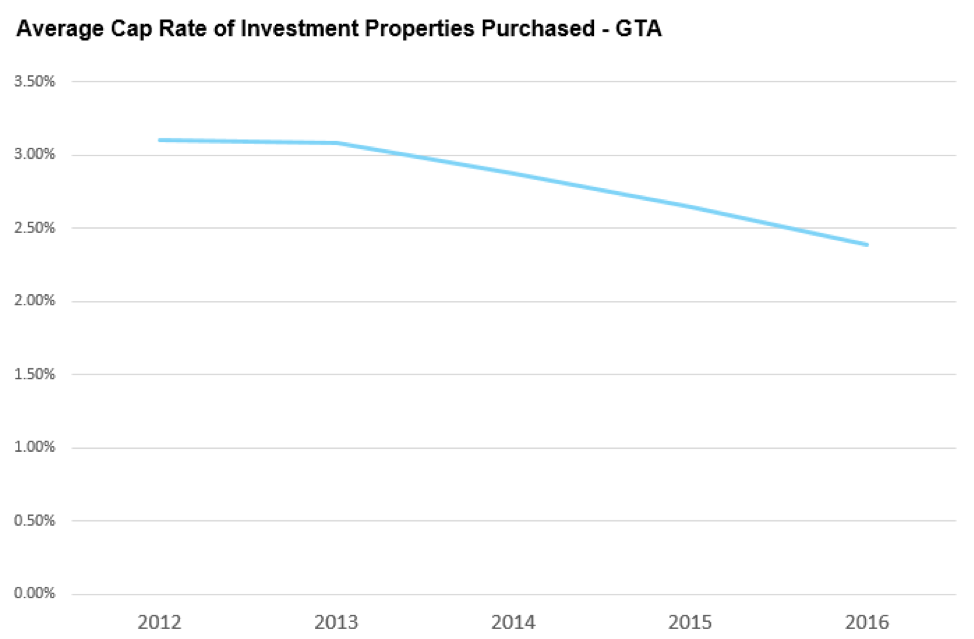
The cap rate for the single family homes purchased by the investors in this study has declined from 3.1% in 2012 to 2.38% in 2016. The primary reason for the decline in the cap rate for single family homes has to do with the fact that home prices have grown at a much faster rate than rents.

The chart below shows the percentage increase in the average price of the homes purchased by investors from 2012 to 2016 against the average price of the rent they generated during the same period.


Image8

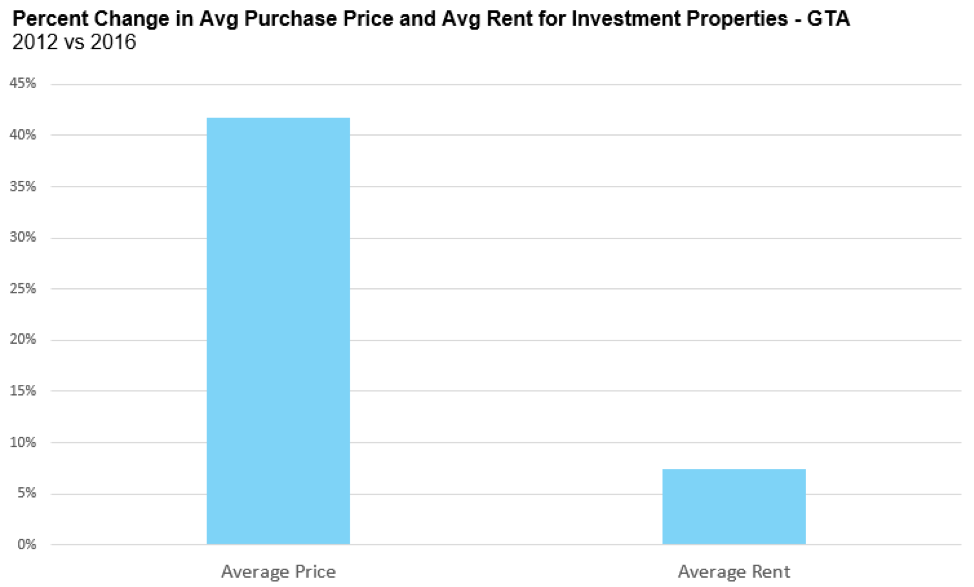
The average price of the homes purchased by investors was $669,564 in 2012 and increased by 47% to $949,175 in 2016. The average rent generated on these homes was $2,124 in 2012 and climbed just 7% to $2,283 in 2016.


Are These Investments Cashflow Positive?

Another principle concern when real estate investors are considering buying a property is whether or not the rental income from the investment can cover all expenses along with the mortgage. Investors generally don’t want to be losing money each month when they buy investment properties.

Determining cashflow

To estimate the percentage of investment properties breaking even each month, I was able to rely on information in the MLS including the price the investor paid for their property, their annual property taxes and how much they leased the house for.

The table below highlights the source of the data for my income and expense calculations along with several assumptions.


Rent

Actual rent for leased properties on the MLS

Property Taxes

Actual property tax amount advertised on the MLS when the investor bought the house

Insurance and Maintenance

Estimated at a fixed $160 per month

Utilities

No utility expenses were included for the landlord

Vacancy

Assumed the properties were fully rented 365 days out of the year


The mortgage payment was calculated based on the actual sale price of each home and I assumed a 35% down payment and an interest rate of 2.8% and a 25 year amortization.      


What the Data Says


Most are Losing Money

Using the methodology described above, I was able to estimate what percentage of properties were cash flow positive vs negative each month.

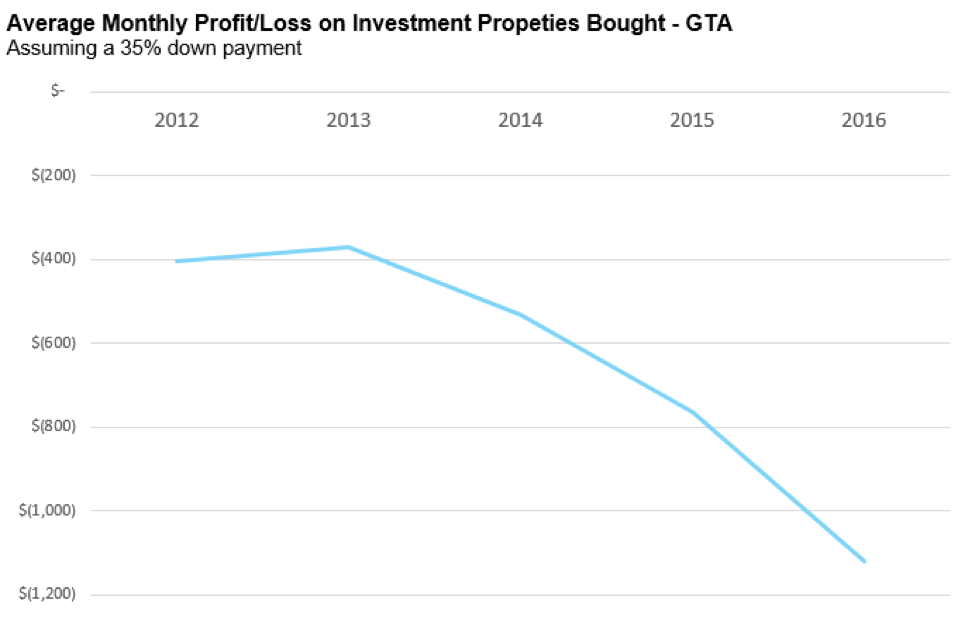
When taking into account the actual purchase price of each home, the amount it was leased for and the estimated expenses, 95% of the investment properties purchased in 2016 would be losing money every month. This means that 95% of the owners who bought investment properties would personally have to contribute to the carrying costs of the property because the rent alone is not sufficient to cover the expenses of the home. The average monthly loss per property in 2016 was $1,121.

In 2012, 68% of all the investment properties were losing money each month with the average loss coming in at $406.28.

The chart below shows how the average monthly loss on the investment properties purchased has changed over the past five years.


Image9


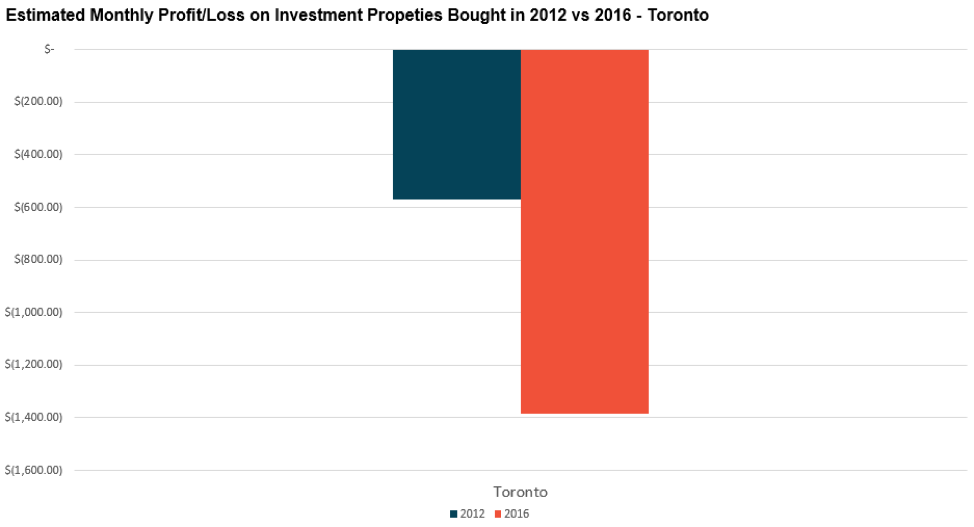
The chart below shows the average monthly loss for the investment properties purchased in 2016.


Image10


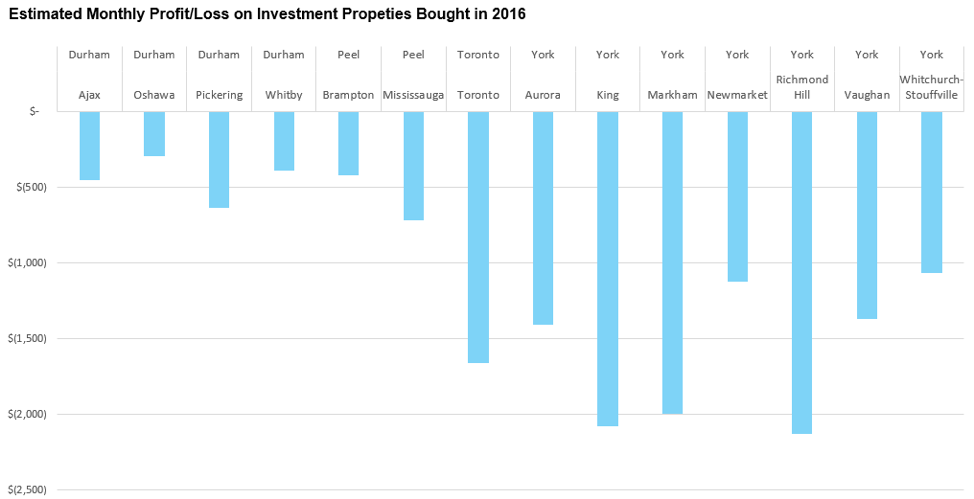
It is important to note that the estimated average monthly losses for these investments assumes that investors are making a down payment of 35% of the purchase price. While this is a reasonable assumption in terms of how most buyers finance an investment property, I recognize that not all buyers will fit this assumption.

Specifically, we have heard anecdotal accounts that many foreign investors are purchasing properties with more equity than I have assumed in our example. This means that the losses for these investors may not be as significant as described above.

On the other hand, domestic investors are likely purchasing investment properties with less equity that I have assumed. Anecdotal accounts suggest that most domestic investors are borrowing against the equity of their principal residence to come up with the down payment for their investment properties.

Even with the assumption that domestic investors are making a 35% down payment when buying an investment property – this means that in many cases their investment properties are effectively being financed entirely by debt – 65% though a mortgage on the investment property and 35% borrowed against the investor’s principal residence.


York Region

The chart below shows how the monthly profit and/or loss from these investment properties has changed over time in York Region.


Image11


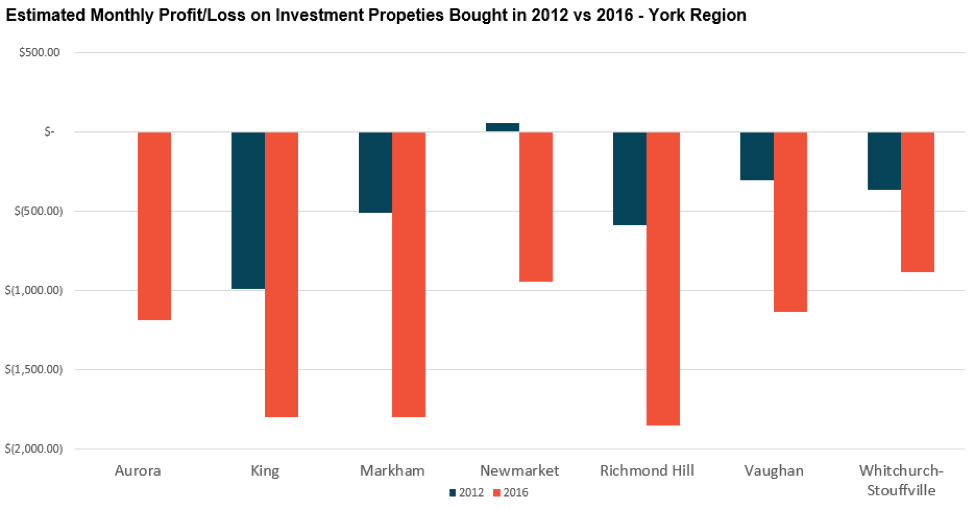
In 2012, investments in Aurora were on average breaking even while investments in Newmarket were making a slight profit. Markham and Richmond Hill both saw monthly losses in the $500 per month range.

By 2016, all municipalities on average were running at a monthly loss on their investments with King, Markham and Richmond Hill seeing the biggest losses.


Durham Region

In 2012, three out of the four municipalities in Durham region had an average monthly profit on the real estate investments purchased that year.
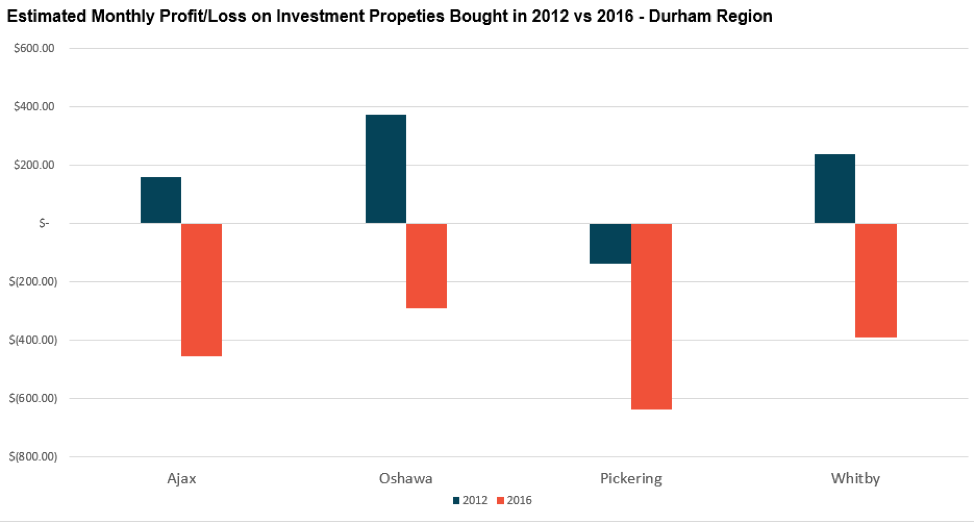
 

Image12


Oshawa, Whitby and Ajax showed the highest monthly profit on investments in 2012 out of all GTA municipalities. This profitability attracted investors and explains why Oshawa, Whitby and Ajax saw the most rapid growth in the percentage of homes purchased by investors between 2012 and 2016.

Rising house prices have wiped out all average profits for investment properties in 2016 for each of the municipalities.


Peel Region

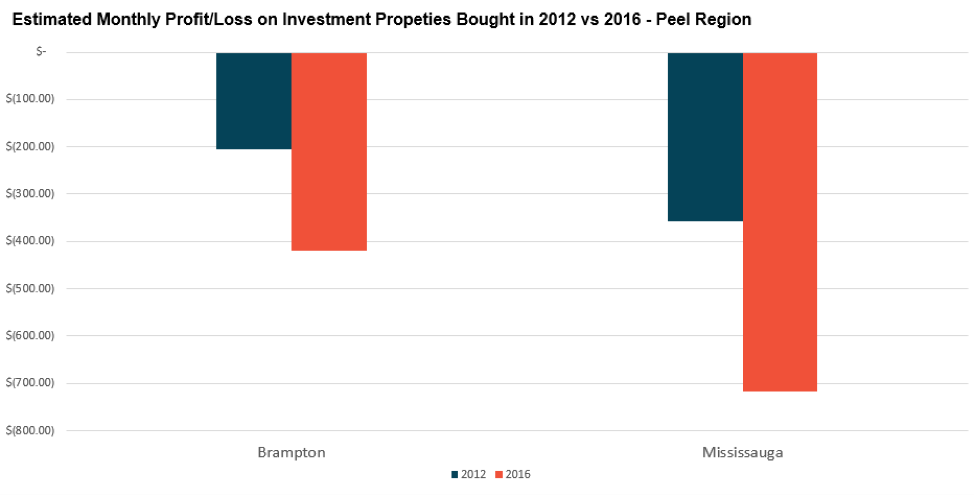
Brampton and Mississauga both saw their average monthly loss on investment properties double in the four years from 2012 to 2016.  

The average monthly loss in Brampton increased from $205 in 2012 to $418 in 2016.  The average monthly loss in Mississauga increased from $358 in 2012 to $718 in 2016.


Image13


Toronto

Toronto saw the average monthly loss on investment properties increase from $571 per month in 2012 to $1,384 in 2016.


Image14


This research reveals a number of interesting trends in Toronto’s real estate market, some of which we should be cautious about.

Firstly, the subset of investors I analyzed (investors who buy freehold homes and list them for rent on the MLS) are responsible for between 17-21% of all sales in Aurora, Newmarket and Richmond Hill and as much as 36-39% of all sales in some of the GTA’s hottest neighbourhoods.

Furthermore, Whitby, Ajax and Oshawa all saw the steepest increase in investor demand as sales to investors increased by over 400% in just 4 years.

Finally, 95% of all investment properties purchased in 2016 – provided they were purchased with a 35% down payment or less – are losing money every single month.

This research only focused on a subset of investors in the GTA’s real estate market and yet it still accounted for 10% of all sales in the GTA.

I estimate that we could expect to see investor demand responsible for as much as 25%-30% of all home sales in the Greater Toronto Area if we accounted for all types of investors including the following:

a) Investors that decide to rent their properties themselves through third party websites rather than listing it on the MLS;


b) Investors that decide to leave their home vacant;


c) Owners who decide to hold on to their existing house as an investment property rather than selling it after they have moved to a new residence;


d) Homes that are partially or infrequently occupied; and


e) All types of condo investors.


Understanding today’s speculator

If the cap rates on single family homes are decreasing and investors are losing more money each month just to hold on to these investments – why is the demand for them on the rise rather declining?

To answer this question, we need to turn to the original observations that prompted this analysis – the assumption on the part of some investors that house values will keep going up 20% per year.

What’s particularly interesting about the mood of many of these investors is that while their properties are likely losing money every month, they see them as the closest thing to a guaranteed secure investment.

They see no end in sight to the rise in house prices we have been seeing over the past 20 years and are banking on it continuing to increase at the same rate.

What is also particularly interesting is how investors rationalize their decisions. Many of the investors we hear from don’t approach these decisions with a gambler's excitement. They don’t sound like greedy speculators looking to make a quick buck.

These investors believe that what they are doing is just common sense and that there is nothing really speculative or odd about buying a single family home that is losing money each month.

As an example, suppose we’re talking to an average investor who is considering spending $800,000 on a single family home as a rental investment knowing that he will have to pay roughly $1,200 per month to cover the expenses that can’t be covered by the rent alone.

The investor’s first step in rationalizing this investment is by stating that they are not in fact losing $1,200 per month. They assume that the shortfall is to cover the mortgage expenses specifically – rather than the other costs, and because it’s covering the mortgage, roughly half of their mortgage payment is going to pay down their principal. So out of the $1,200, they are losing every month, $600 is actually going back to them in the form of their principal repayment (building the equity they have in that house) which means they are really only losing $600 per month.


The investor then states that even if their house doesn’t appreciate 20% per year the way it has been, and it only goes up 10% per year, then losing $600 per month is a small price to pay if your investment is appreciating by $80,000 per year – or roughly $6,600 per month.

It almost seems irrational not give up $600 per month of your own money for the virtual guarantee of making $6,600 per month as your safe and secure investment appreciates.

This speculative mood and rationalizing of buying investment properties that in many cases people can’t really afford is so compelling that on more than one occasion I have overhead potential investors rationalize paying the expected shortfall in the carrying costs of an investment property through cash advances on their credit card. In each case, the investor’s rationale was the same – who cares if they have to pay 25% interest on the $1,200 they need to borrow each month if they’re earning 25% on the $800,000 purchase price of their home?


What if you are buying or selling a home today?


Invest don’t speculate

As someone who grew up in a family of real estate investors and who personally owns investment properties – I fully support people who want to buy their own investment property.  But the key here is that you need to be thinking and acting like an investor – not a speculator. 

Investors do not bank on short term gains in house prices to make a quick profit. Investors don’t buy rental properties that they have to personally finance out of pocket because the rental income can’t cover their expenses. These kinds of investments are in fact speculations which leave such investors in a more precarious position than their rationalizations allow for.

Given the increase in supply of single family home rentals, if demand for single family home rentals declines and it takes many months to rent a property – monthly carrying costs (and losses) only increase and become more difficult to manage.

In the event of a slow down in the real estate market or the wider economy (real estate slowdowns are usually accompanied by a recession), in which you find your job or income impacted, you’ll find it hard enough keeping up with your principal mortgage and personal expenses, let alone a money losing income property.  

The better strategy is to think and act like an investor. That means being honest about the downside risks of your investment and asking yourself how you will cover them.

We have been advising many of the investors who come to our brokerage originally seeking a single family home to instead focus on multi-unit properties. In the GTA, investing in properties with at least two to three units is necessary to earn enough rent to cover all monthly expenses and to limit vacancies. These kind of investments also retain the benefit of capital appreciation as home prices appreciate.


Be defensive

Many buyers worry about buying at a peak just before a decline – but experts cannot pinpoint real estate markets that precisely. Home price appreciation can slow down gradually this year if governments introduce policies to cool the market or if the government doesn’t act or demand is still strong regardless, prices could also continue to appreciate at the same rate for another two years, widening the price gap.

Many buyers cannot put their life on hold trying to time the housing market – changes in relationship and family status including leaving home for the first time, getting engaged or having kids are often key drivers.

Instead of trying to time the market, we advise that buyers always buy defensively to enable them to withstand house price downturns in the market while advancing their position on the real estate property ladder over the long run.

Read Realosophy Defensive Home Buying Guide


Get the right data

While we don’t recommend trying to time the market – it’s important to have the right data and information in your hands when you are making real estate decisions like how supply and demand for homes and prices are changing in a particular neighbourhood.

Neighbourhoods with higher rates of speculation may be more vulnerable to a decline in prices should the market begin to cool. If there is a high rate of speculation in your neighbourhood, and the market as a whole appears to begin to cool down, you may want to consider selling earlier than you originally planned.

Likewise, defensive buyers should avoid buying in the neighbourhoods that are showing the highest rate of speculation.

Learn more about how Realosophy uses data to advise buyers and sellers

Need more advice?

Get the right answers to your questions with a no-obligation consultation

Realosophy Realty Inc. Brokerage - Serving Toronto and the Greater Toronto Area

Advice for policy makers

When speculators begin to impact a city’s real estate market, one of two things can happen.

Prices can continue to rise at a rapid rate as more and more investors jump into the market, making rapid price appreciation a self-fulfilling prophecy. This cycle can continue for a year or three or more, but eventually it stops when prices get so detached from fundamentals that the only place they can go is down. This usually results in a significant decline in house prices and almost always a wider economic recession. 

The other option is for all levels of government to step in and introduce coordinated policies aimed at protecting the real estate market and economy in light of the speculative activity we are seeing today.


Investments should be financed like investments

There is a loophole in today’s financing policies that allows investors to buy money losing investment properties entirely with debt. 

Today, anyone buying a single family home as an investment can borrow the entire down payment from the equity in their existing home and can buy a money-losing investment provided that their income can cover the expenses. This means that investment properties are underwritten with the same rules as an owner occupied property or principal residence. 

This is very different from how banks finance small multi-unit residential properties and small commercial properties. With these kind of properties, lenders want to ensure that the net income on the property can more than cover the monthly mortgage payments. Specifically, lenders like to see that the net income of the property is at least 20-25% more than the mortgage payment.  The additional 20% acts as a buffer in case the property is vacant longer than expected or if unexpected expenses arise. As an example, if the mortgage payment is $1,000 per month the property should be earning at least $1,200 per month in net income. This ratio is commonly referred to as the debt coverage ratio.

The problem with underwriting investment properties the same way our principal residences are underwritten is that such policies assume that the risk associated with buying two to three investment properties is the same as buying a principal residence. Lenders are not pricing in the risk associated with these types of investments – and investments that lose money every month in particular. 

In my analysis, the average debt coverage ratio for the freehold homes bought as investments in 2016 was 66%. This means that the average net income of each property covered just 66% of the mortgage payment – which explains why the properties were losing money every month. 

In order for these properties to not only break even, but also have a debt coverage ratio of at least 20%, buyers would have needed a down payment of approximately 65% of the value of the home. 

As an example, the average sale price of the investment properties purchased in this analysis was $949,175. At that price, an investor could buy an average investment property with just a 20% down payment – or $189,835 – provided their personal income could support the property.  If lenders require that the property has a debt coverage ratio of at least 20%, an investor would need a down payment of 65% or $616,964 to buy the same property.

While such a policy would not prevent homeowners from borrowing against their own home to finance their investment properties, it would make it significantly harder for them to buy an investment property.

Firstly, investors would need more equity either in cash or through the equity in their home to even qualify to buy an investment property. There are significantly fewer people that can take $600K out of their home equity than those that can take $200K out of their home equity.

Secondly, for buyers who are financing their investment property down payment through the equity in their home, a bigger down payment may act as a psychological barrier preventing these risky investments. For most people, it’s fine to take out a small mortgage on your home to buy an investment property that has a relatively large mortgage. This leaves the investor with the feeling that their principal home is secure and the investment property with the bigger outstanding mortgage is the riskier bet. If home owners instead have to take out a much larger mortgage on their own home to fund their investment property, they are more likely to think carefully about what they are doing.


Speculation tax

Speculation taxes are an additional tax applied to properties that have been owned for a relatively short period of time – typically less than one to two years. Speculation taxes are designed to discourage people from taking advantage of short term gains in house prices by flipping properties shortly after they’ve been purchased.

But my preliminary research suggests that a traditional speculation tax that only targets investors who have owned their properties for less than one to two years would have less of an impact on our market because relatively few speculators fit this definition today.

My research suggests that speculators in the GTA are more likely to hold onto their properties for between three to four years. I suspect that this is the case because up until 2016, house prices in the GTA were only appreciating at a rate of under 10% per year. Given the relatively high transaction costs of buying and selling a home, investors would generally want to see their property’s value appreciate by 30-40% in order to realize a decent profit after taking into account the transaction costs.

Any speculation tax should target investors who are selling their non owner occupied property within four years of buying it.

As home prices continue to appreciate by 25%-30%, I suspect that the number of investors buying and flipping after just a year or two will also grow significantly.


Foreign buyer tax and ownership

A single family home is the new gold. Just as investors historically turned to purchasing gold as a safe haven when there was uncertainty, foreign investors are opting to park their cash in single family homes in the world’s most attractive cities – like Toronto. 

While this behaviour is understandable, this injection of foreign capital inflates house prices higher than local factors like income and population growth would, at the expense of longer-term residents who live, work, pay taxes and build the cities being bought into. Ironically, growing economic inequality may undermine the very social stability that all buyers, domestic and foreign, value in Toronto.

As a first step, Ontario should introduce a tax on foreign buyers similar to the one implemented in Vancouver by the British Columbia (BC) government, but with improvements.


In August 2016, BC introduced a 15% tax on all residential properties purchased by individuals who are not Canadian citizens or permanent residents which had a significant impact on demand in the Vancouver area – more than can be explained by a decline in foreign buyers alone. Prior to the introduction of the tax, foreign buyers accounted for 15% of all sales in the Vancouver area. In September 2016, the first full month after the tax was introduced, sales declined by 33% according to the Real Estate Board of Greater Vancouver. In their most recent report sales were down 42% in February 2017. This suggests that the decline we are seeing is not precisely correlated to demand from foreign buyers, but also from domestic buyers who fear that less foreign demand may cause Vancouver home prices to fall.

Purchases by foreign buyers have once again increased in Vancouver in the first three months after the introduction of the tax. The province has also recently introduced an exemption that allows foreigners on temporary work visas to avoid paying the foreign buyer tax, a well-meaning policy that may be exploited as a loophole by those wanting to avoid the tax.

In the longer term, a more strategic measure from Australia which prohibits foreign buyers from purchasing resale houses but allows them to purchase newly built properties should be considered. Such a policy prevents domestic buyers from being priced out of homes today while leveraging foreign capital to build the homes that will be needed tomorrow.

A more balanced tomorrow

At Realosophy, we focus on using data and analysis to help buyers and sellers make better real estate decisions. We know first-hand that for many Torontonians, their single biggest financial asset is their home. That is why we think that the overall health of the residential real estate market must be prioritized above all other considerations and any destabilizing speculation curbed.

Some of those speculating on real estate are at great financial risk in the event of a personal change in circumstances or decline in house prices; while many will be critical of speculators who suffer losses, we are concerned that some in the real estate industry may not be advising these buyers sufficiently as to their downside risks.

We are also concerned that the ability of regular buyers to afford homes in the GTA will continue to erode with the influx of foreign capital. Part of what makes Toronto attractive as a city is its social stability, but this stability is not immune from the destabilizing effects of rising economic inequality and housing unaffordability.

It is our hope that policy makers will act quickly to help curb speculation in Toronto’s real estate market – and that all consumers will get the data and advice they need to make smarter real estate decisions.

More questions?

Get the right answers to your questions with a no-obligation consultation

Realosophy Realty Inc. Brokerage - Serving Toronto and the Greater Toronto Area