FREE PUBLIC WEBINAR: WATCH REPORT HIGHLIGHTS & Q/A - Thursday November 16th 12PM ET

Join John Pasalis, report author, market analyst and President of Realosophy Realty, in a free monthly webinar as he discusses key highlights from this report, with added timely observations about new emerging issues, and answers your questions. A must see for well-informed Toronto area real estate consumers.
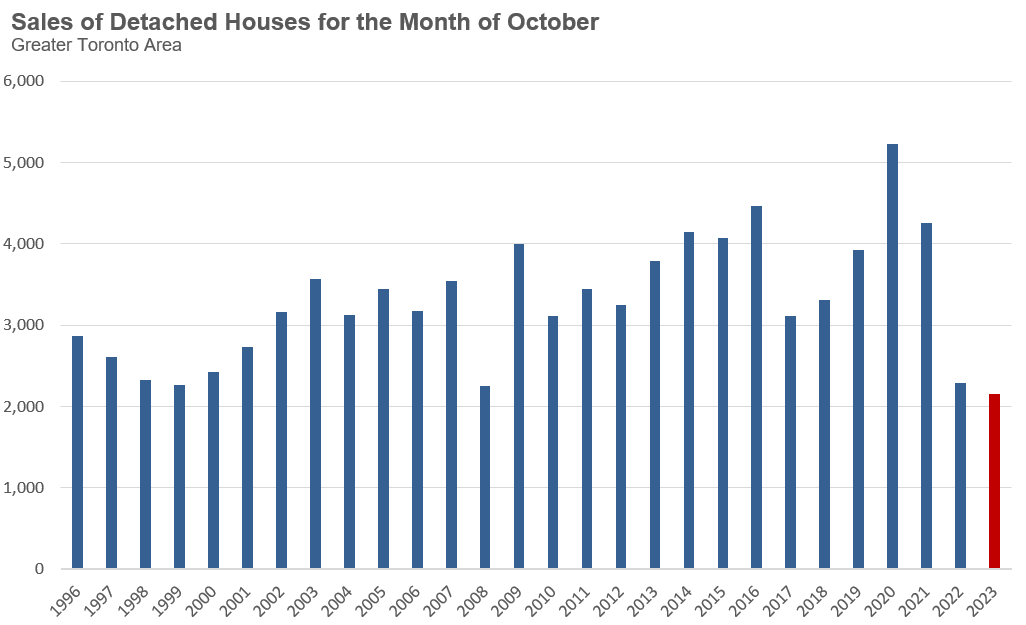
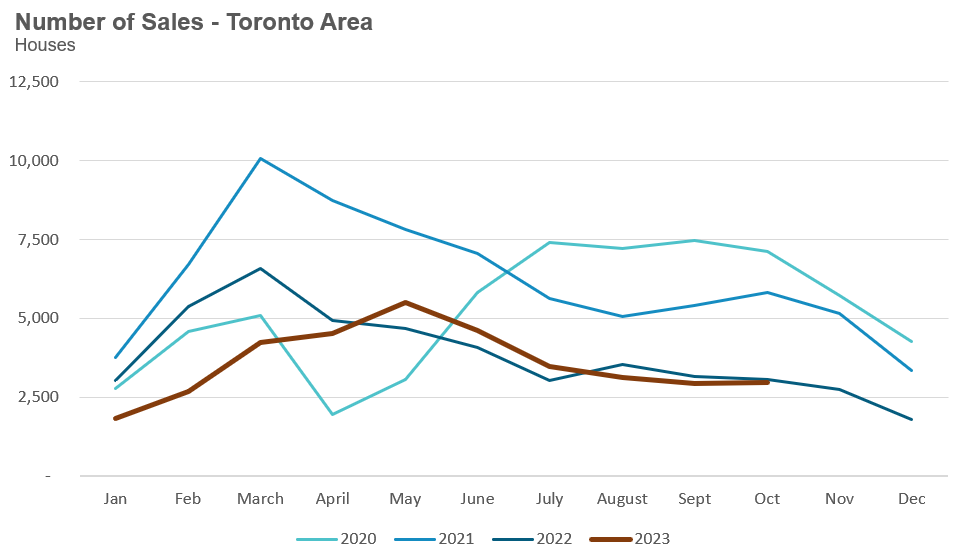
The current high interest rate cycle, which started in 2022, has continued to push home sales in the Greater Toronto Area to historic low levels.
Sales of detached houses were at their lowest level on record for the past month of October, the second month in a row we’ve seen detached sales at record lows for a given month.
Preventing a bigger jump in inventory is the sales-to-new-listings ratio increase from 30% in September to 34% in October, signalling that the number of homes selling relative to the number of new listings coming on the market increased from September to October.
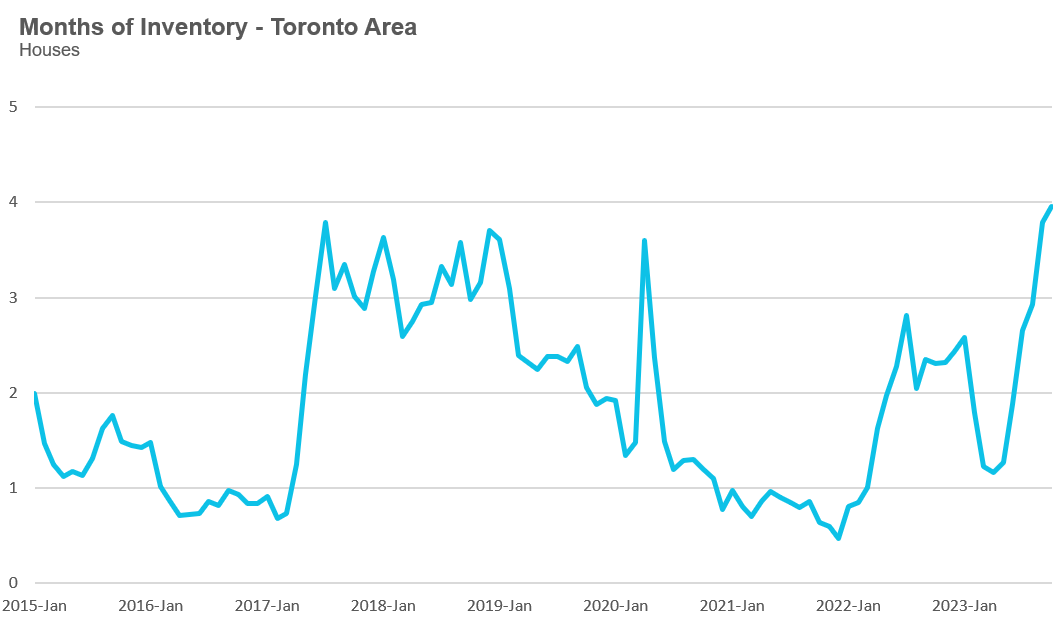
This has helped to keep the months of inventory (MOI) for low-rise houses relatively flat at just under four months, which is at the top of the range for a balanced market, moving towards a buyer’s market.
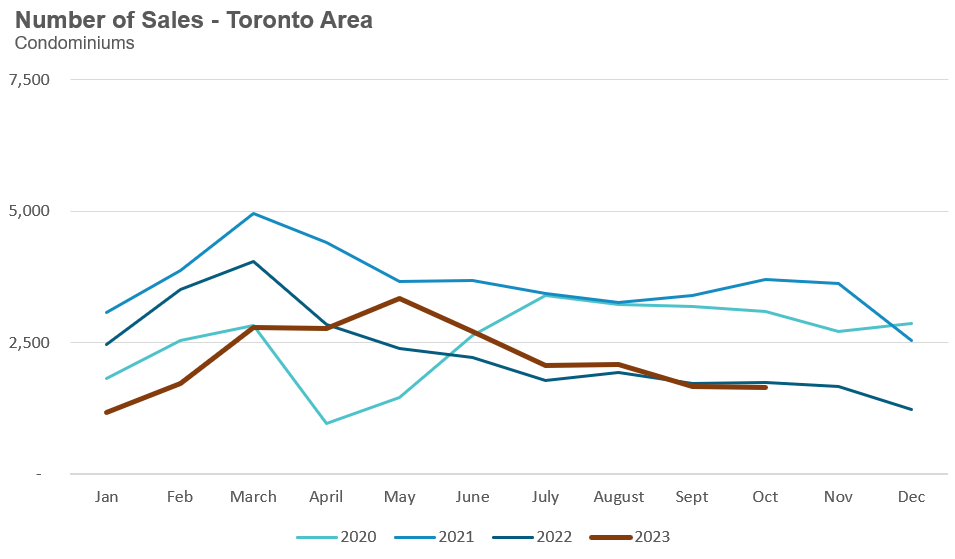
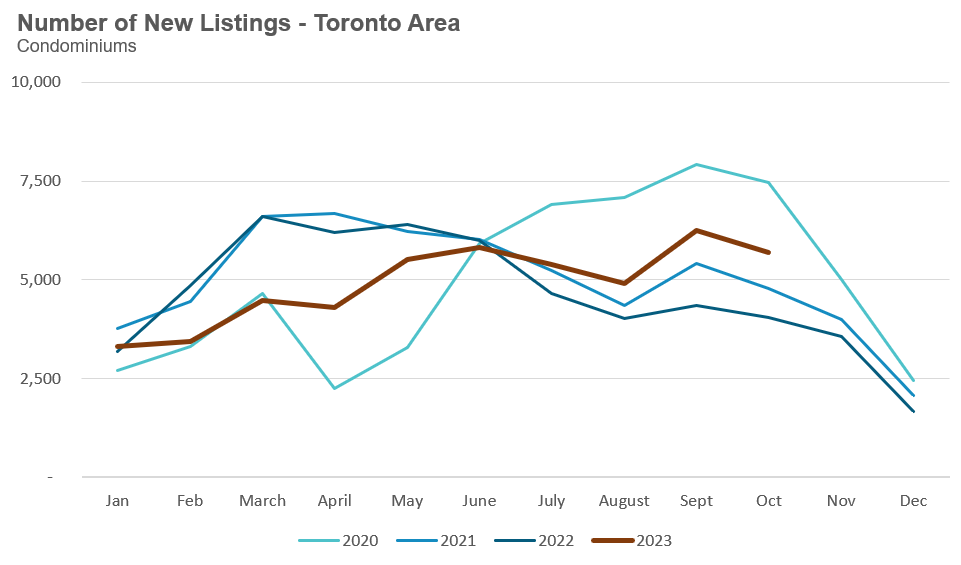
Condo sales were at a 20-year low for the month of October, while new listings remain at their second highest level on record for the month of October.
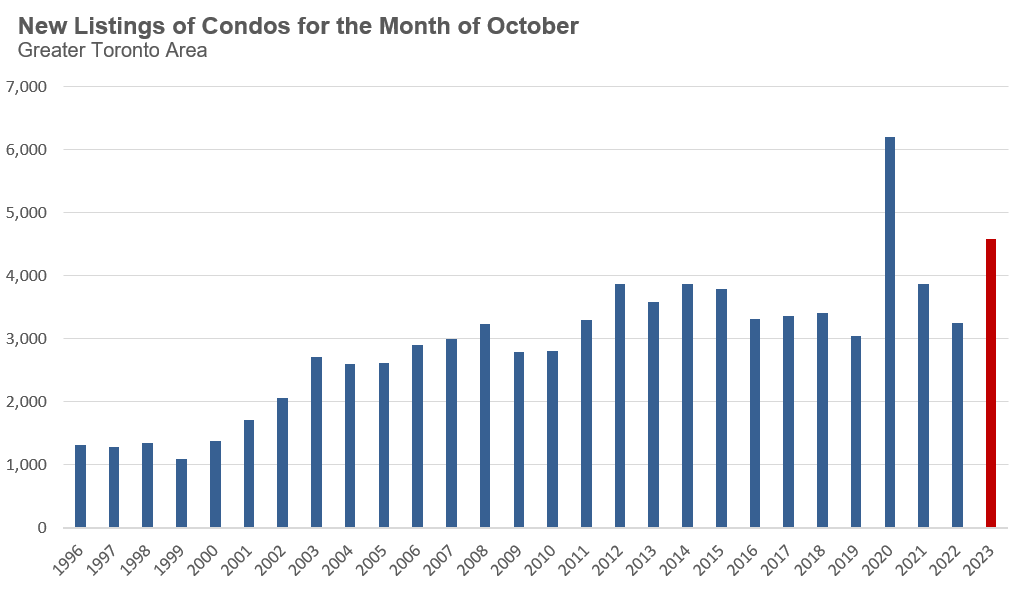
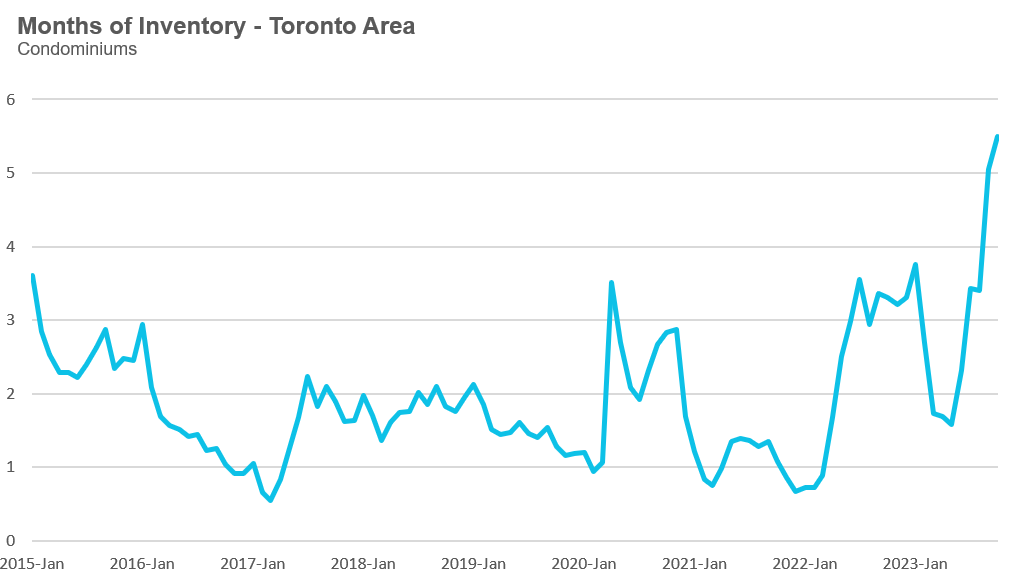
The months of inventory for condos increased from 5 in September to 5.5 in October, a dramatic increase over six months from just over 1.5 MOI in May, pushing into a buyer’s market.
If the MOI for condos continues to trend up from here, we will likely see more downward pressure on prices in the months ahead.
By the Numbers: October 2023
Houses
Year-over-year, the average price for a house in the Toronto area was $1,358,202 in October, up 4% over the same month last year. Last month's median house price was $1,172,000, up 4% over last year.
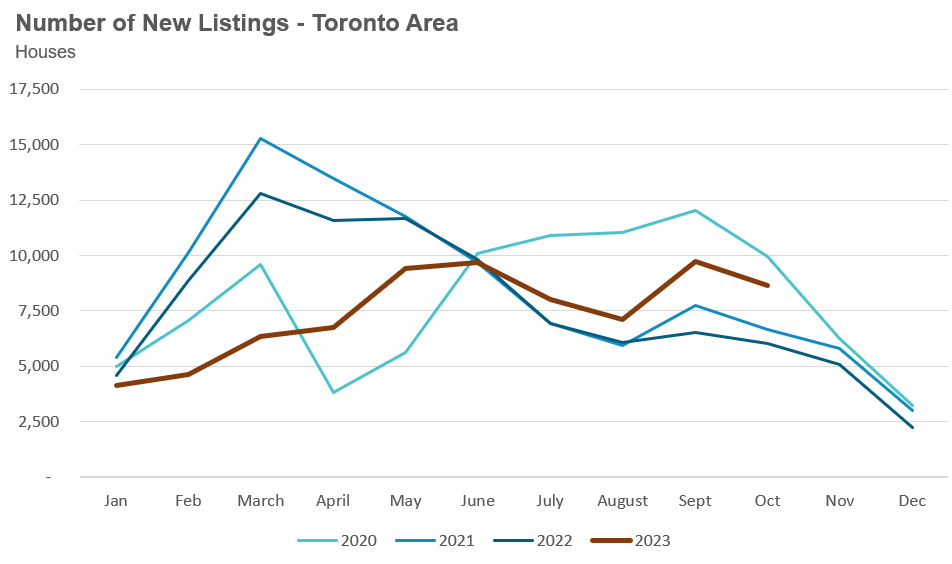
House sales in October were down 3% over last year, while new house listings were up 44%.
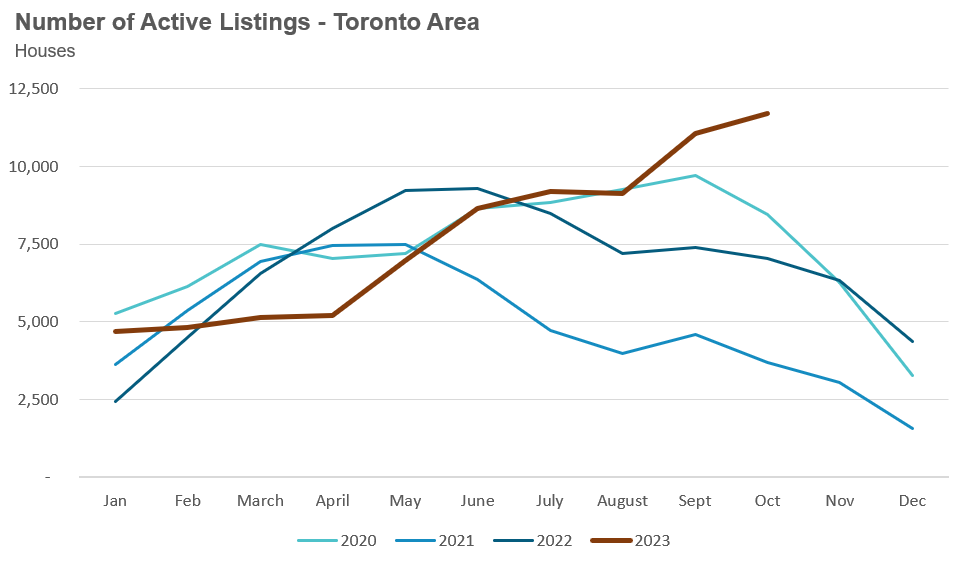
The number of houses available for sale at the end of the month, or active listings, was up 60% over last year.
The current balance between supply and demand is reflected in the Months of Inventory (MOI), which is a measure of inventory relative to the number of sales each month (for a more detailed explanation of this measure, see the final section of this report).
In October, the MOI for houses increased to 4.0 as discussed above, a sharp increase over six months from 1.3 in May, indicating a slowing market.
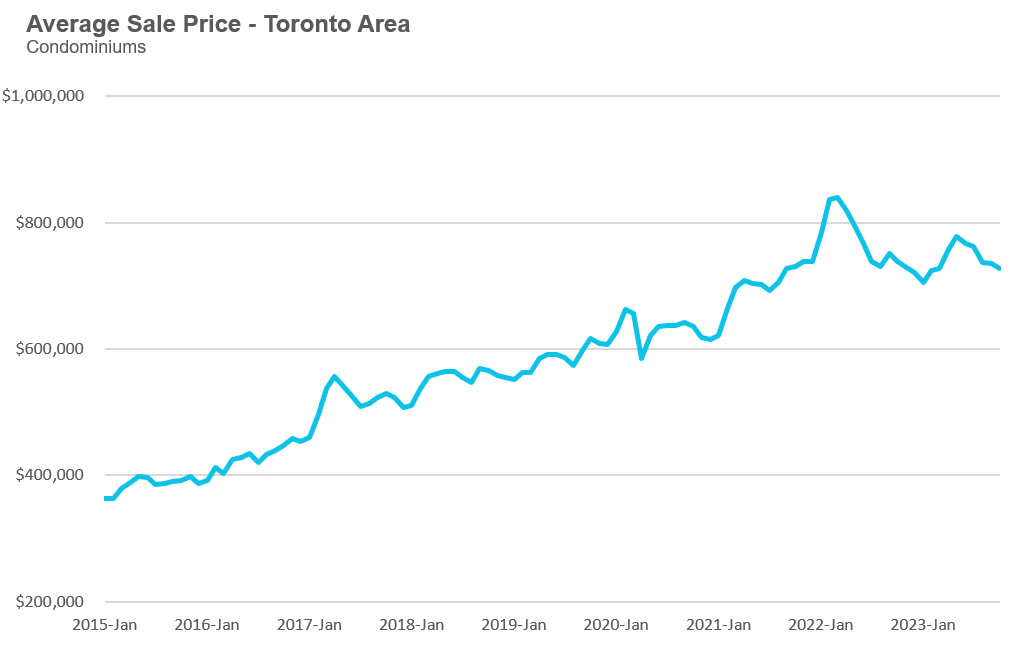
The average price for a condo in the Toronto Area was $726,944 in October, which is down 2% over last year. The median price for a condo in October was $665,000, unchanged over last year.
Condo sales in October were down 5% over last year, and new condo listings were up 41% over last year. The number of active condo listings was up 57% over last year. The MOI increased to 5.5. Much like the market for houses, this is a rapid increase from 1.6 in May, indicating a slowing market.
For detailed monthly statistics for October 2023 for the entire Toronto area market, including house, condo and regional breakdowns, see the final section of this report.
In much the same way we know that housing markets across Canada can perform very differently (something I discussed in a recent interview with BMO’s Robert Kavcic), the same holds for different regions and house types within a metropolitan area.
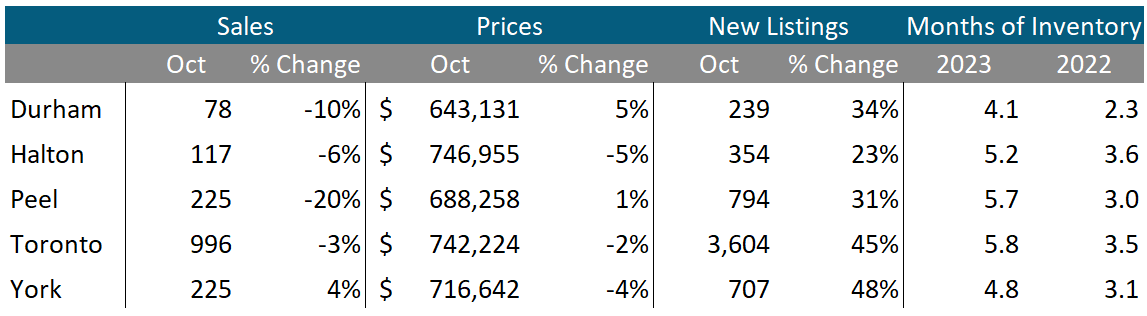
This month’s data dive will examine how the market for low-rise houses and condos is performing across the Greater Toronto Area’s (GTA) five regions.
The chart below shows the year-over-year change in sales for the month of October 2023.
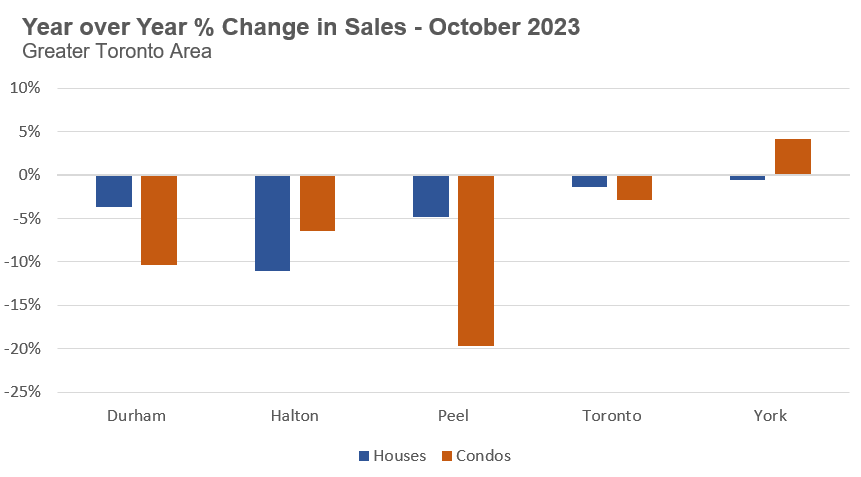
Condos in Peel have seen the biggest decline in sales at just under 20%, followed by houses in Halton region with a decline of 11%. Condos in York are the only house type that has seen sales increase over last year.
One noteworthy trend is that most regions and house types saw sales volumes change within 5% of last year’s levels. Sales were relatively soft in the GTA last year, but the big difference between this year and last is the change in the number of homes available for sale, or active listings.
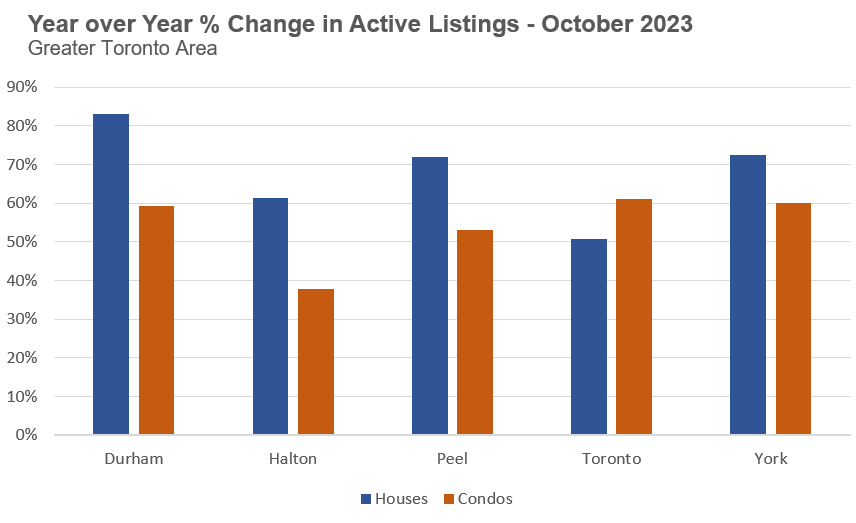
The number of homes available for sale across the GTA is up by over 50% across all house types and regions, excluding Halton condos which is up 38%. Suburban houses have seen the steepest increase in the number of active listings followed by condos in the City of Toronto.
But to better understand the balance in each market, we need to look at the months of inventory (MOI).
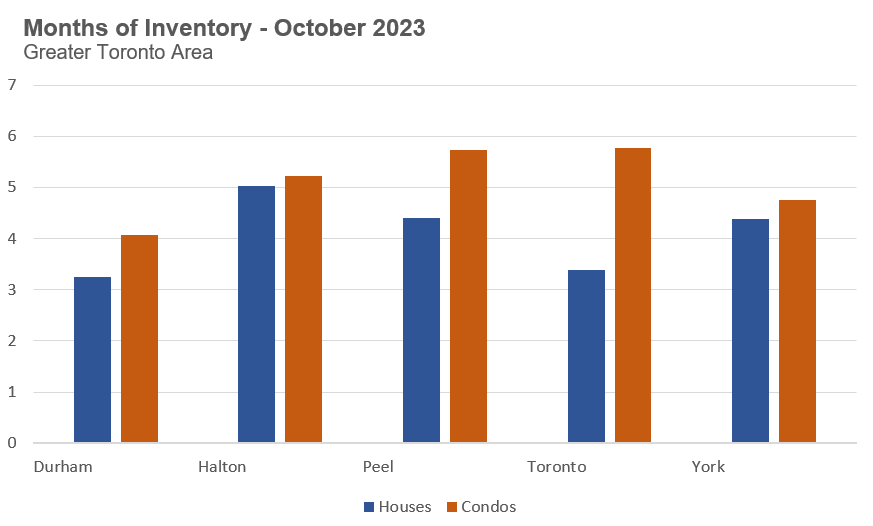
Even though houses in Durham saw the biggest increase in active listings out of all regions and house types, it also has the lowest MOI, which suggests that the market is more balanced and competitive than all the other regions and house types.
Across all five regions, the market for condos has a higher MOI than the market for houses, with the City of Toronto seeing the biggest difference between house types, with houses at 3.4 MOI compared to 5.8 MOI for condos, indicating a slower market for condos.
There is a significant amount of variability in the MOI for houses across municipalities in the GTA. The chart below shows the MOI for houses in October for each municipality.
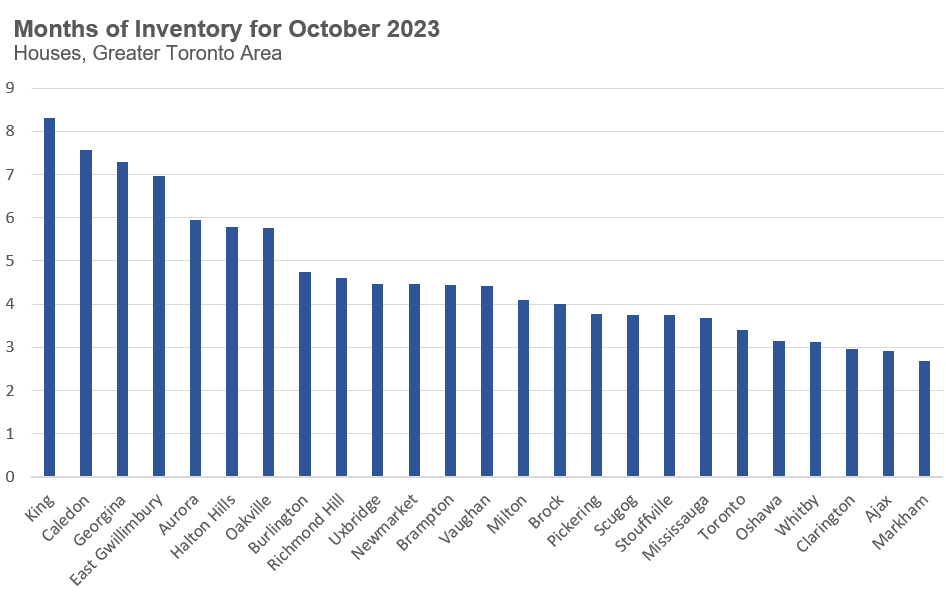
Far outlying areas of the GTA with a high MOI of 7 to 8 MOI, include King, Caledon, Georgina and East Gwillimbury. On the other end are areas around 3 MOI, including Oshawa, Whitby, Clarington, Ajax and Markham, which nearer to Toronto suburbs in the east-end region of Durham.
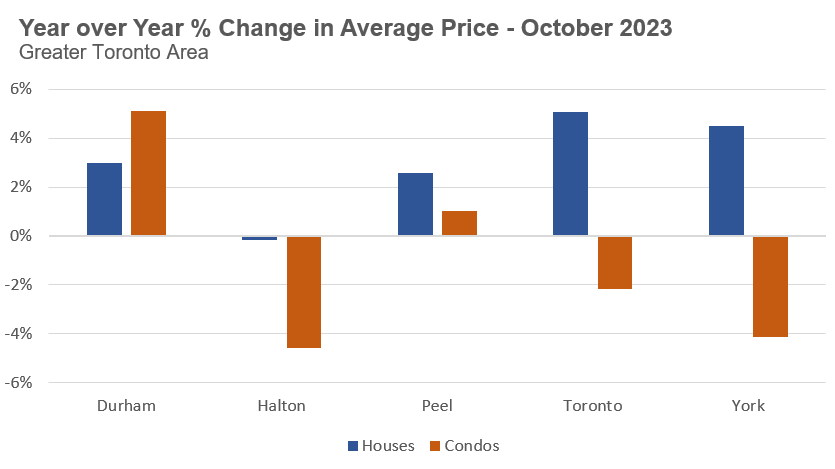
When considering how prices have changed over last year, it’s important to remember that prices across the GTA have been trending down over the past four months. This means that regions and house types where prices are up year-over-year are not an indication that prices are currently trending up in those areas. A more appropriate way to interpret this positive price growth is that despite declining prices since the spring, prices are still up over last year.
Interestingly, despite the surge in active listings and the record low demand for houses, average prices are still up year-over-year in four of the five regions.
The important takeaway for buyers and sellers is that the market dynamics for the property they are looking at buying or selling are very local. You cannot lean on aggregate trends for the Greater Toronto Area to inform your real estate decisions.
You can visit Realosophy.com to keep on top of all data trends in the GTA by area.
House sales (low-rise freehold detached, semi-detached, townhouse, etc.) in the Greater Toronto Area (GTA) in October 2023 were down 3% over the same month last year.
New house listings in October were up 44% over last year.
The number of houses available for sale (“active listings”) was up 66% in October compared to the same month last year.
The Months of Inventory ratio (MOI) looks at the number of homes available for sale in a given month divided by the number of homes sold in that month. It answers the following question: If no more homes came on the market for sale, how long would it take for all the existing homes on the market to sell, given the current level of demand? The higher the MOI, the cooler the market is. A balanced market (a market where prices are neither rising nor falling) is one where MOI is between four to six months. The lower the MOI, the more rapidly we would expect prices to rise.
While the current level of MOI gives us clues into how competitive the market is on-the-ground today, the direction it is moving in also gives us some clues into where the market may be heading.
The MOI for houses increased sharply from 1.3 in May to 4.0 in October, signaling a rapidly cooling down market, moving into a buyer’s market.
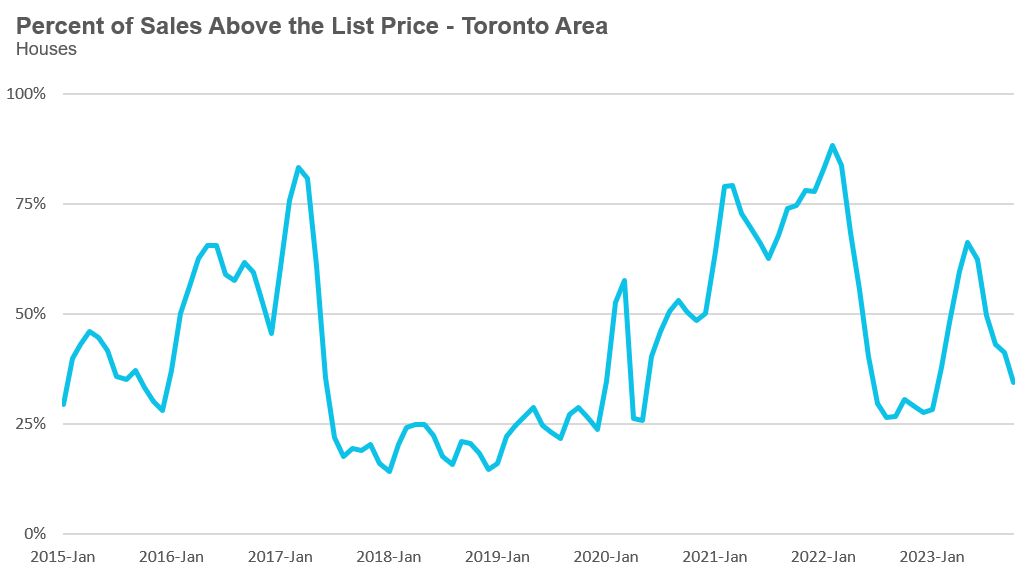
The share of houses selling for more than the owner’s list price decreased to 34% in October.
The average price for a house in October was $1,358,202 in October 2023, up 4% when compared to the same month last year.
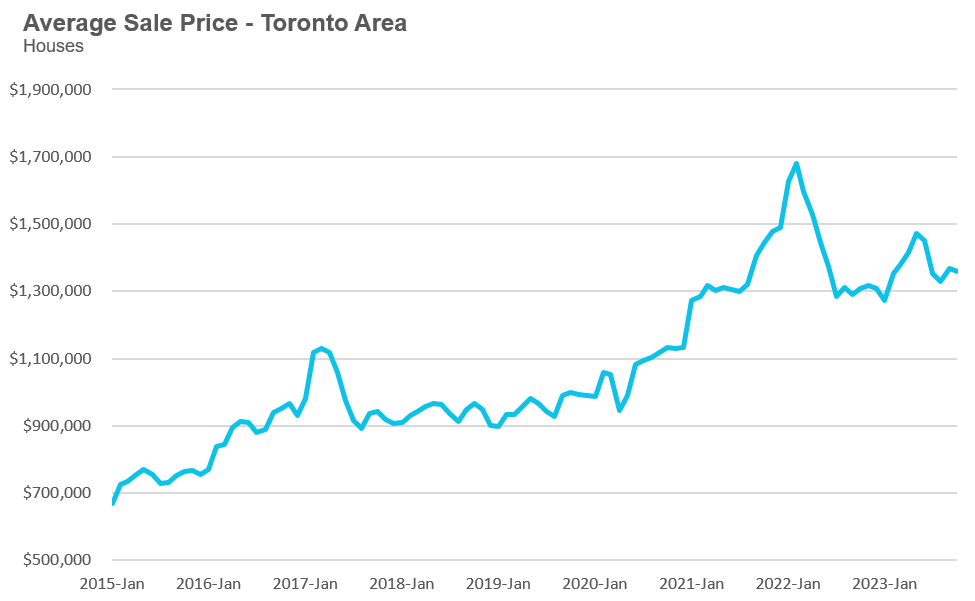
The median house price in October was $1,172,000, up 4% over last year.
The median is calculated by ordering all the sale prices in a given month and then selecting the price that is in the midpoint of that list such that half of all home sales were above that price and half are below that price. Economists often prefer the median price over the average because it is less sensitive to big increases in the sale of high-end or low-end homes in a given month which can skew the average price.
Condo (condominiums, including condo apartments, condo townhouses, etc.) sales in the Toronto area in October 2023 were down 5% over the same month last year.
New condo listings were up 41% in October over last year.
The number of condos available for sale at the end of the month, or active listings, was up 57% over last year.
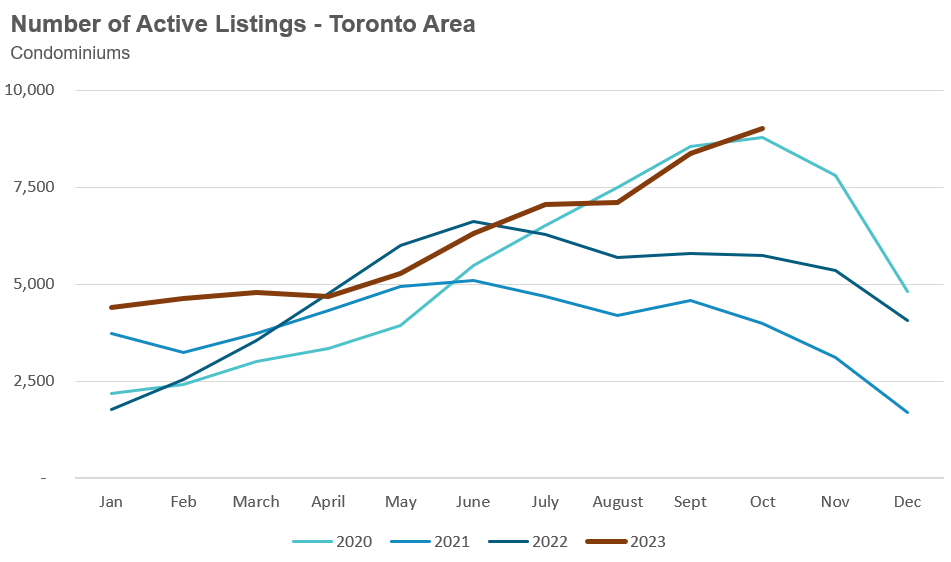
Condo months of inventory increased from 1.6 in May to 5.5 MOI in October, a sign that the condo market is rapidly cooling down.
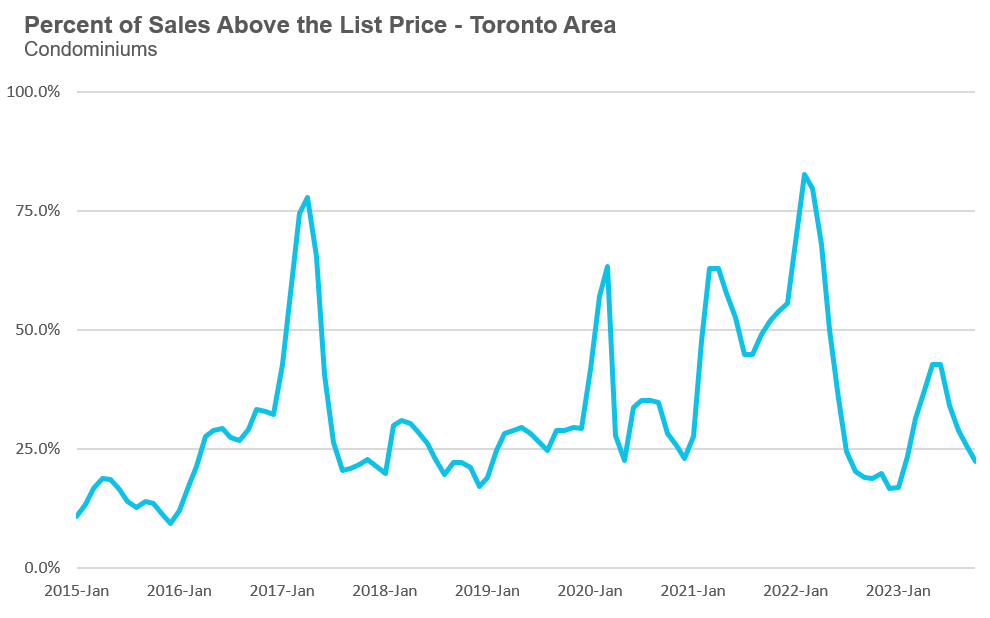
The share of condos selling for over the asking price declined to 22% in October.
The average price for a condo in October was $726,944, down 2% over last year. The median price for a condo in October was $665,000, unchanged from last year.
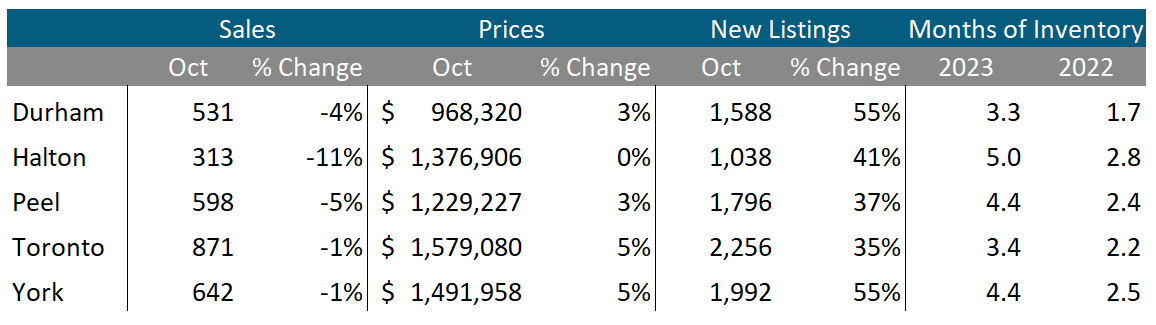
Houses
Average house prices were up across the GTA last month with the exception of Halton where prices remained flat. Sales were down across all GTA regions, while new listings were up significantly across all five regions. The MOI is well above last year’s levels, suggesting the market for houses is cooler this year compared to last year.
Condos
Condo sales were down in Halton, Peel, Toronto and Durham while York saw sales increase over last year. Average prices were down in Halton, Toronto and York and up in Durham and Peel. New listings are up significantly across the GTA. The MOI is above last year’s level, suggesting a cooler market.