

FREE PUBLIC WEBINAR: WATCH REPORT HIGHLIGHTS & Q/A - Thursday September 14th 12PM ET

Join John Pasalis, report author, market analyst and President of Realosophy Realty, in a free monthly webinar as he discusses key highlights from this report, with added timely observations about new emerging issues, and answers your questions. A must see for well-informed Toronto area real estate consumers.
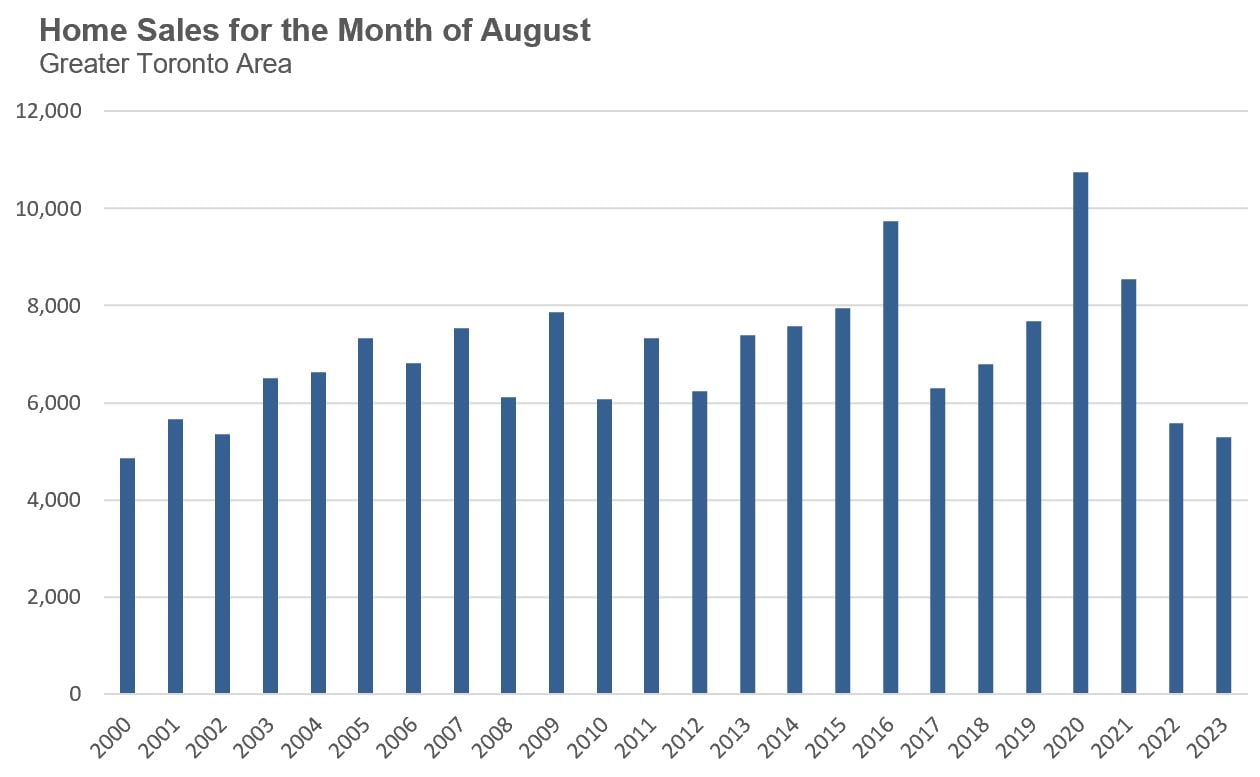
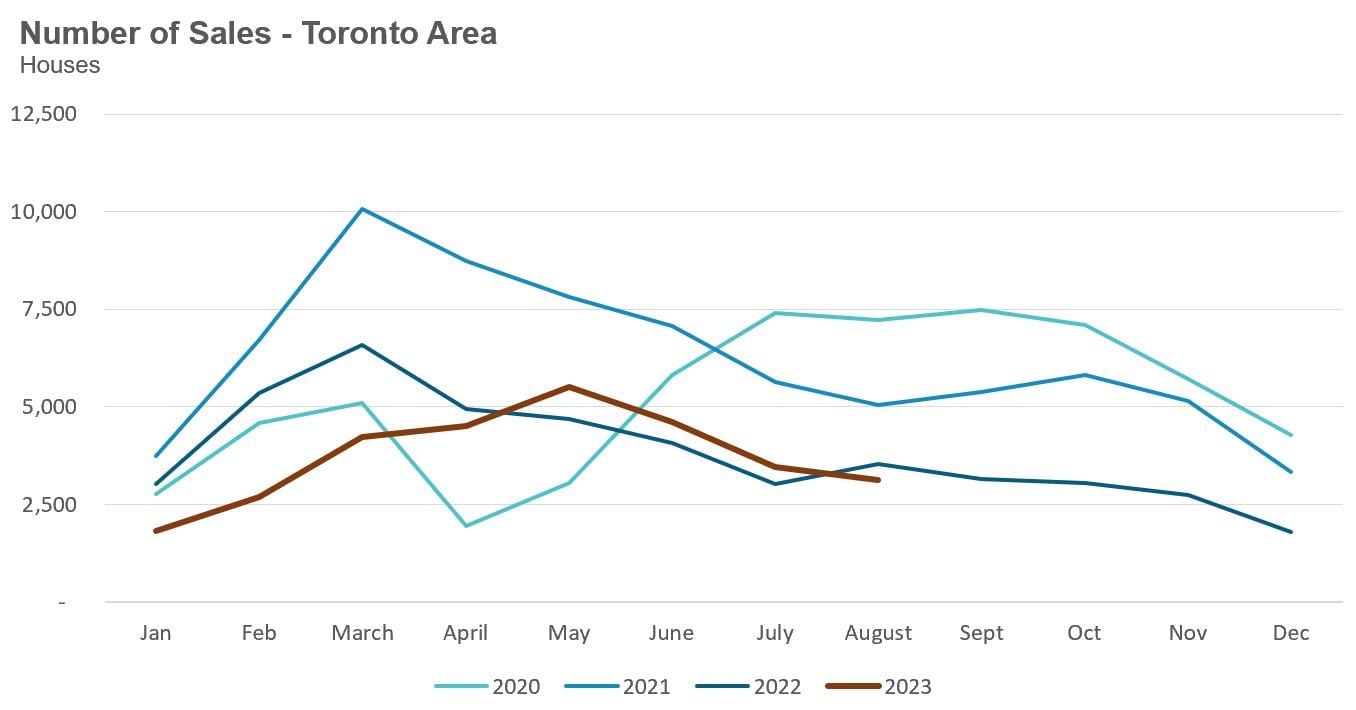
August is typically a relatively quiet month for Toronto’s housing market since many buyers hit pause to enjoy the summer weather, but the decline in sales in the Toronto area’s housing market last month was not just about a seasonal dip in sales.
When we look at the number of homes sold for the month of August back to 2000, we see that home sales this year were at a 20-year low.
What’s driving this decline in sales?
Before June 2023, the sentiment among home buyers in the Toronto area was relatively optimistic, driven by an expectation that the Bank of Canada (BoC) was done raising their policy rate and would be cutting interest rates sooner rather than later. The BoC’s decision to increase its policy rate in June 2023 shifted the sentiment overnight. This change in sentiment, coupled with an increase in fixed-rate mortgages, rapidly cooled the demand for homes.
Today’s home buyers are paying over 6% for a mortgage, which has weighed on people’s ability to afford today’s home prices.
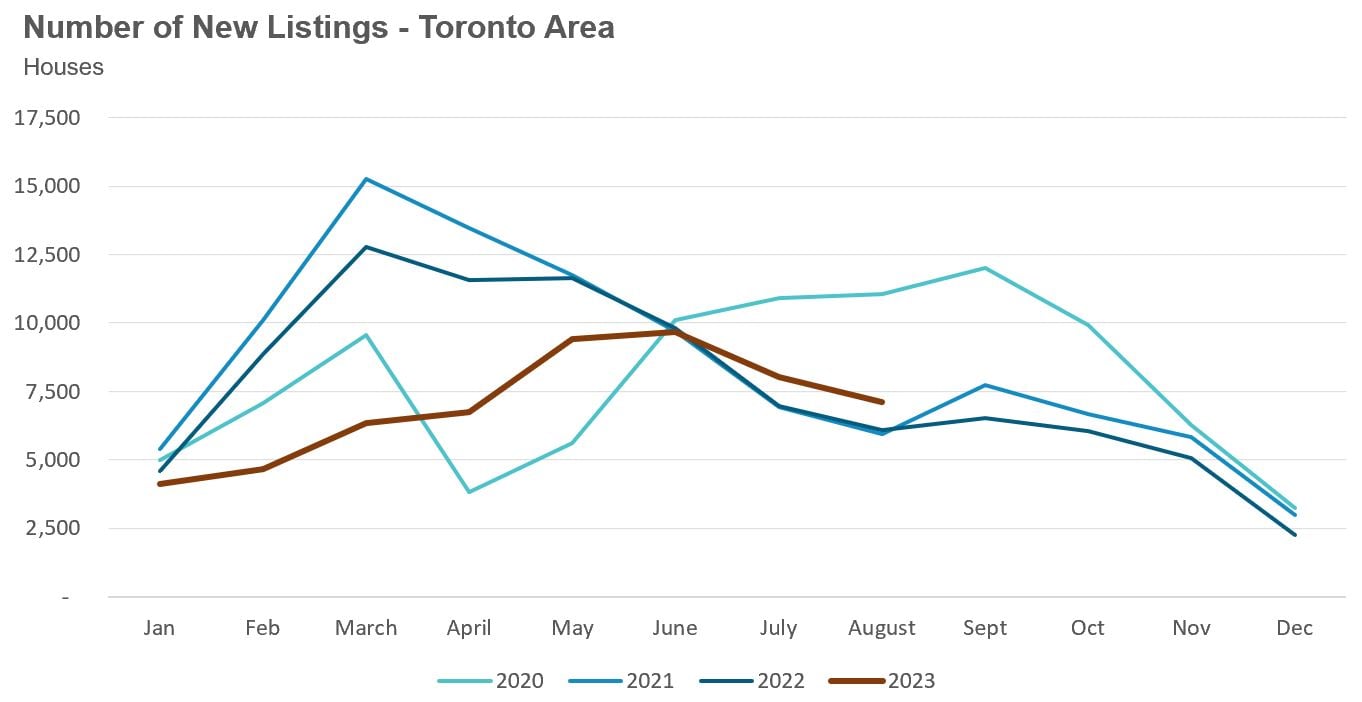
On the other hand, new listings for August are in line with historical levels. On the ground, we are beginning to see more owners listing their investment properties for sale to deleverage.
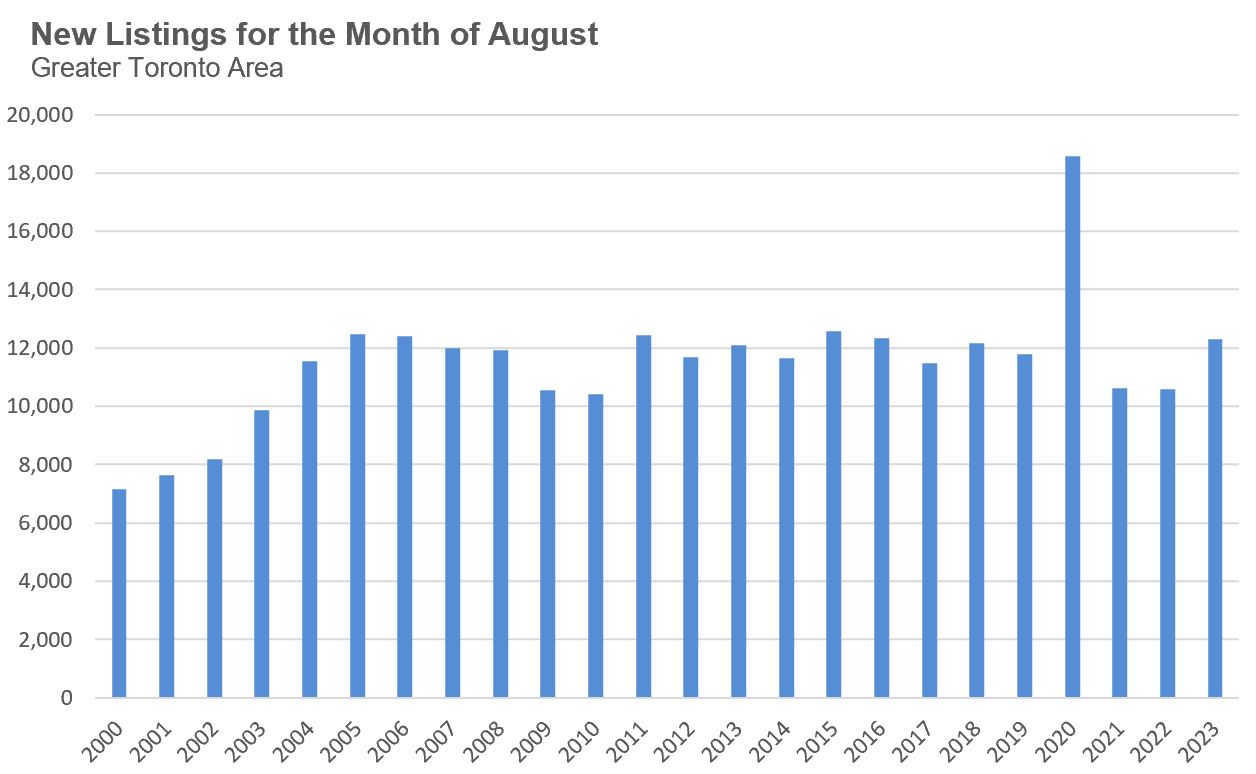
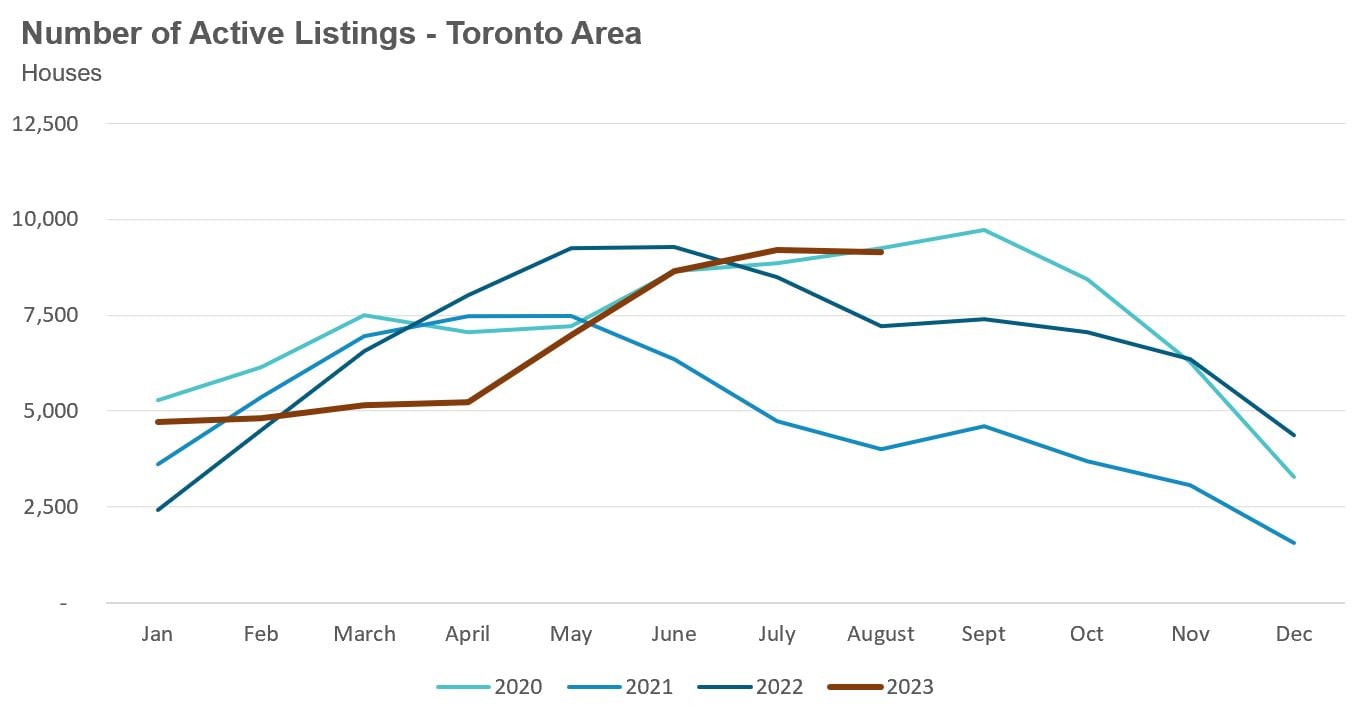
The 20-year low in sales and a strong volume of new listings have helped drive up the number of homes available for sale (See this month’s Data Dive).
One important trend we will need to keep a close eye on in the months ahead is the volume of new listings coming on the market for sale. If the volume of new listings accelerates well above historical norms, and sales remain at 20-year lows, this could put pressure on home prices in the months ahead.
This delicate balance between sales and new listings will drive the future path of home prices during the fall market.
But one important fact to remember is that the trends we observe for the GTA do not necessarily reflect what is going on in every region or house type.
Any imbalance between supply and demand can vary significantly across regions and house types. For home buyers and sellers, it will be important to understand the local market dynamics in the areas you’re considering.
Today’s Data Dive is inspired by a chart from housing analyst Ben Rabidoux’s firm Edge Realty Analytics. The chart compared the change in the number of active listings from May to August of each year, which I have reproduced below.
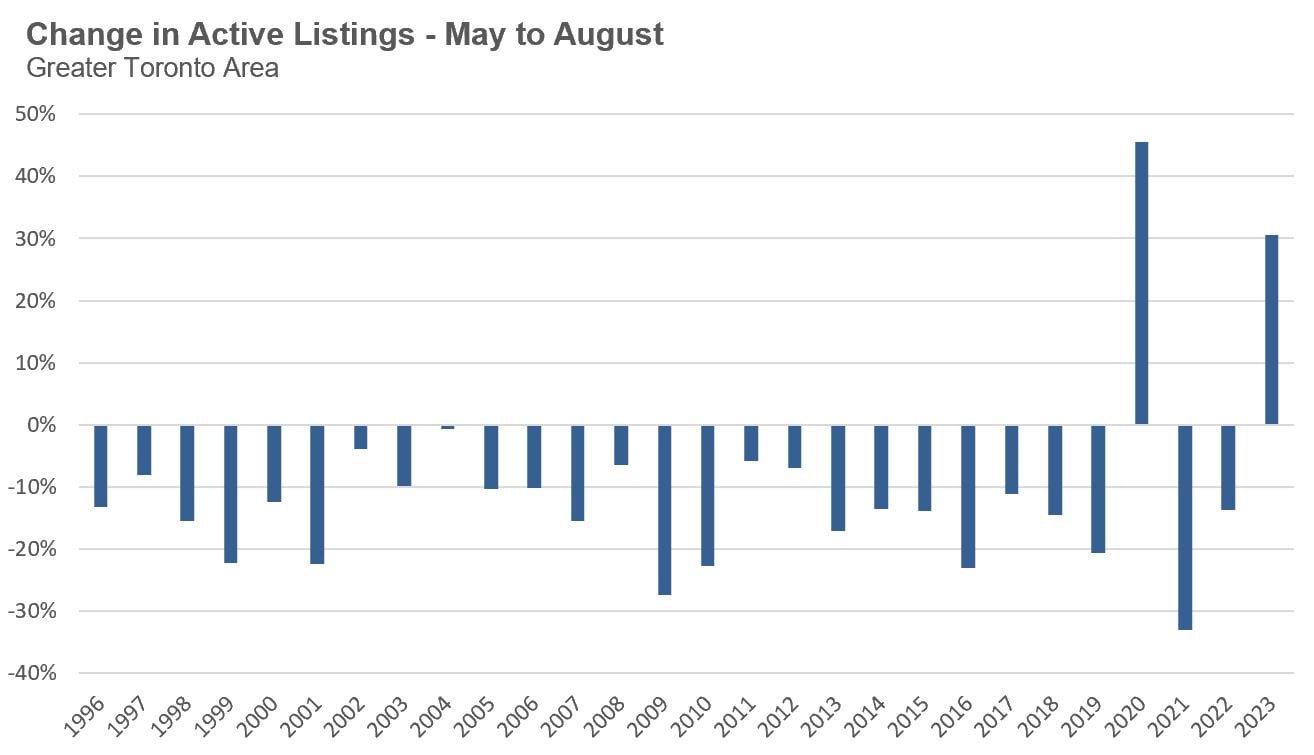
Toronto’s housing market typically sees the number of homes available for sale decline between May and August. Only two years have seen the number of active listings increase over that period, 2020 and 2023, as seen above.
The increase in 2020 was largely driven by the fact that listing volumes were low in May 2020 due to initial COVID lockdowns.
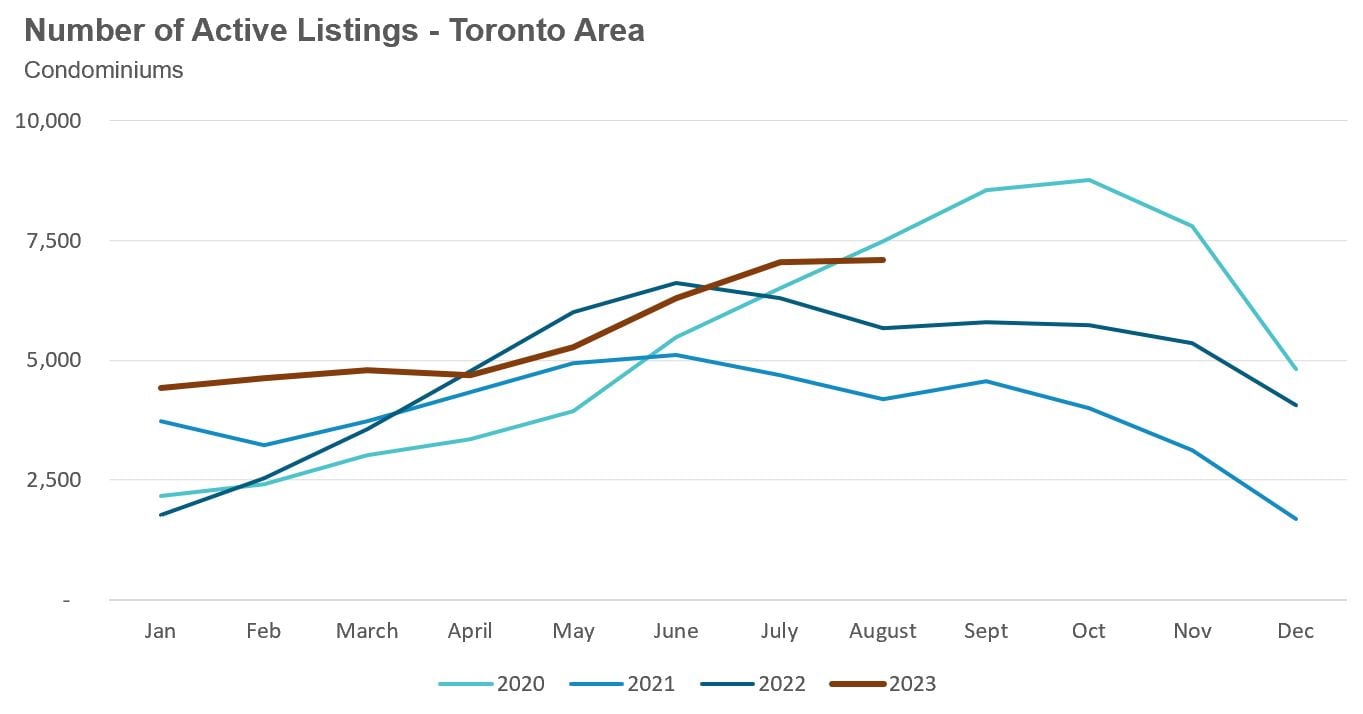
The increase in active listings in 2023 is due to home sales declining to 20-year lows when new listing volumes are returning to historical levels.
We can see from the chart above that the active listings increased by roughly 30% between May and August of 2023. The chart below breaks out the increase in active listings by region and house type to better understand which areas and house types saw a bigger surge in active listings.
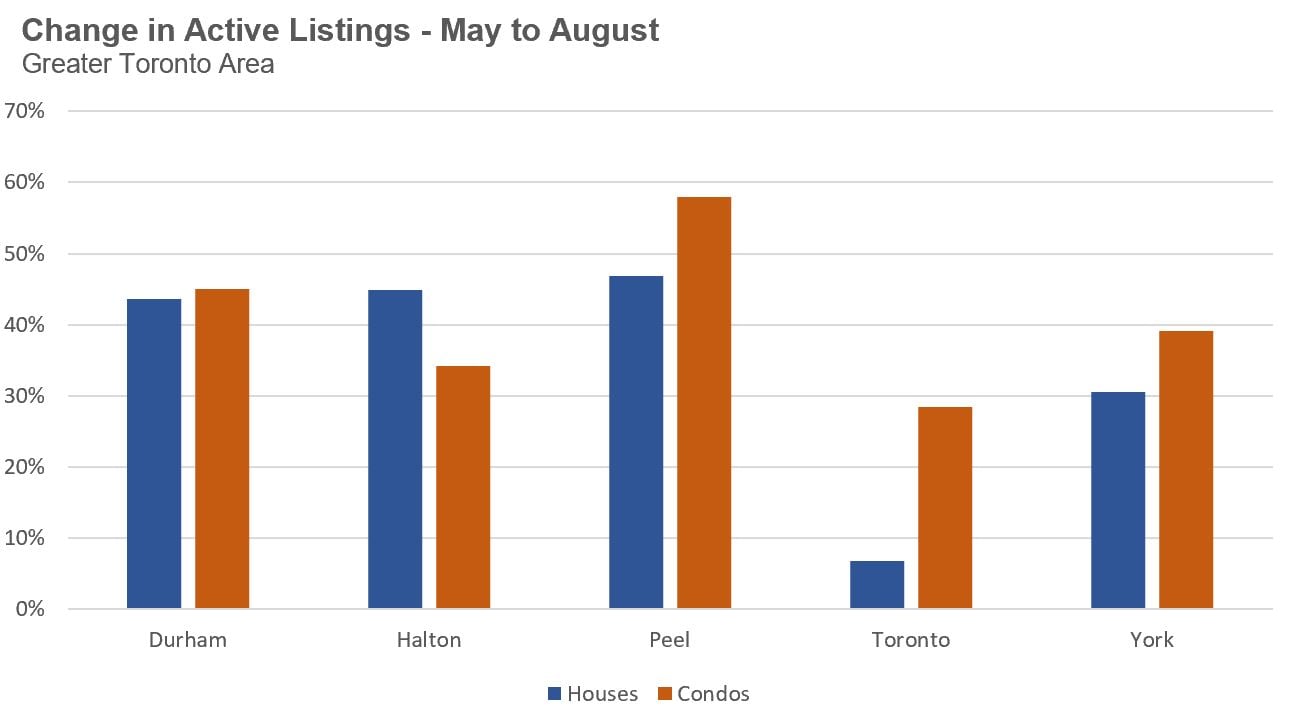
When considering the increase in active listings for houses, we can see that the suburban regions of Durham, Halton and Peel all saw listings significantly outpace the City of Toronto which only saw a modest increase in active listings. Suburban condo inventory also outpaced the City of Toronto, although the increase in active condo listings in Toronto was still historically high at 28%.
Over the next four months, I’ll closely monitor these regional differences to understand better how each area of the GTA is performing.
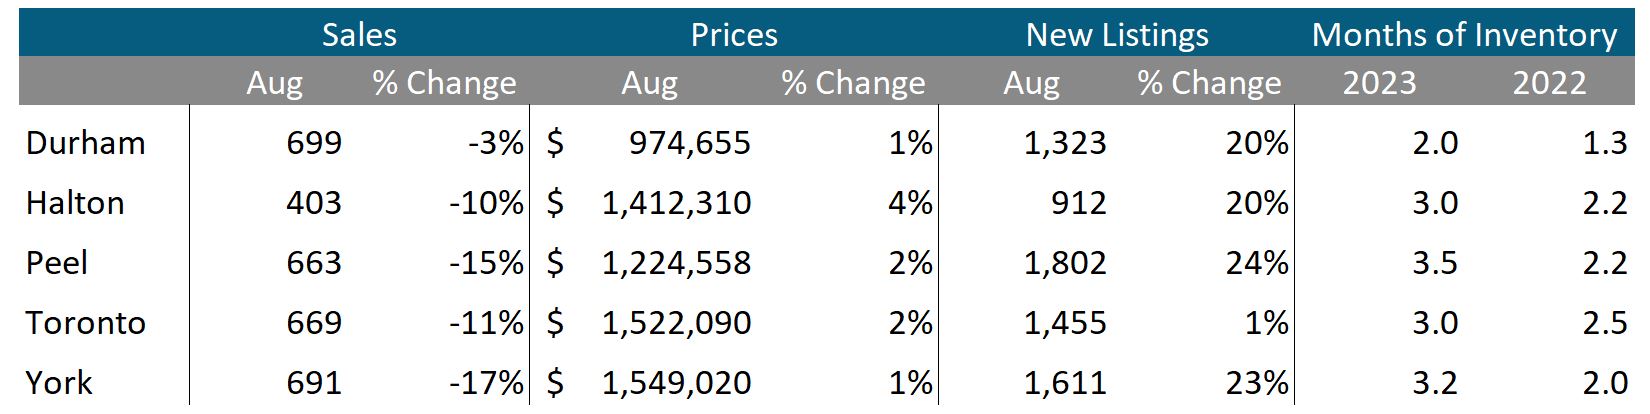
House sales (low-rise freehold detached, semi-detached, townhouse, etc.) in the Greater Toronto Area (GTA) in August 2023 were down 12% over the same month last year.
New house listings in August were up 17% over last year.
The number of houses available for sale (“active listings”) was up 27% in August when compared to the same month last year.
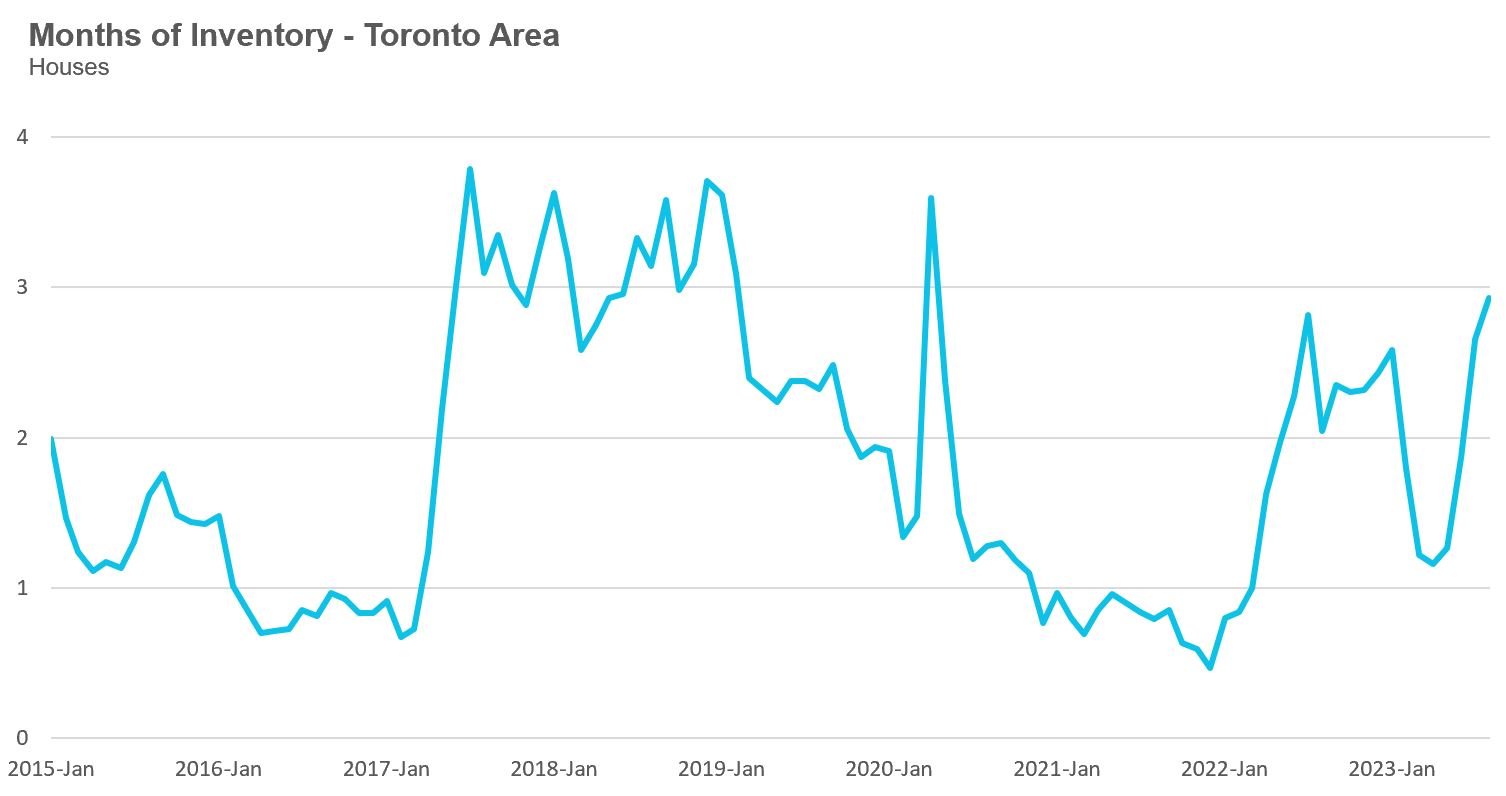
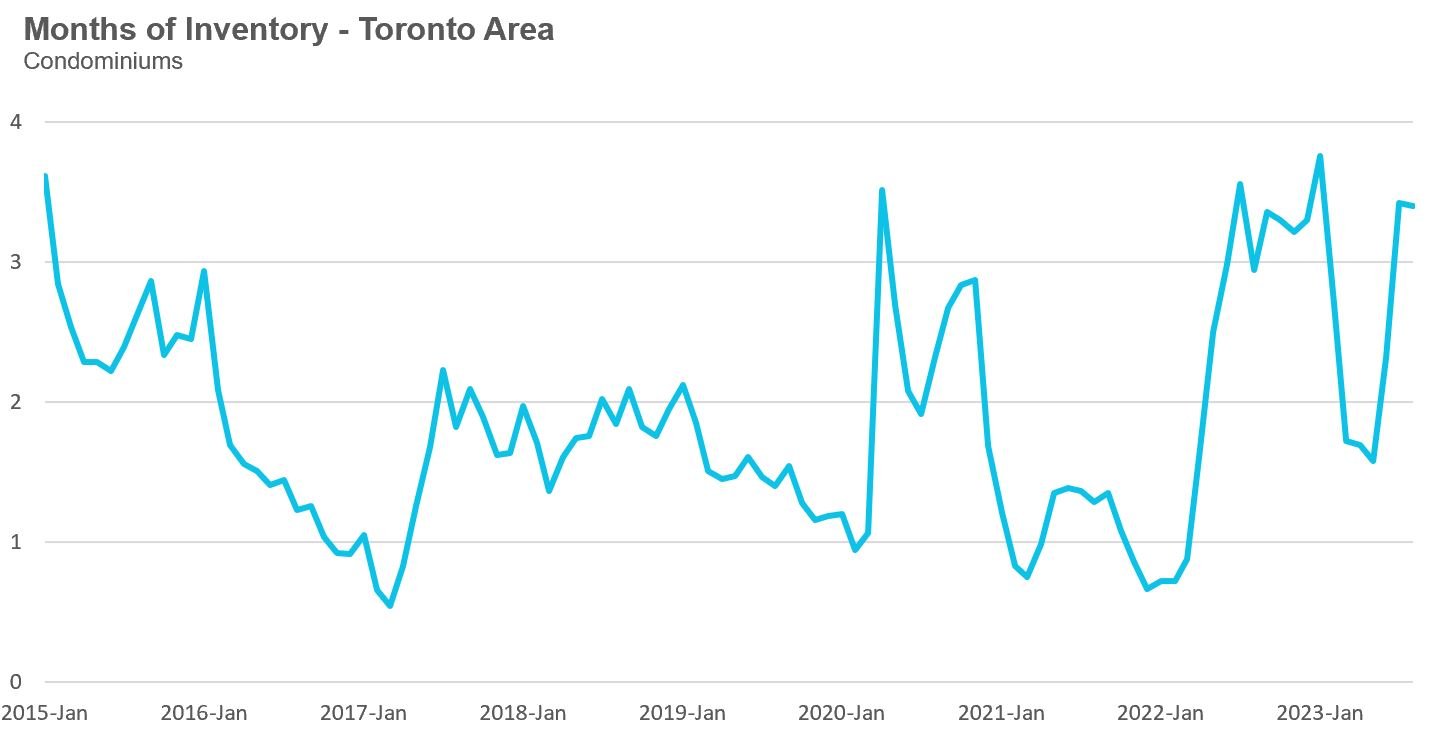
The Months of Inventory ratio (MOI) looks at the number of homes available for sale in a given month divided by the number of homes sold in that month. It answers the following question: If no more homes came on the market for sale, how long would it take for all the existing homes on the market to sell, given the current level of demand? The higher the MOI, the cooler the market is. A balanced market (a market where prices are neither rising nor falling) is one where MOI is between four to six months. The lower the MOI, the more rapidly we would expect prices to rise.
While the current level of MOI gives us clues into how competitive the market is on-the-ground today, the direction it is moving in also gives us some clues into where the market may be heading.
The MOI for houses increased sharply from 1.3 in May to 2.9 in August, signaling a rapidly cooling down market.
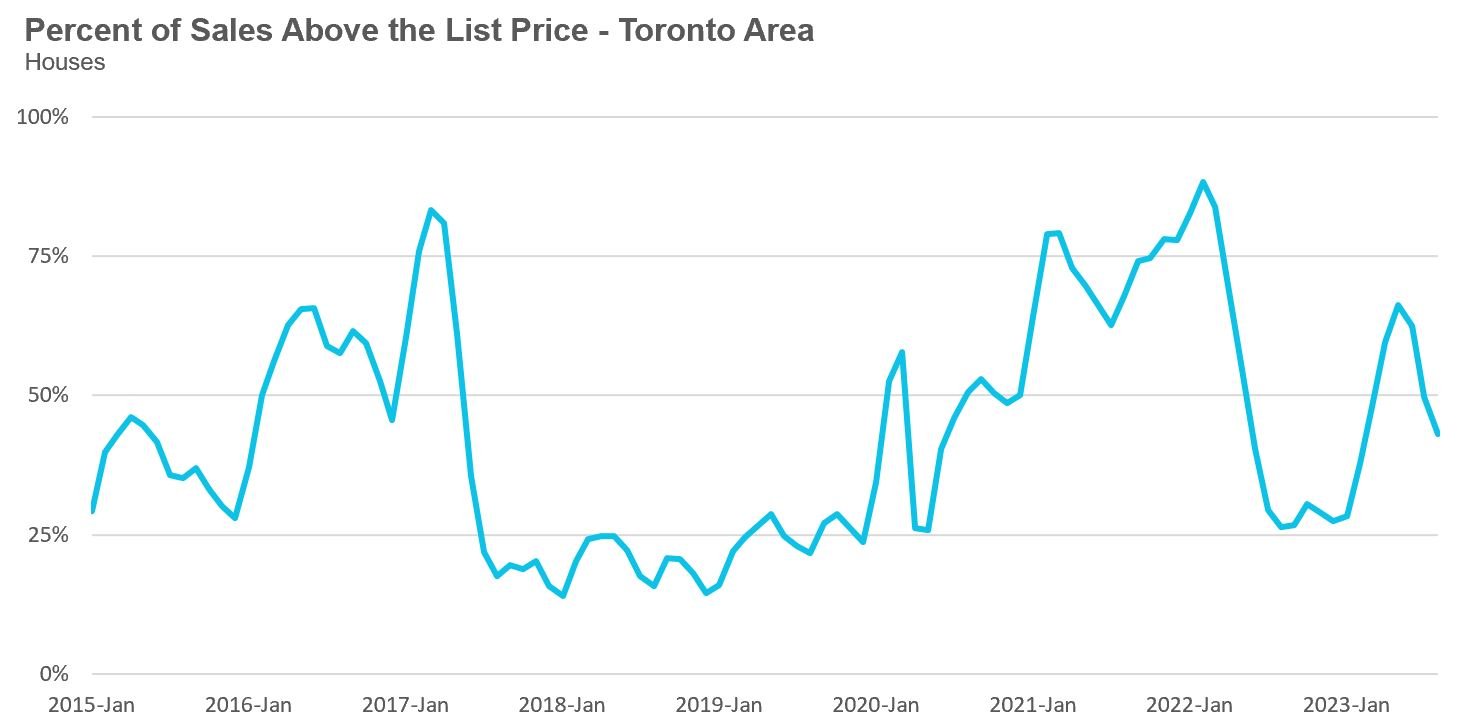
The share of houses selling for more than the owner’s list price decreased to 43% in August.
The average price for a house in August was $1,328,313 in August 2023, up 1% when compared to the same month last year but down 10% over the past three months.
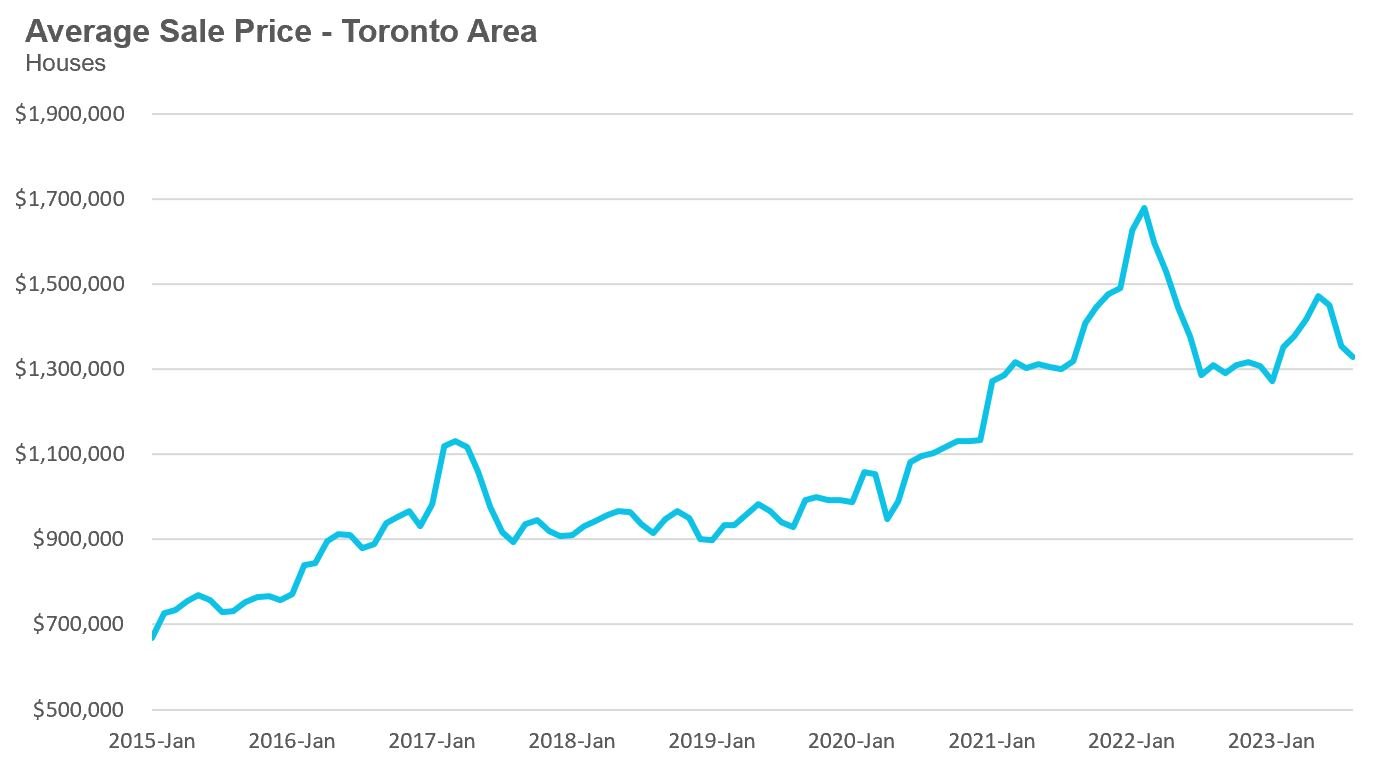
The median house price in August was $1,160,000, up 5% over last year, but also down 10% over the past two months.
The median is calculated by ordering all the sale prices in a given month and then selecting the price that is in the midpoint of that list such that half of all home sales were above that price and half are below that price. Economists often prefer the median price over the average because it is less sensitive to big increases in the sale of high-end or low-end homes in a given month which can skew the average price.
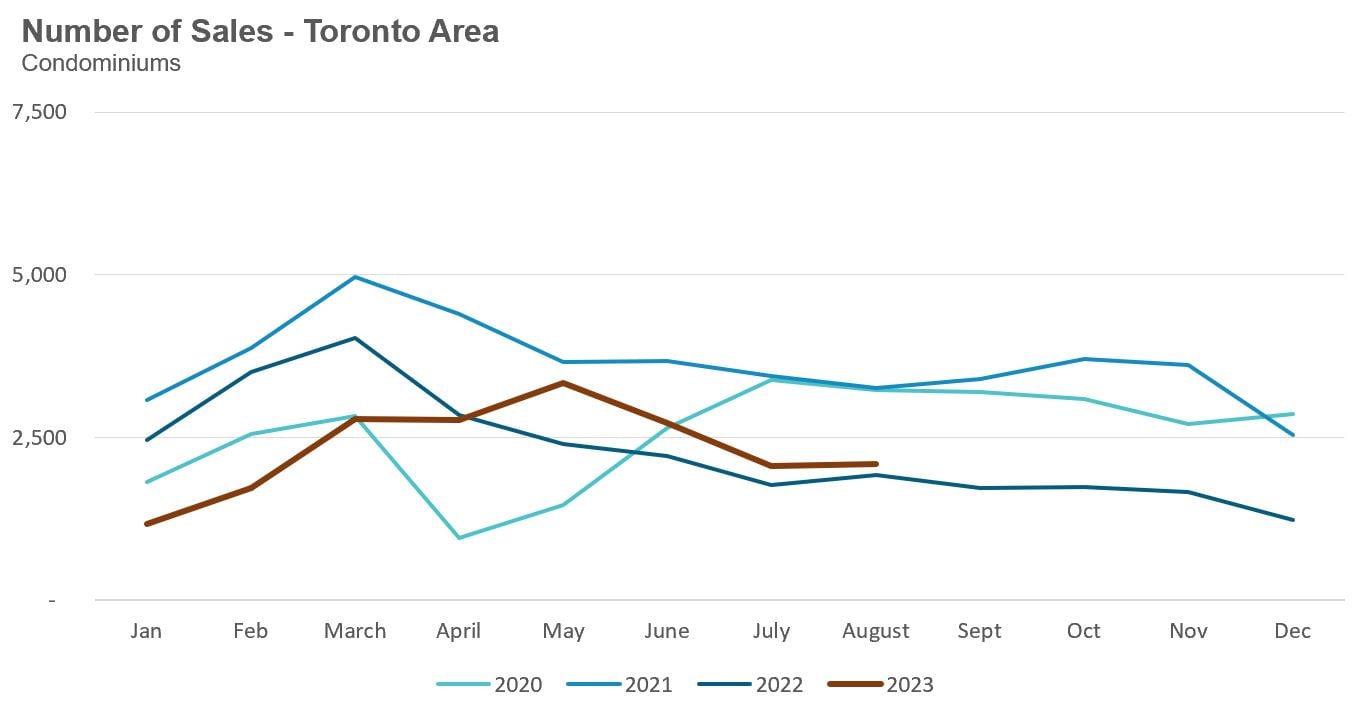
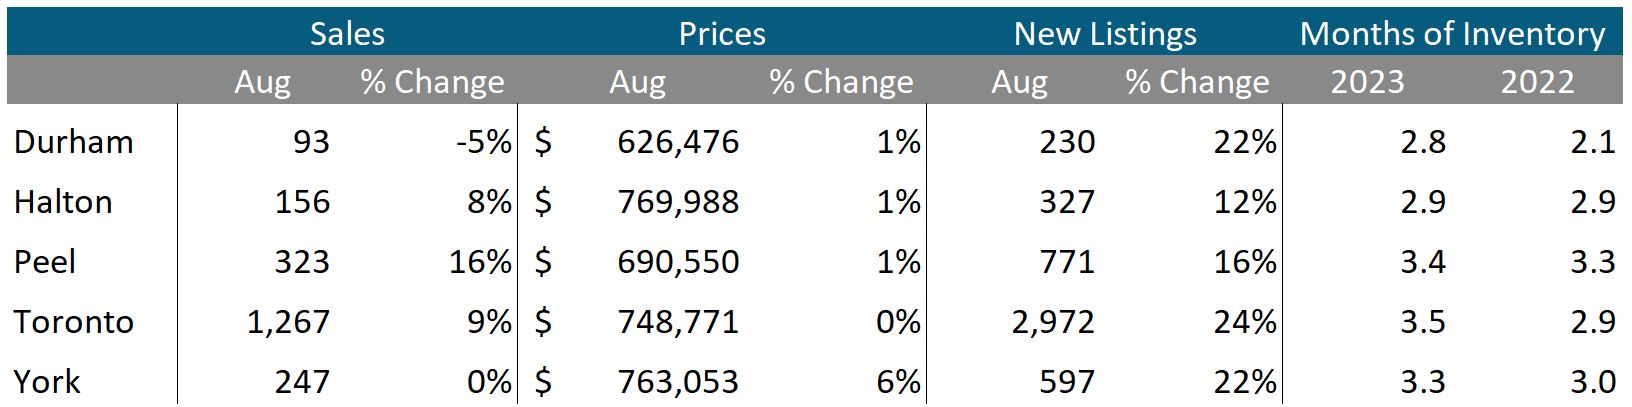
Condo (condominiums, including condo apartments, condo townhouses, etc.) sales in the Toronto area in August 2023 were up 8% over the same month last year.
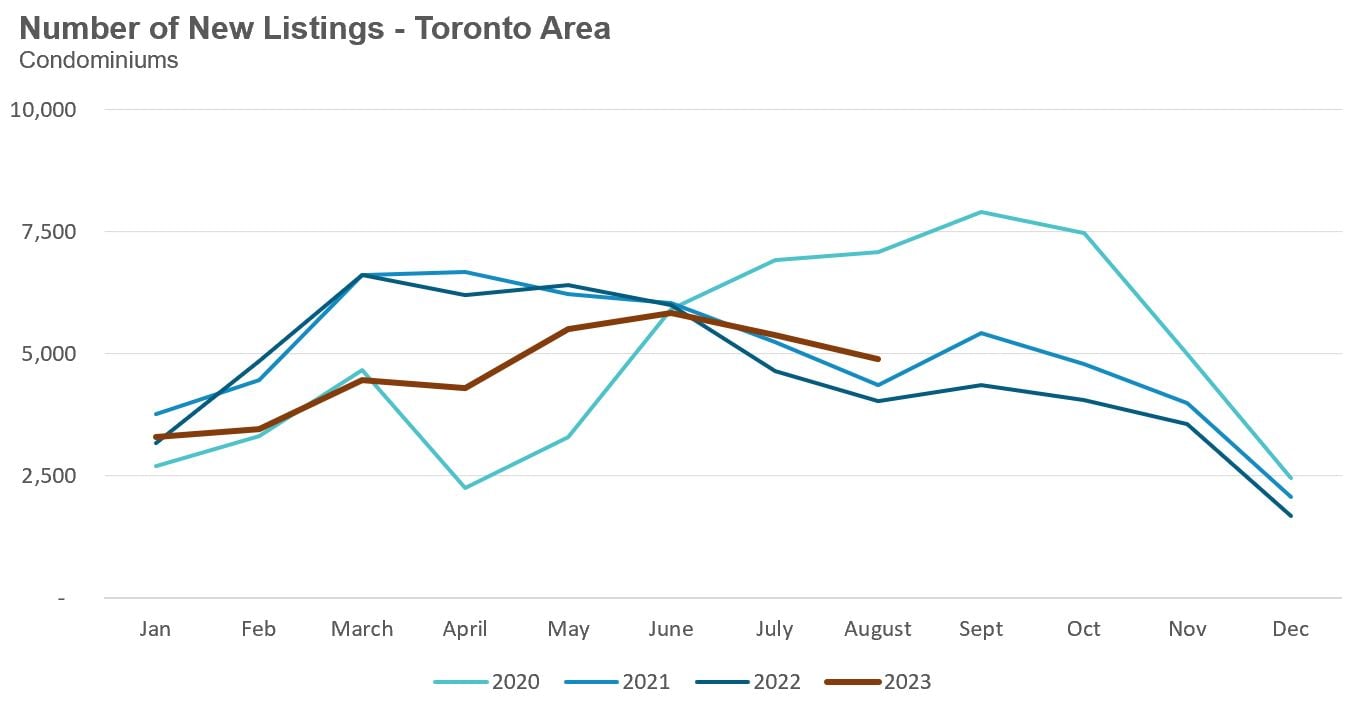
New condo listings were up 22% in August over last year.
The number of condos available for sale at the end of the month, or active listings, was up 25% over last year.
Condo months of inventory increased from 1.6 in May to 3.4 MOI in August, a sign that the condo market is rapidly cooling down.
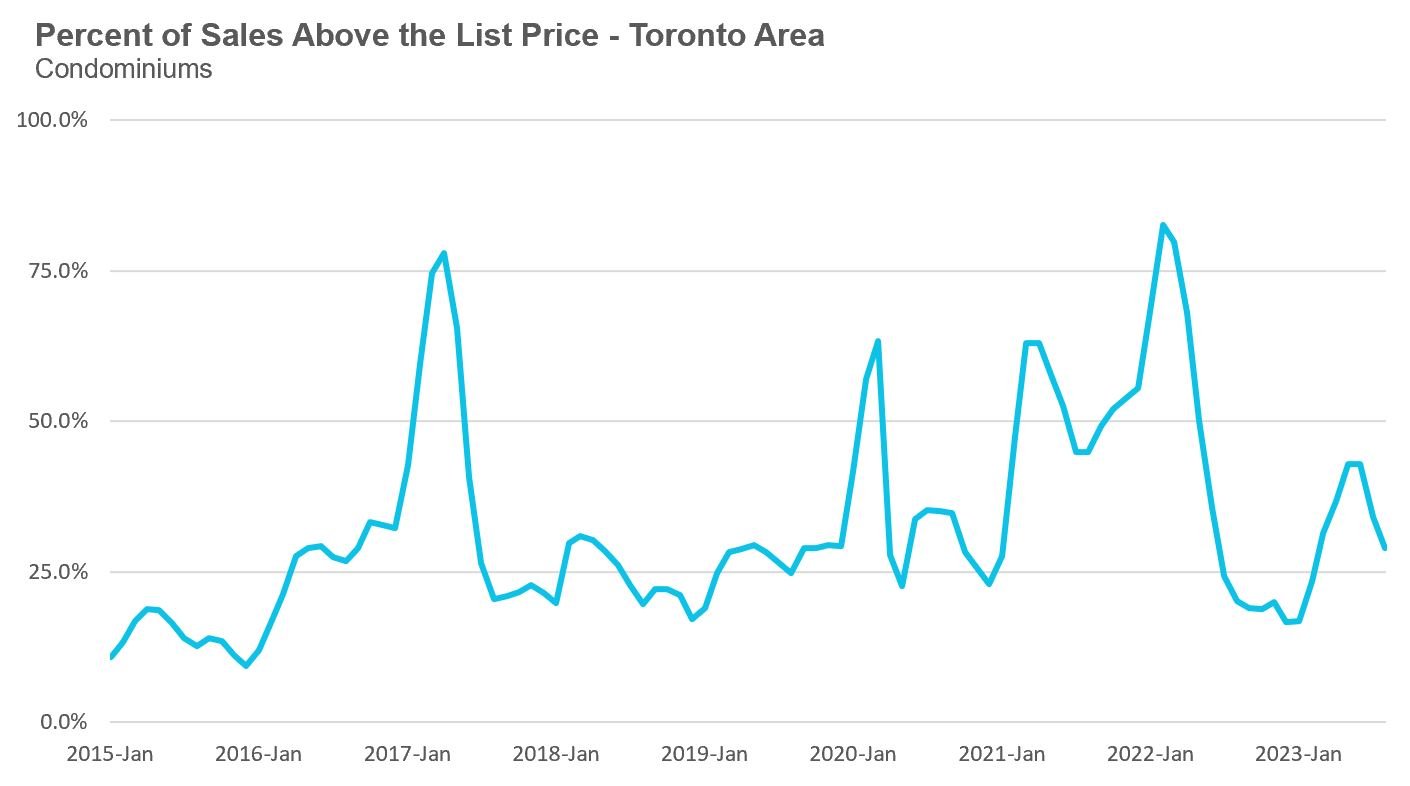
The share of condos selling for over the asking price declined to 29% in August.
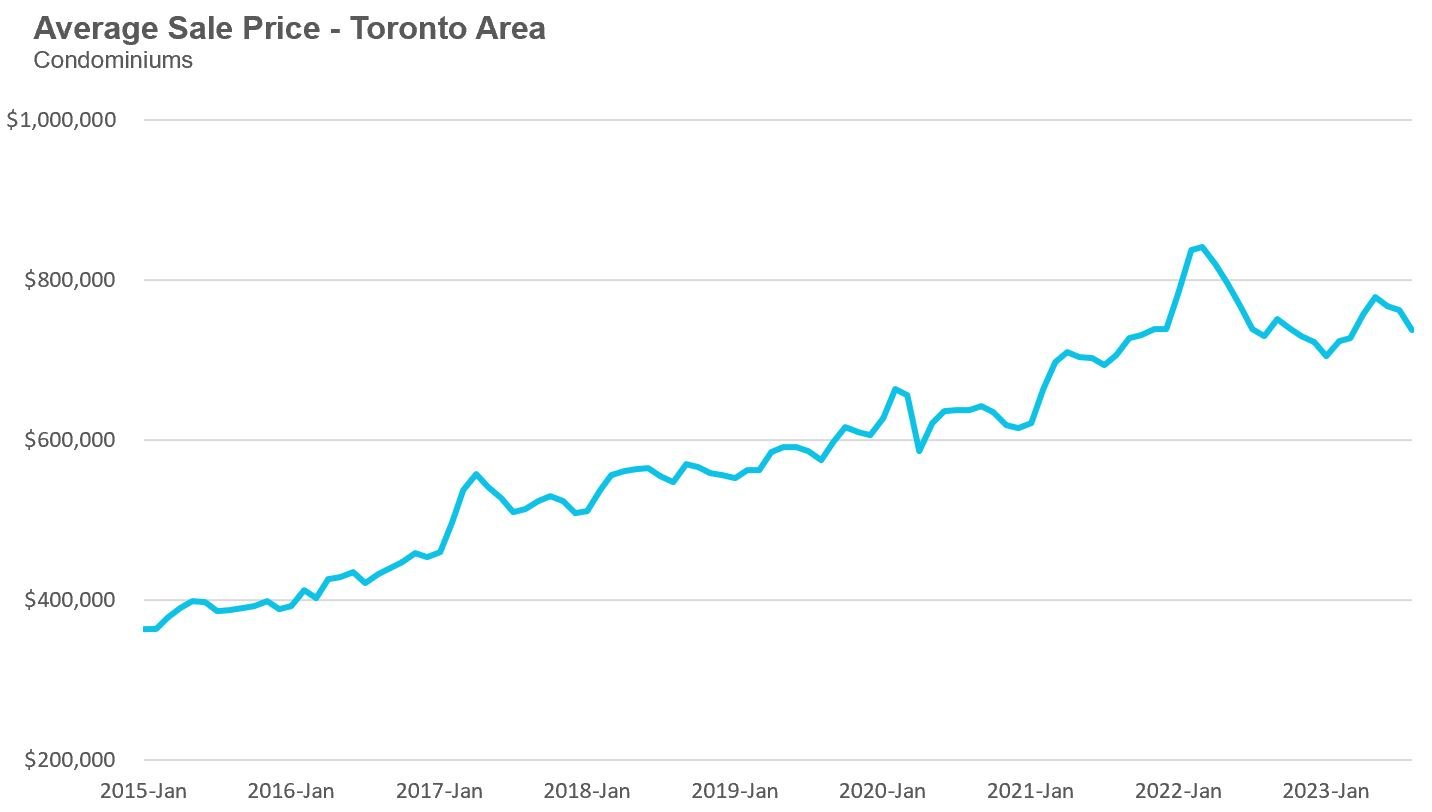
The average price for a condo in August was $737,582, up 1% over last year. The median price for a condo in August was $675,000, unchanged compared to last year.
Houses
Average house prices were up across the GTA last month, while sales were down across all five regions. New listings were up by over 20% in the suburbs, with the City of Toronto seeing a modest increase. The MOI is well above last year’s levels, suggesting the market for houses is cooler this year compared to last year.
Condos
Condo sales were up In Halton, Peel and Toronto last month. Average prices were up slightly across all four suburban regions. New listings are up by double digits across the GTA. The MOI is slightly above last year’s level, suggesting a cooler market.
See Market Performance by Neighbourhood Map, All Toronto and the GTA
Greater Toronto Area Market Trends

