LIVE MARKET UPDATE: WATCH REPORT HIGHLIGHTS & Q/A - THURSDAY MAY 16th 12PM ET

Join John Pasalis, report author, market analyst and President of Realosophy Realty, in a free monthly webinar as he discusses key highlights from this report, with added timely observations about new emerging issues, and answers your questions. A must see for well-informed Toronto area real estate consumers.
WATCH NOW: Delayed Interest Rates Chill Toronto's Spring Real Estate Market
The Bank of Canada’s delayed rate cuts have chilled the mood leading into the spring market when most buyers and sellers expected cuts would have started already.
Home buyers were hoping that a decline in interest rates would lower their mortgage payments and make buying a home a little bit more manageable. Sellers, on the other hand, were expecting rate cuts to drive up the value of their homes as that buyer demand returned.
However, not only has the Bank of Canada not cut interest rates, the markets are now pricing in far fewer cuts in 2024 than was previously expected. Fixed mortgage rates have also remained well above 5%, offering very little financial relief for home buyers.
The number of house sales (excluding condominiums) in April 2024 was 35% below the 10-year average for the month of April. Peel saw the biggest decline from the 10-year average, down 43%.

The number of homes available for sale was up by just 1% from the 10-year average.
But despite the soft sales volume last month, the market for houses remains relatively competitive. Homes that are priced well are selling quickly, many with multiple offers, and it’s not just starter homes that are selling quickly. Higher-end end homes (up to $5M) are also selling relatively quickly if they are priced well.
Where the market for houses is cool due to very slow sales activity, the condo market is feeling a chill due to a surge in the number of active listings.
For the month of April, active condo listings were 56% above the 10-year average, partly due to investors looking to exit the market. The surge in active listings, combined with sales that are 20% below the 10-year average, has kept the condo market far cooler than the market for houses.
Despite the chill, house and condo prices remained flat in April compared to last year. We’ll see how long the chill lasts!
By the Numbers: April 2024
The average price for a house in the Toronto area was $1,417,860 in April, unchanged over the same month last year. Last month's median house price was $1,233,750, down 2% over last year.
House sales in April were down 5% over last year, while new house listings were up 42%.
The number of houses available for sale at the end of the month, or active listings, was up 81% over last year.
The current balance between supply and demand is reflected in the MOI, which is a measure of inventory relative to the number of sales each month.
In April, the MOI for houses increased slightly to 2.2.
The average price for a condo in the Toronto Area was $753,699 in April, unchanged over last year. The median price for a condo in April was $684,000, unchanged over last year.
Condo sales in April were down 7% over last year, and new condo listings were up 56% over last year. The number of active condo listings was up 83% over last year. The MOI increased slightly to 3.3.
WATCH NOW: How Canada's Housing Obsession is Killing Our Economic Productivity
Our fallen productivity is a "national emergency."
Canada’s poor economic productivity has been in the headlines lately, with the Bank of Canada calling it a national emergency.
Today, I will discuss what economic productivity means and what role the housing market might play in Canada’s poor performance.
Statistics Canada defines productivity as “the efficiency with which an economy transforms inputs into outputs”.
The Bank of Canada highlighted three elements that contribute to strong productivity:
A recent report by Alberta Central chief economist Charles St-Arnaud noted that while Canada had the sixth-highest labour productivity out of 32 OECD countries in 1970, it ranks 22nd today.
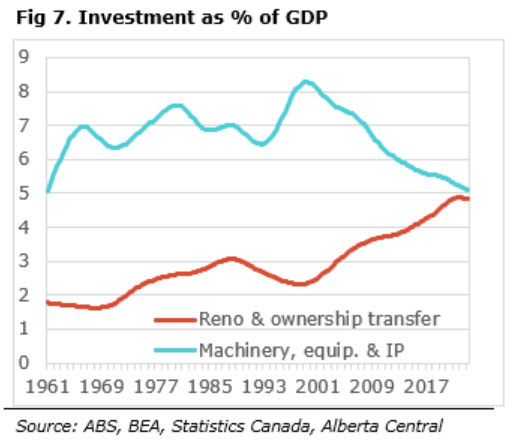
According to St-Arnoud, one of the big reasons why Canada’s labour productivity is falling is that Canadian businesses are investing far less in physical tools and technologies that would make their labour force more efficient. Since 2000, the share of Canada’s GDP spent on machinery, equipment, and IP has declined, while the share of residential investment in renovations and transfer costs has increased and is now nearly identical.
St-Arnoud argues that one of the significant drivers behind this change is the supply of credit from financial institutions. Lenders are willing to lend to borrowers who offer the greatest risk-adjusted return on their capital.
Over the past twenty years, residential mortgages have proven to be a relatively low-risk investment for banks compared to commercial debt, not only because mortgage default rates in Canada are extremely low but also because the collateral on mortgage debt (the value of each home) has appreciated over time. This, coupled with higher capital requirements for corporate lending, has made corporate debt considerably more expensive, contributing to the decline in corporate lending.
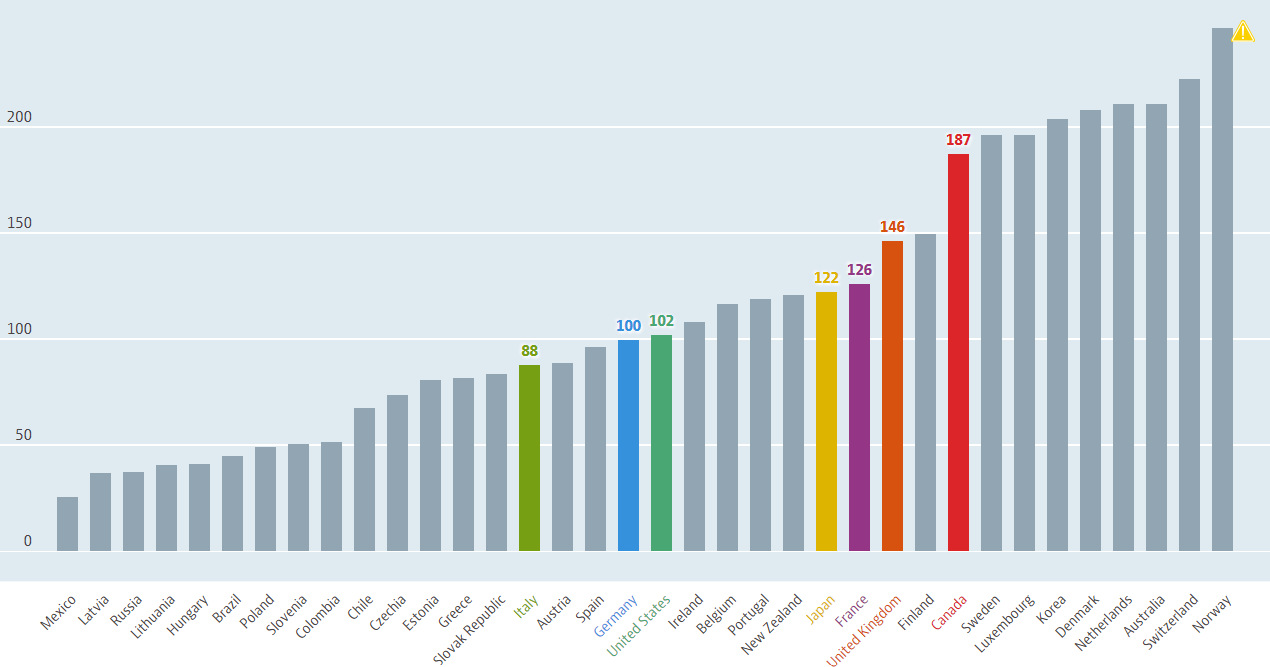
While households were net savers in Canada from the 1960s to 2000, they have since become net borrowers, contributing to Canada’s rapid increase in household debt relative to income and GDP.
Household Debt - Total, % of net disposable income, 2022 or latest available
Source: OECD
According to St. Arnoud, the solution to Canada’s productivity problems requires two important policy responses: incentives to increase lending to corporations and incentives to encourage households to save more and borrow less.
Unfortunately, converting a nation that has become addicted to using its home equity as an ATM to finance renovations, investments, and lifestyles is easier said than done. Converting households to net savers rather than borrowers can only be achieved by making it harder for homeowners to borrow against their home equity, which banks and policymakers are in no rush to do.
House sales (low-rise freehold detached, semi-detached, townhouse, etc.) in the Greater Toronto Area (GTA) in April 2024 were down 5% compared to the same month last year.

New house listings in April were up 42% compared to last year.

The number of houses available for sale (“active listings”) was up 81% in April compared to the same month last year.

The Months of Inventory ratio (MOI) looks at the number of homes available for sale in a given month divided by the number of homes sold in that month. It answers the following question: If no more homes came on the market for sale, how long would it take for all the existing homes on the market to sell, given the current level of demand? The higher the MOI, the cooler the market is. A balanced market (a market where prices are neither rising nor falling) is one where MOI is between four to six months. The lower the MOI, the more rapidly we would expect prices to rise.
While the current level of MOI gives us clues into how competitive the market is on-the-ground today, the direction it is moving in also gives us some clues into where the market may be heading.
The MOI for houses increased slightly to 2.2 in April.

The share of houses selling for more than the owner’s list price decreased to 50% in April.

The average price for a house in April was $1,417,860 in April 2024, unchanged compared to the same month last year.

The median house price in April was $1,233,750, down 2% over last year.
The median is calculated by ordering all the sale prices in a given month and then selecting the price at the midpoint of that list such that half of all home sales are above that price and half are below that price. Economists often prefer the median price over the average because it is less sensitive to big increases in the sale of high-end or low-end homes in a given month, which can skew the average price.
Condo (condominiums, including condo apartments, condo townhouses, etc.) sales in the Toronto area in April 2024 were down 7% compared to the same month last year.

New condo listings were up 56% in April over last year.

The number of condos available for sale at the end of the month, or active listings, was up 83% over last year.

Condo months of inventory increased slightly to 3.3 MOI in April.

The share of condos selling for over the asking price decreased to 26% in April.

The average price of a condo in April was $753,699, unchanged from last year. The median price was $684,000, unchanged from last year.

Houses
The four suburban regions saw sales decline over last year. Halton saw average prices increase by 4%, while all other regions saw very little change in average prices. All five regions saw significant increases in new listings in April, while the MOI was above last year.

Condos
Condo sales were down in Durham, Peel and Toronto in April. Average prices were down 4% in Peel but relatively unchanged in the other four regions. New listings and MOI were well above last year’s level for all regions.

See Market Performance by Neighbourhood Map, All Toronto and the GTA
Greater Toronto Area Market Trends