.jpg?width=375&name=CoverImage-Aug2021.Simple(2).jpg "CoverImage-Aug2021.Simple(2)")

““When politicians used to talk about housing they also spoke about immigration levels. What changed?””
- Howard Anglin
Toronto's condominium (condo) rental market, characterized by an unprecedented drop in demand due to the onset of the Covid-19 pandemic in March 2020, has been showing signs of rebounding strength since the end of 2020 - and now has been red hot over the past couple of months.
Back in January 2020, I posted on Twitter that we were seeing signs of strength in the condo rental market. This was based on actual rental data and on anecdotal accounts of demand including those of our own clients looking for rentals and from the number of tenant applications we were receiving when represented rental owners looking to rent their units.
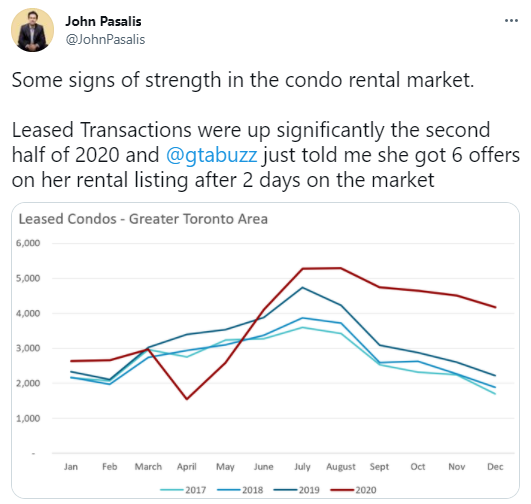
While the number of rental transactions were quite high towards the end of 2020, so were the number of new listings making it difficult to determine just how competitive the market was and whether the market was heating up or cooling down. .
But the key trends moving into 2021 was that the number of leased transactions relative to new listings was trending up and the months of inventory (MOI) was trending down, suggesting declining relative supply - both signs that suggested the condo rental market was heating up.
And that is precisely what happened.
The charts below are for condominium rentals in the City of Toronto only and do not include condo rentals elsewhere in the GTA (the City of Toronto accounts for roughly 80% of the condominium rentals in the GTA).
We can see below that the number of leased condo units has remained at a historically high level since the second half of 2020.
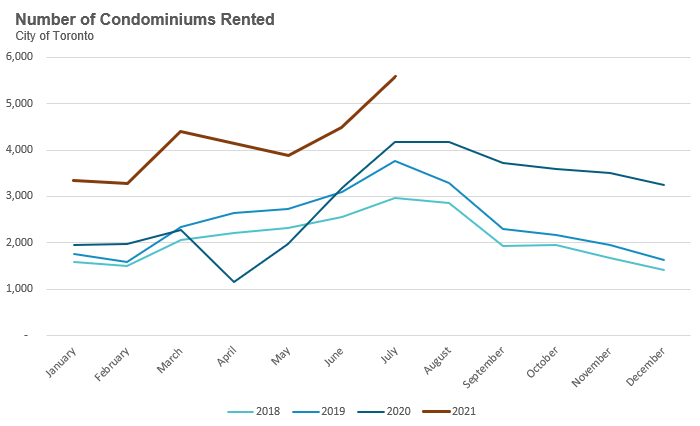
What’s behind this demand?
In the second half of 2020, some of these leased transactions were from existing tenants who were taking advantage of declining rents to either upsize to a nicer unit (often for the same price they were paying in their existing unit) or to move laterally to a similar unit for a lower monthly rent if their current landlord wasn’t open to reducing their rent in the wake of the pandemic-induced sudden drop in demand for rentals.
But we were also seeing a return in demand from tenants for traditional reasons including a) moving out of parental homes b) moving out of shared accommodation and c) moving closer to downtown Toronto. The decline in rental prices we saw in 2020 likely made some of these moves possible.
But over the past 4-8 weeks, we have been seeing renewed additional demand from students who plan to attend their university/college classes in person once again this fall.
When looking at the number of new rental listings coming onto the market,
we can see that rental listings are down year-over-year, but are up significantly above the listing volumes in 2018 and 2019.
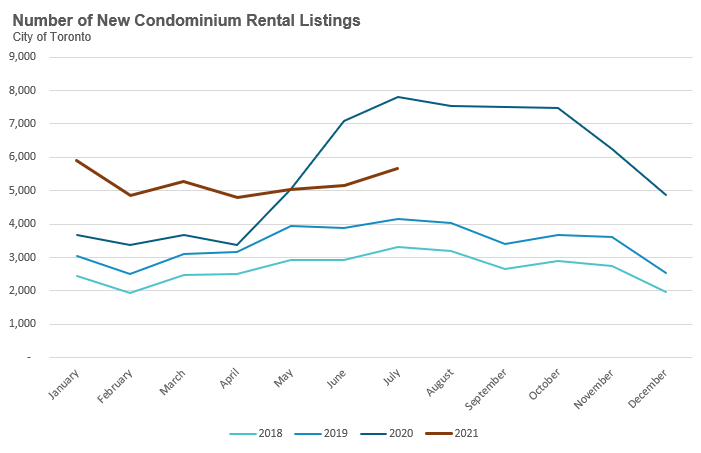
The year-over-year decline in new listings is due to the fact that condo rental listings surged just after the initial COVID lockdowns in March 2020 as tenants moved out of the city.
But as I mentioned earlier, the more important trend was that the ratio of leased condos vs. new condo rental listings was trending up since the second half of 2020, suggesting that demand for condo rentals was starting to outpace the supply of new listings. 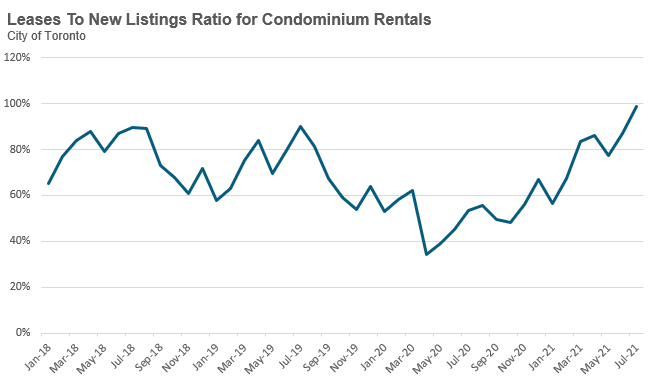
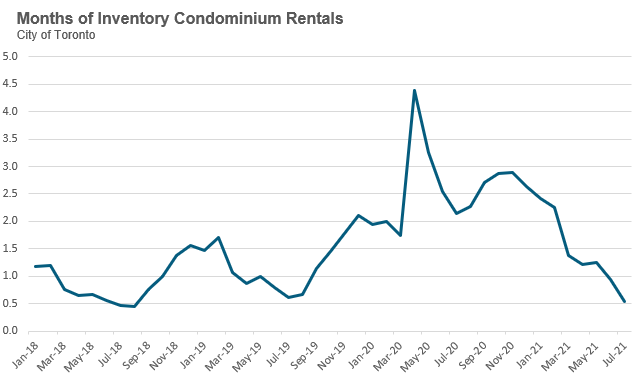
Despite that, inventory levels for condo rentals remained stubbornly high until November 2020 when they peaked at just under 3 MOI before beginning to trend down. In July 2021, there was just 0.5 MOI - a sign of a very competitive market.
This tightly supplied market means we have started to see more tenants competing for the same rental unit, leading some tenants to offer a price that is above the landlord’s asking price. When we look at the percentage of rental units that were leased for more than their asking price, we can see this surge from 6% in March 2021 to 24% in July.
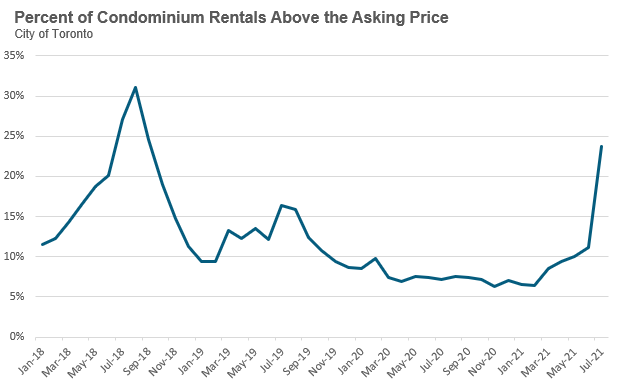
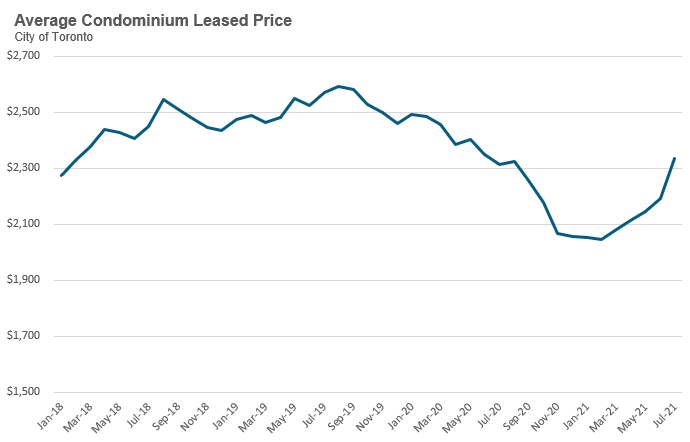
This has also pushed average rent prices up from $2,045 in February to $2,334 in July.
As we move into the fall market, a decline in demand from students should take some of the heat out of the competitive condo rental market.
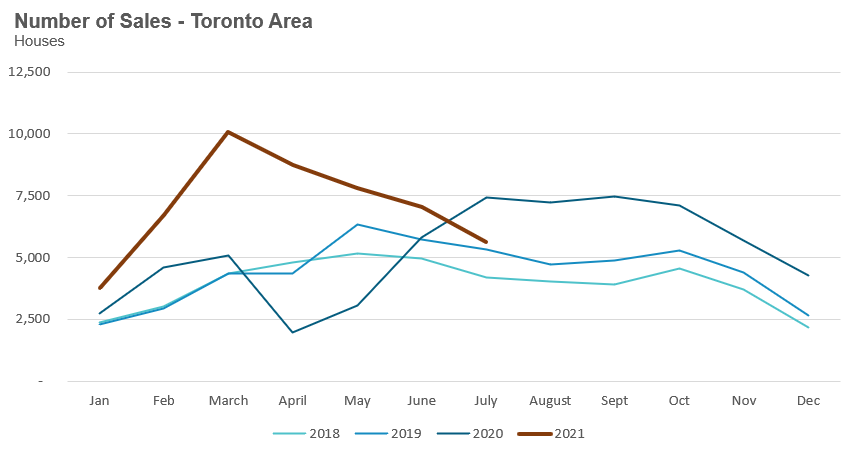
House sales (detached, semi-detached, townhouse, etc.) in the Toronto area in July 2021 were down 24% over the same month last year.
Sales will likely continue to be negative on a year-over-year basis until at least the first quarter of 2022, since we’ll be comparing against a period that saw a sudden shock in demand for houses following the initial COVID lockdowns. But it’s worth noting that sales in July were above levels for the same month in 2018 and 2019.
New listings in July were down 37% over last year, and much like the sales numbers, new listings are also showing a month-over-month decline since March. But unlike the sales figures, new listings in July were well below the listings volume seen in 2018 and 2019.
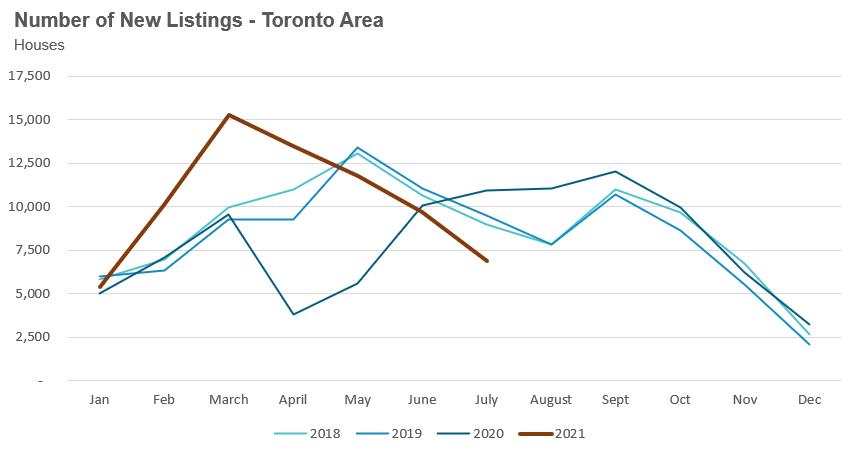
What’s behind the decline in new listings we’ve been seeing recently?
I suspect there are two primary factors driving this. Firstly, with the provincial Ontario government easing lockdown restrictions this summer, many households are in vacation mode and in no rush to spend more time in their home to get it ready for sale. Many of these homeowners are pushing off their sales to the fall.
The other key factor that might be driving this is a desire from many home- owners to not sell their current home when upsizing or downsizing to another property. Real estate has been a strong performing asset over the past twenty years and with interest rates below 2% homeowners are motivated to hold on to their properties if they have the financial means to do so.
Our brokerage is in the process of quantifying these investors to better understand their impact on the housing market.
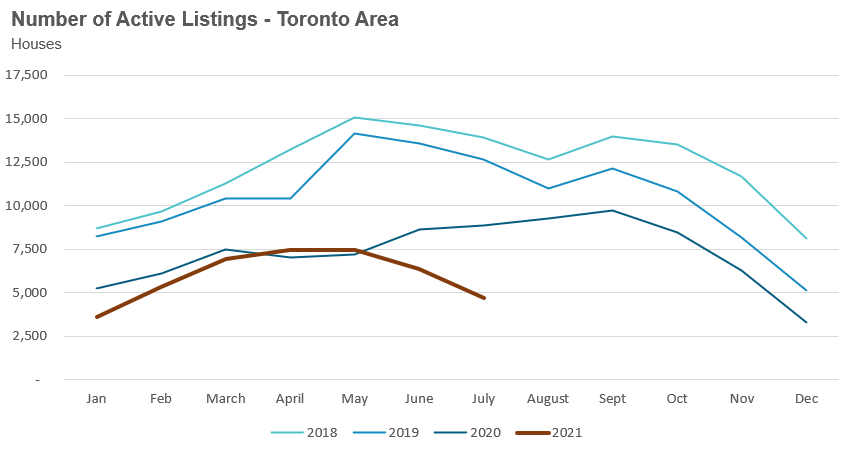
The number of houses available for sale (“active listings”) was down 47% when compared to the same month last year and 63% below the inventory levels seen in 2019.
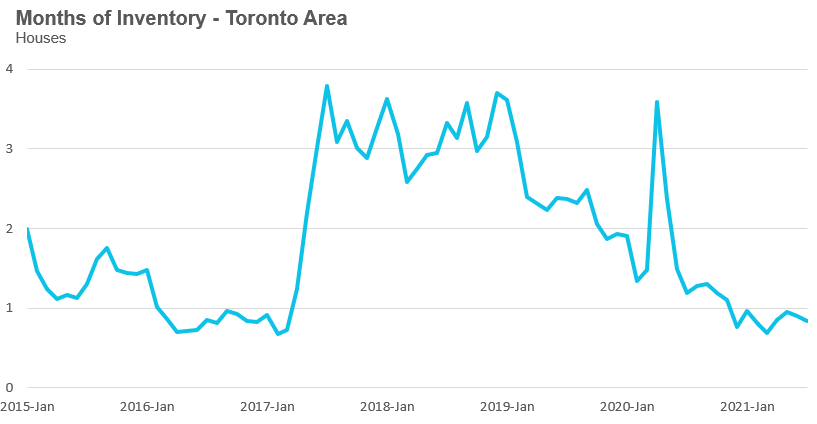
The Months of Inventory ratio (MOI) looks at the number of homes available for sale in a given month divided by the number of homes that sold in that month. It answers the following question: If no more homes came on the market for sale, how long would it take for all the existing homes on the market to sell given the current level of demand?
The higher the MOI, the cooler the market is. A balanced market (a market where prices are neither rising nor falling) is one where MOI is between four to six months. The lower the MOI, the more rapidly we would expect prices to rise.
This July, the market remained very competitive with an MOI of just under 1.
While the current level of MOI gives us clues into how competitive the market is on the ground today, the direction it is moving in also gives us some clues into where the market may be heading. The MOI has remained relatively stable at or below 1 MOI for the past nine months.
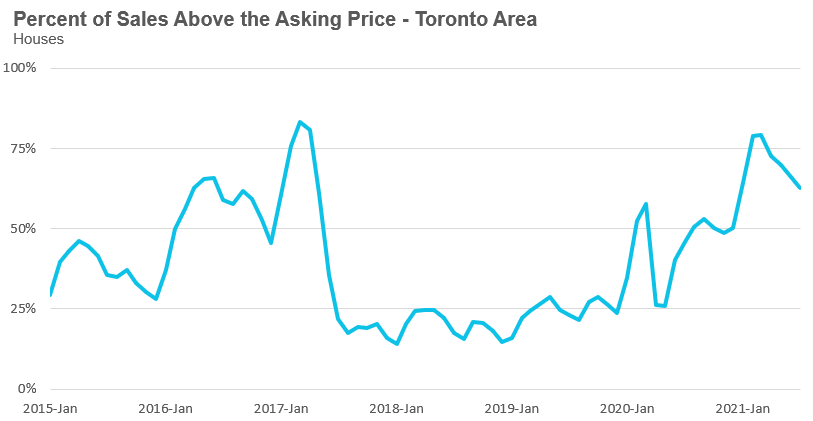
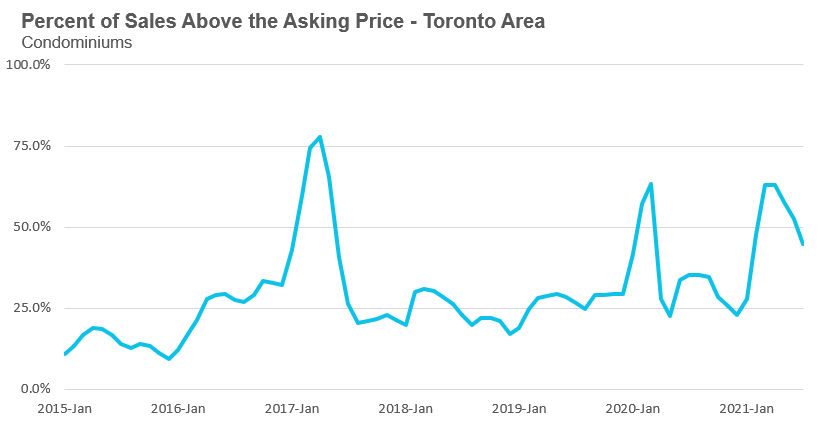
The share of houses selling for more than the owner’s asking price dropped from 79% in March to 63% in July.
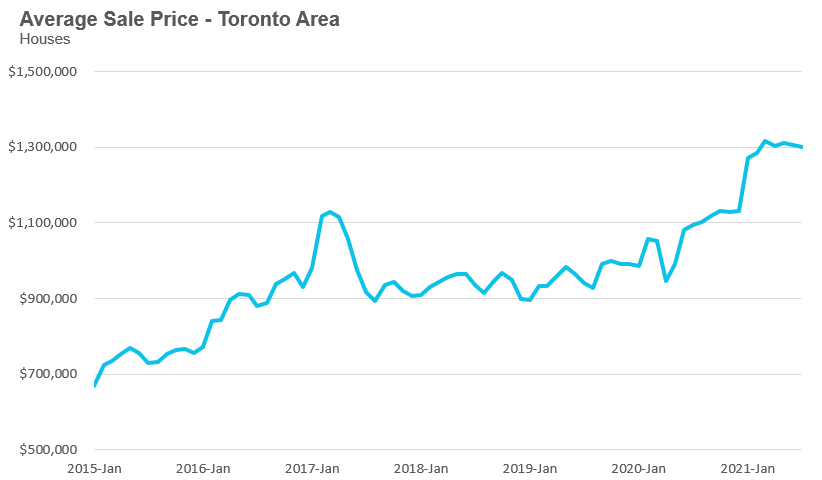
The average house price in July was $1,300,701 while the median was $1,144,000, up 19% and 24% respectively over last year.
While average house prices are up significantly over last year, house prices have plateaued in 2021 with average prices remaining relatively constant in the $1.3M range since the start of the year.
Condo (condominiums, including condo apartments, condo townhouses, etc.) sales in the Toronto area in July were up by 1% over last year and above volumes in 2018 and 2019.

New condo listings were down by 24% in July 2021 over last year but well above the volumes in 2018 and 2019.
The number of condos available for sale at the end of the month, or active listings, was down 28% over last year, a period that saw a surge in condo listings due to declining prices, falling rents and rising vacancy rates.
The relatively strong demand of new listings (supply) helped keep the MOI at 1.4 for the month of July, up from 0.8 MOI in March.
The competition for condos is easing slightly with the share of condos selling for over the asking price falling from 63% in April to 45% in July.
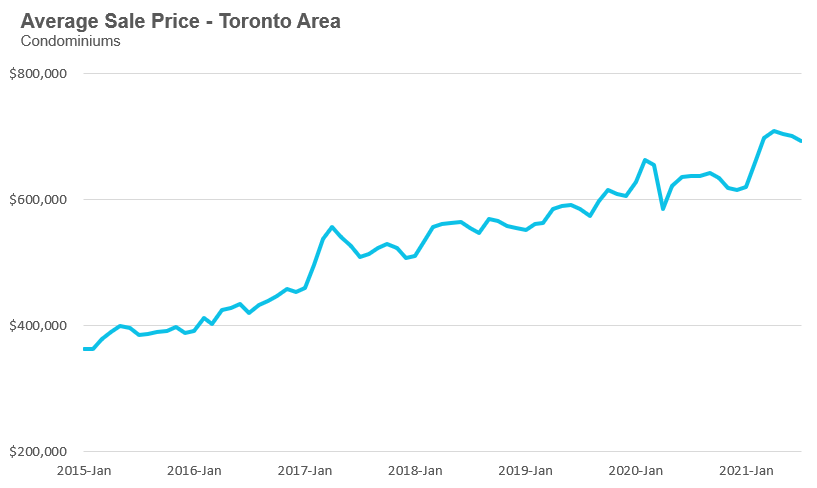
The average condo price in July was $693,440 while the median was $642,000, up 9% and 10% respectively over last year.
Average condo prices were in the low $600K range during the fourth quarter of 2020 and after a rapid acceleration during the first quarter of 2021 to approximately $700K, now appear to be plateauing.
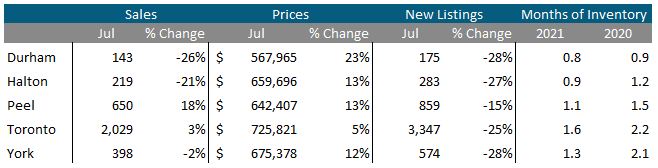
Sales across all five regions in the GTA were down in July while average prices were up on a year-over-year basis. The decline in new listings helped keep the market competitive with MOI at or below 1 across the entire GTA, indicating a strong seller’s market.
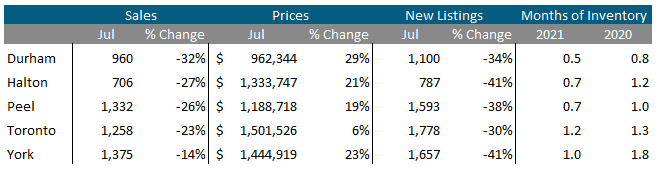
Toronto and Peel saw condo sales up on a year-over-year basis while the other regions saw a decline in sales. Average prices were up double digits across the suburban regions and up by 5% in the City of Toronto. Also indicative of strong market conditions, current MOI levels are below last year’s levels for all five regions.
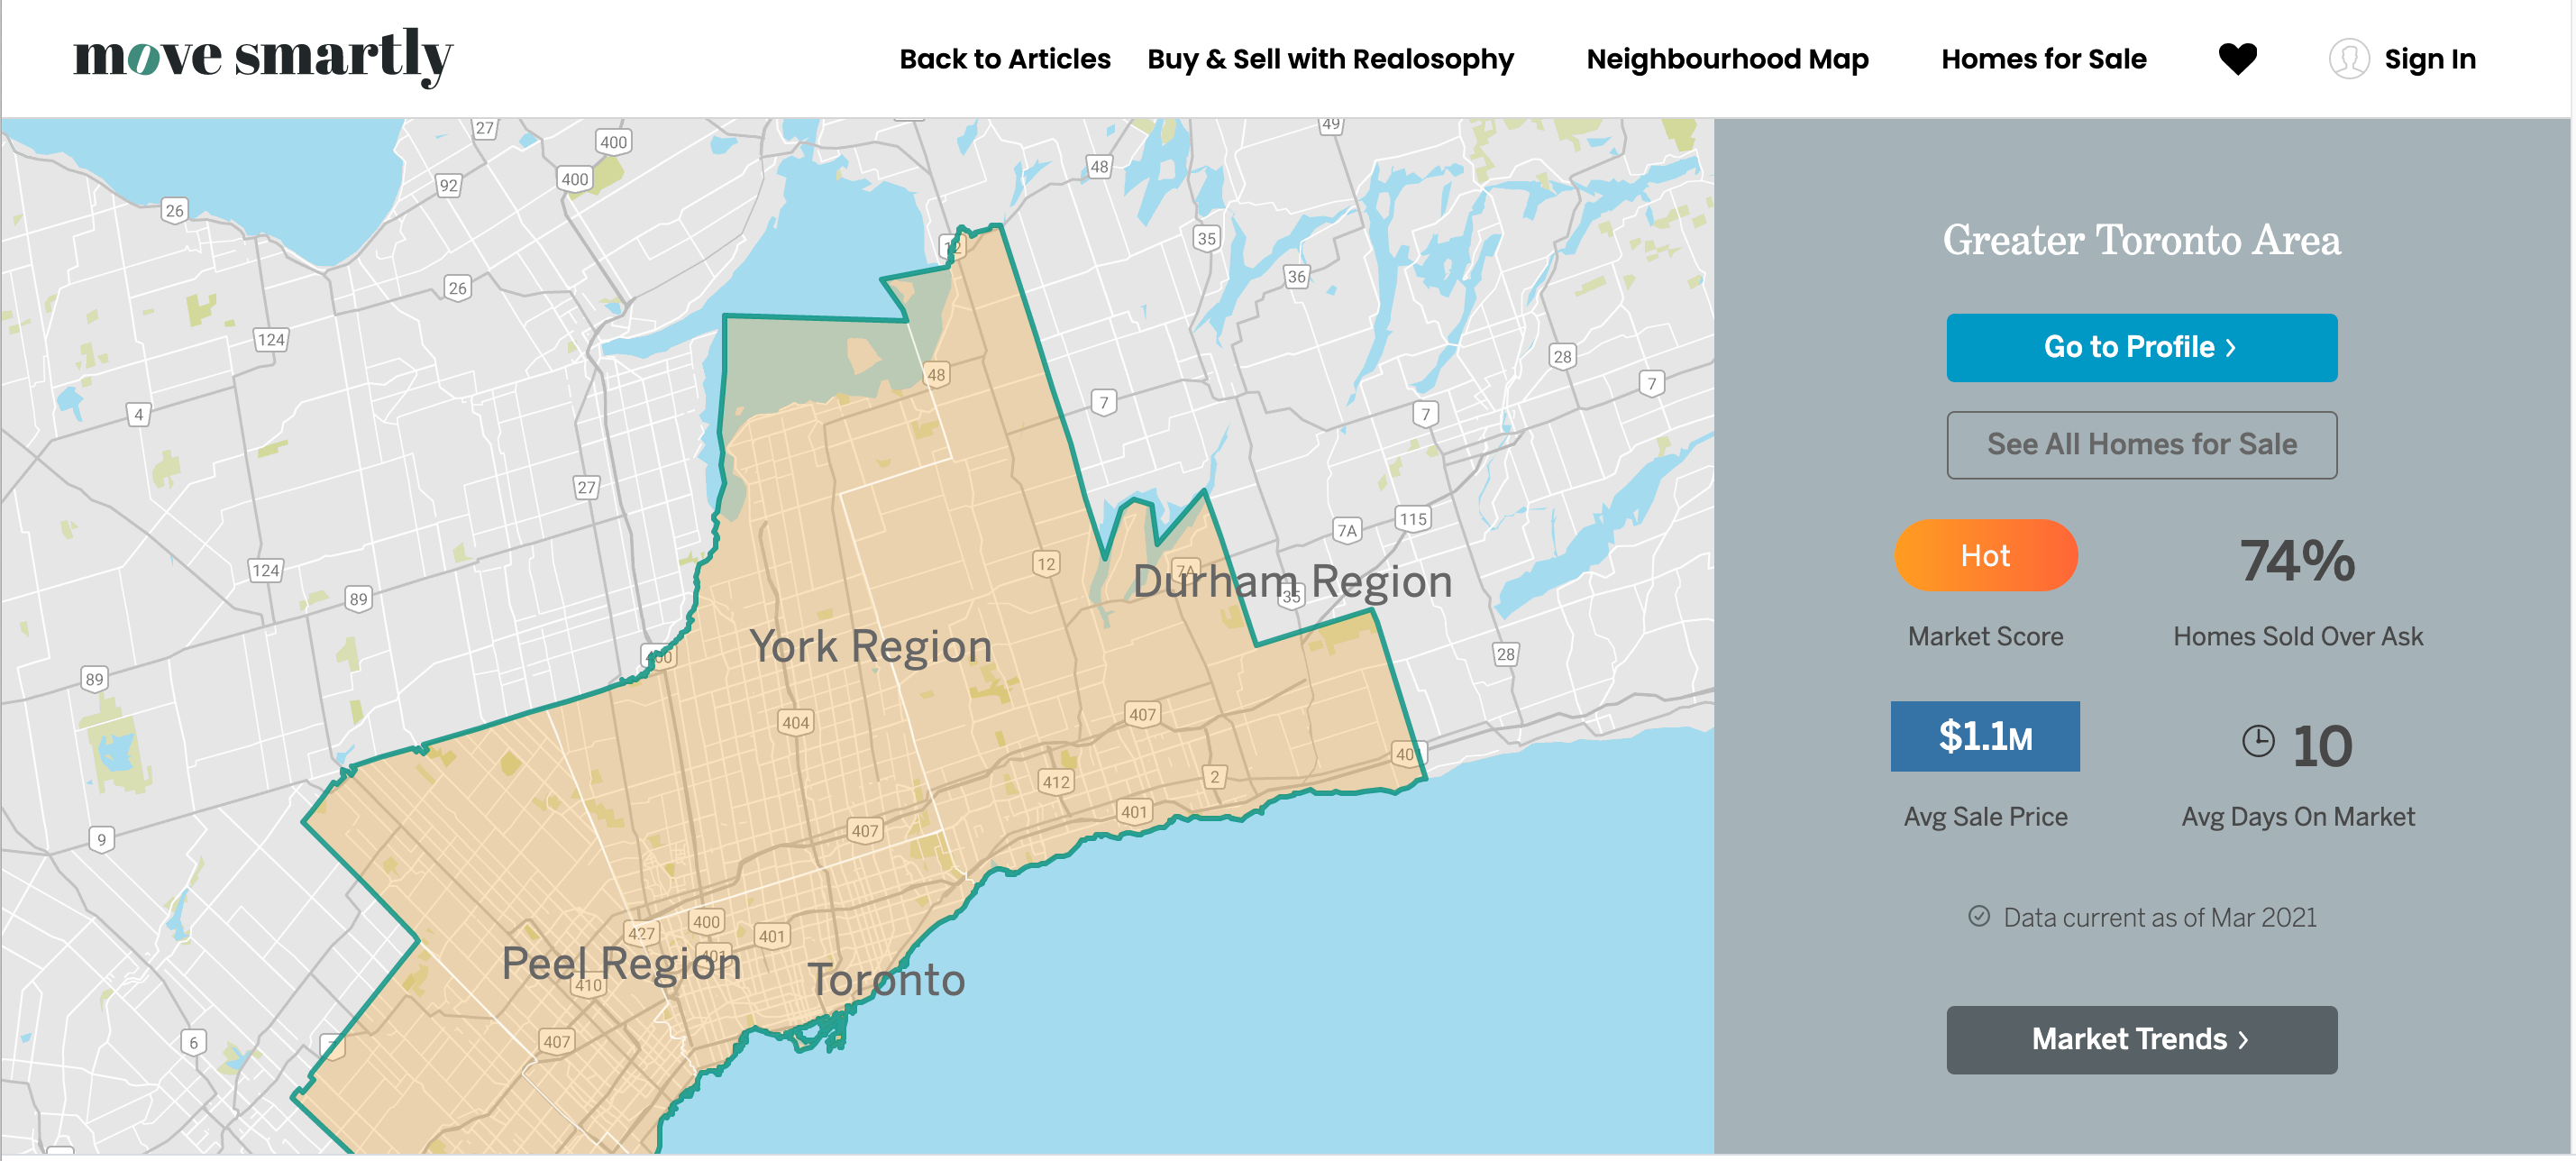
Greater Toronto Area Market Trends
All Market Performance by Neighbourhood Map, Toronto and the GTA
GET MORE DATA
The Move Smartly monthly market report is powered by Realosophy Realty. Get the same up-to-date Toronto area market information on realosophy.com plus additional information on every home for sale, including building permit history, environmental alerts and more when you buy a home with Realosophy Realty.
.jpg?width=375&name=CoverImage-Aug2021(2).jpg "CoverImage-Aug2021(2)")