FREE PUBLIC WEBINAR: WATCH REPORT HIGHLIGHTS - THUS AUG 18th 12PM ET
.png?width=600&name=Public%20Webinar%20%E2%80%93%20July%202022_MoveSmartly_%20600x300%20(1).png)
Join John Pasalis, report author, market analyst and President of Realosophy Realty, in a free monthly webinar as he discusses key highlights from this report, with added timely observations about new emerging issues, and answers your questions. A must see for well-informed Toronto area real estate consumers.
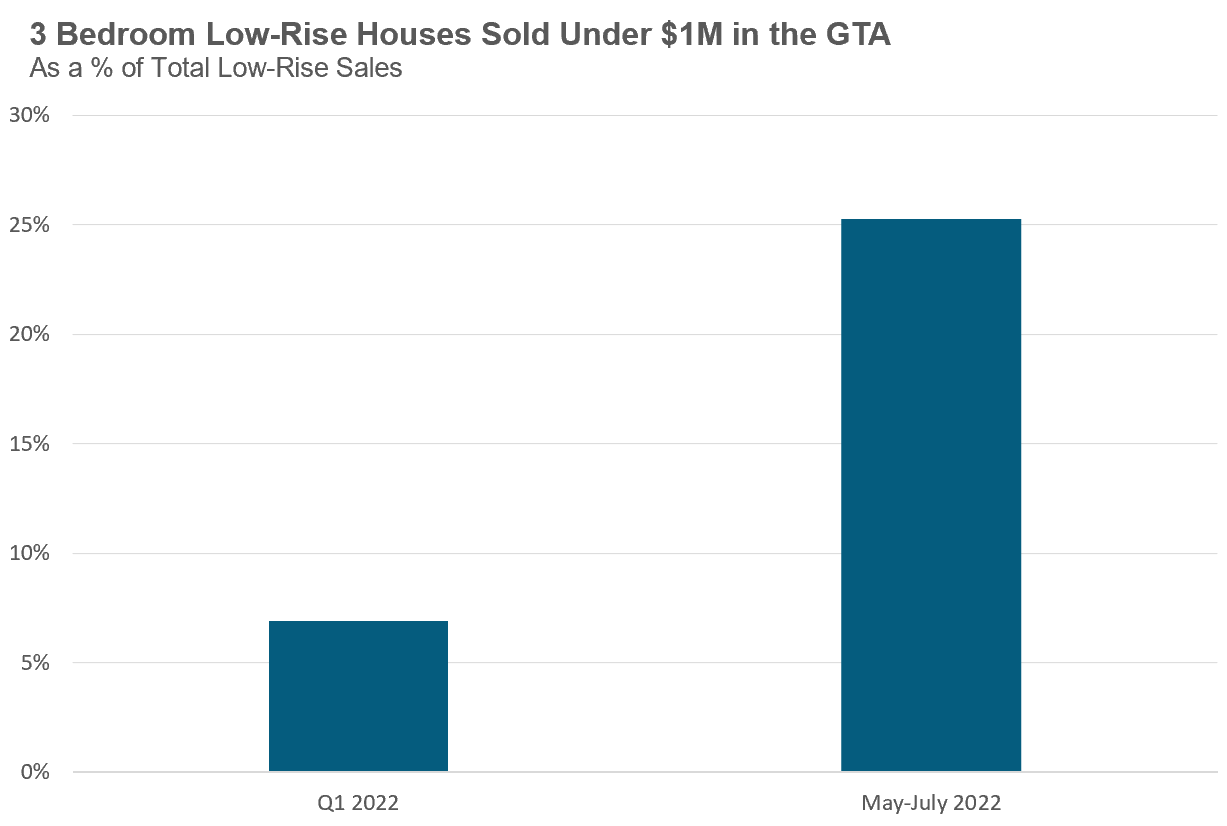
In Canada, homes that sell for over $1 million require a minimum 20% down payment while homes selling for under this amount can be purchased with as little as 5% down — and it’s this difference that makes the $1M threshold an important one for most first-time buyers.
During the first quarter of 2022, first-time buyers looking for a 3-bedroom family low-rise house for under $1M had very few options as these houses made up just 7% of all low-rise house sales. Over the past three months, these houses have now come to account for 25% of all sales.
The table below shows the number of 3-bedroom low-rise houses that sold during the first quarter compared to the number of sales over the most recent previous three months, sorted by the municipalities seeing the biggest % change in sales in this category.
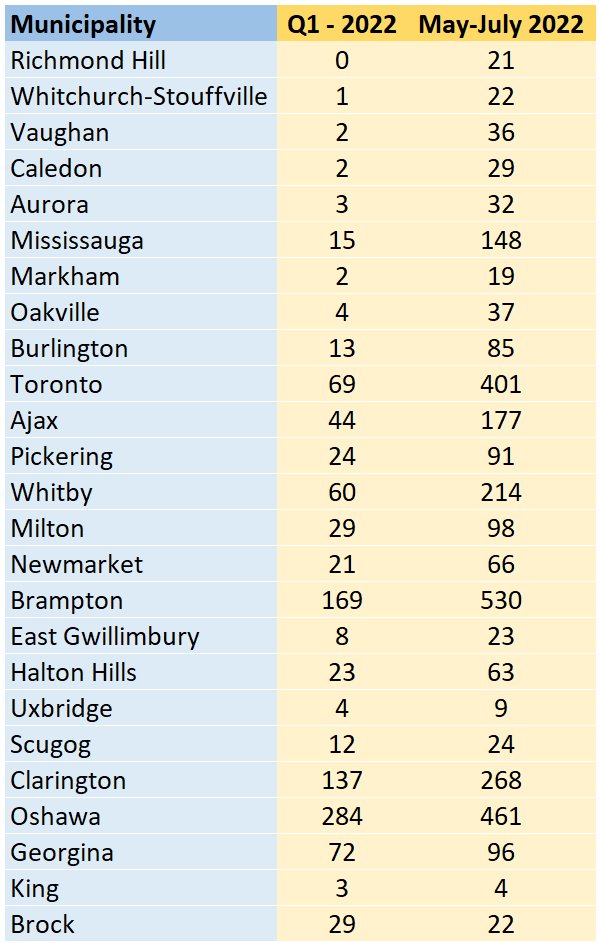
This significant increase in the share of house sales under $1M means that many families who were priced out of buying a ‘starter home’ just a few months ago due to limits to their down payment (and/or income) are finding more options in today’s market, particularly in areas showing the most change (as seen in the table above).
However, these falling prices have come with a cost — today’s home buyers find themselves paying a much higher interest rate on their mortgage which imposes a budgetary limit on their home buying costs as their monthly payments rise.
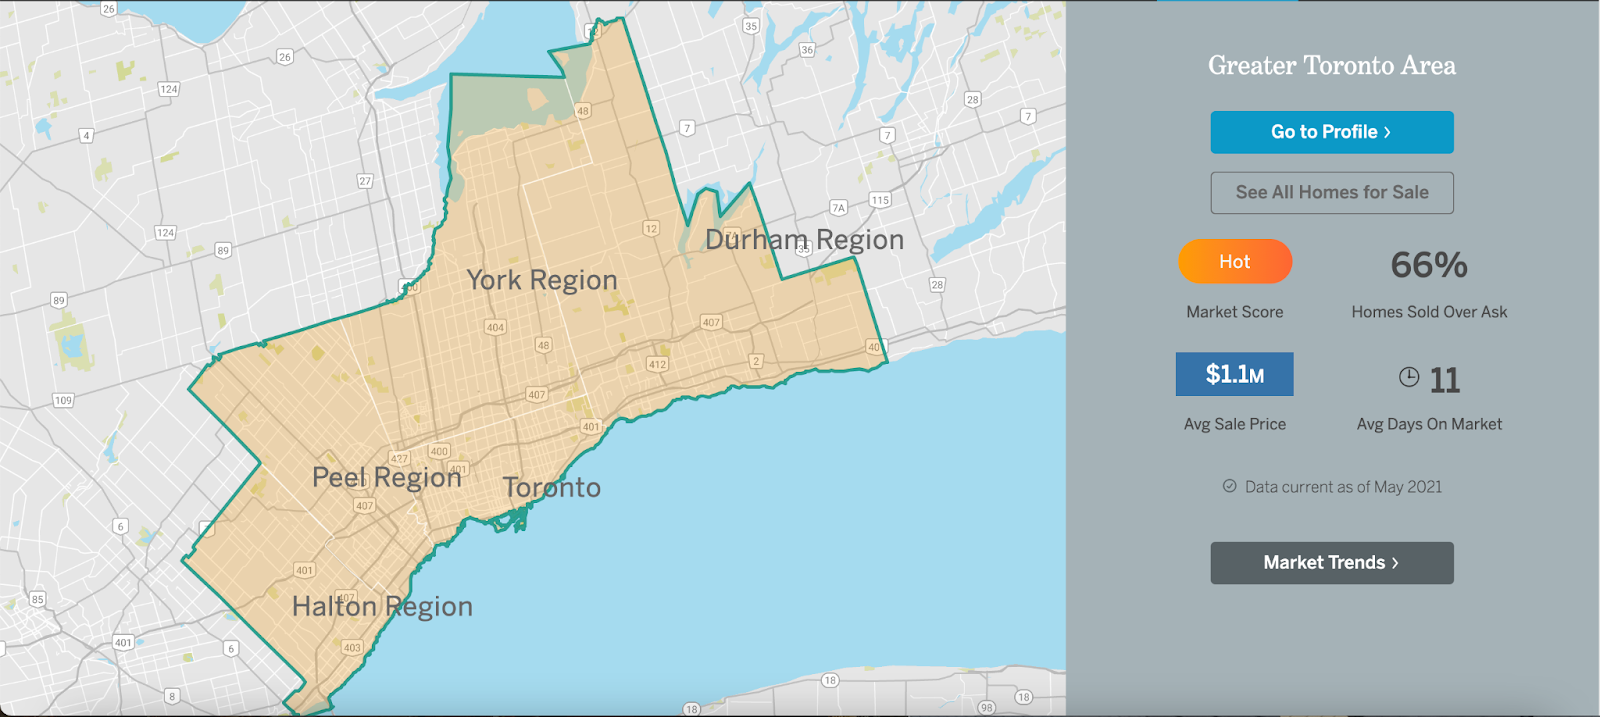
As discussed in this and my past few reports, Greater Toronto Area (GTA) low-rise house prices have seen a sudden and dramatic decline in prices since peaking earlier this year in February 2022.
In this month’s data dive, we will take a closer look at how much median house prices are down across each of the municipalities in the Greater Toronto Area.
The reason I’m looking at median prices for this investigation is because average prices sometimes lead to overly dramatic headlines, such as this one for King City earlier this month. Focusing on median prices allows us to measure the price changes in a way that is more indicative of actual market trends.
As I state in our Monthly Statistic section at the end of each report, the median price is calculated by ordering all the sale prices in a given month and then selecting the price that is in the midpoint of that list such that half of all home sales were above that price and half are below that price. Economists often prefer the median price over the average because it is less sensitive to big increases in the sale of high-end or low-end homes in a given month which can skew the average price.
Before looking at the municipalities that have been hardest hit over the past five months, I thought it would be helpful to first look back to see which municipalities saw the biggest rise in house prices during the COVID-19 pandemic period.
Since February 2020 was the last full month of home sales before the province of Ontario introduced their first COVID-19 related lockdown, this month was used as the median pre-COVID house price for each municipality. Prices in the GTA peaked in February 2022 (and condos prices in March 2022), making the COVID housing boom period exactly two years.
The table below shows the two-year appreciation in median house prices for the municipalities in the Greater Toronto Area.
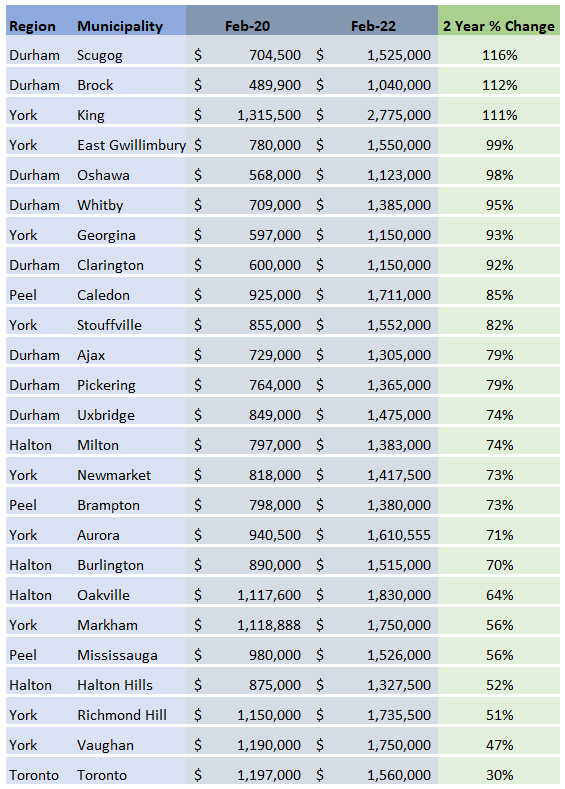
It’s worth noting that the three municipalities with the highest price appreciation typically have relatively few sales in any given month (15 to 30 sales each month), which can skew even the median. That being said, the trend is clear that many municipalities saw house prices roughly double in just two years with the worst performing suburban municipalities still showing a roughly 50% increase in prices over two years; notably, the City of Toronto saw prices rise 30% over the two years, well below the price growth seen in the suburbs.
The chart below shows the dollar and percentage decline in median house prices since the peak in February 2022. Note that many of the regions that saw the most rapid increase in prices (in the table above) are seeing the biggest decline in price in this table below.
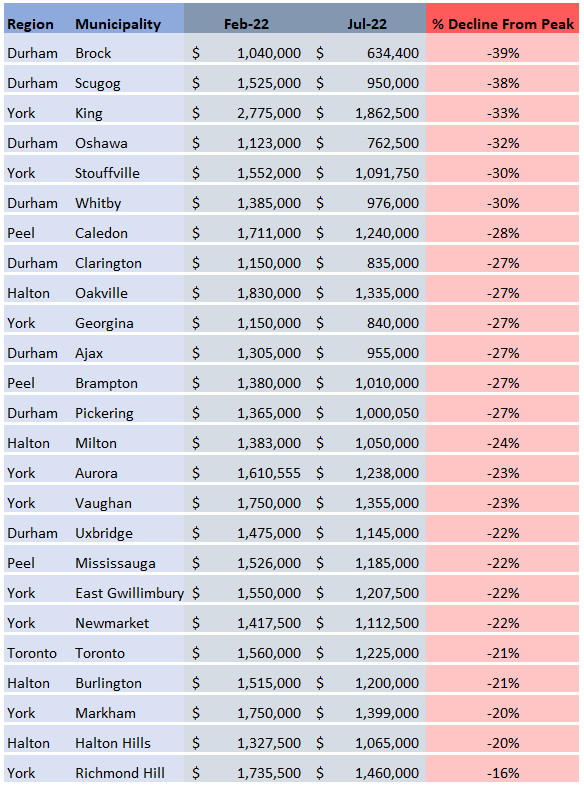
If we look to see which municipalities have median house prices today that are closest to their pre-COVID level, there’s only one municipality that stands out — the City of Toronto.
Median house prices in the City of Toronto in July of this year were just $28,000 above their pre-COVID level in February 2020. Even though the City of Toronto’s 21% decline in median prices was among the lowest in the GTA, the 21% decline set prices back to just above their pre-COVID level because the city had the lowest rate of appreciation of all the municipalities during the COVID boom (as discussed in the ‘In the Ground’ section in this report).
The following charts compare the median house price for each municipality in February 2020 (pre-COVID), February 2022 (the Covid-boom market peak) and last month.
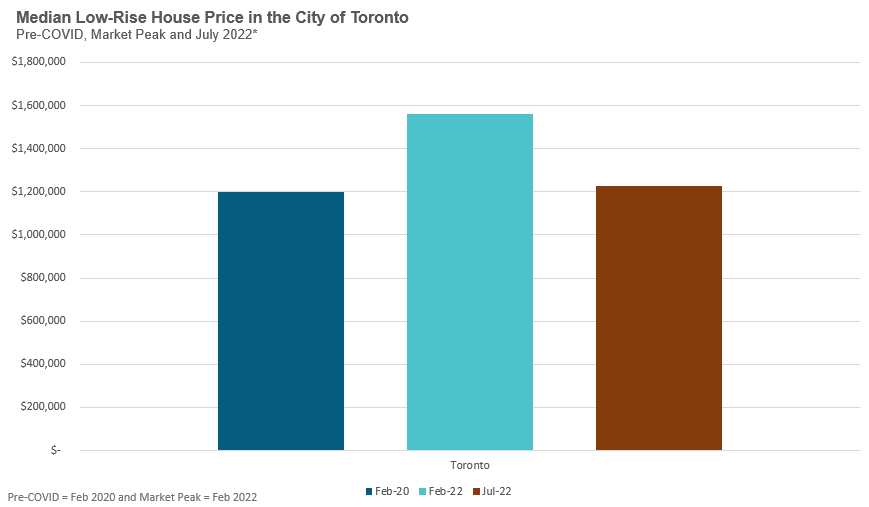
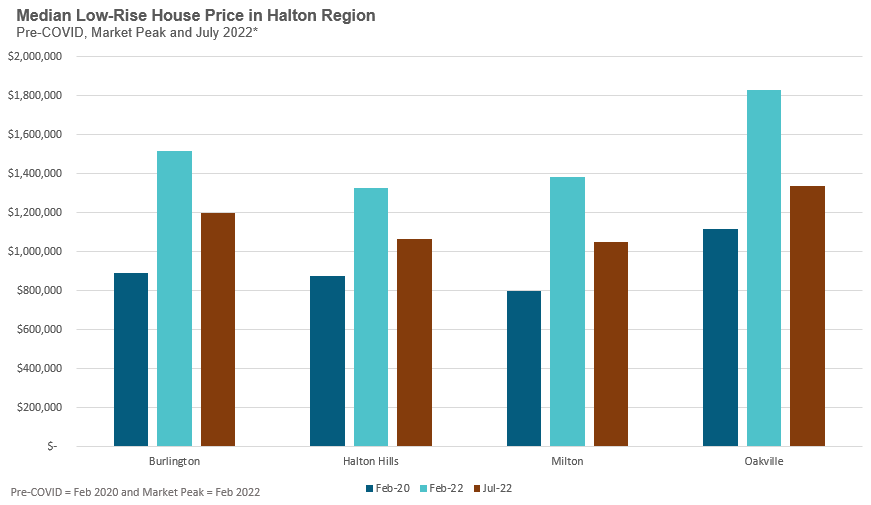
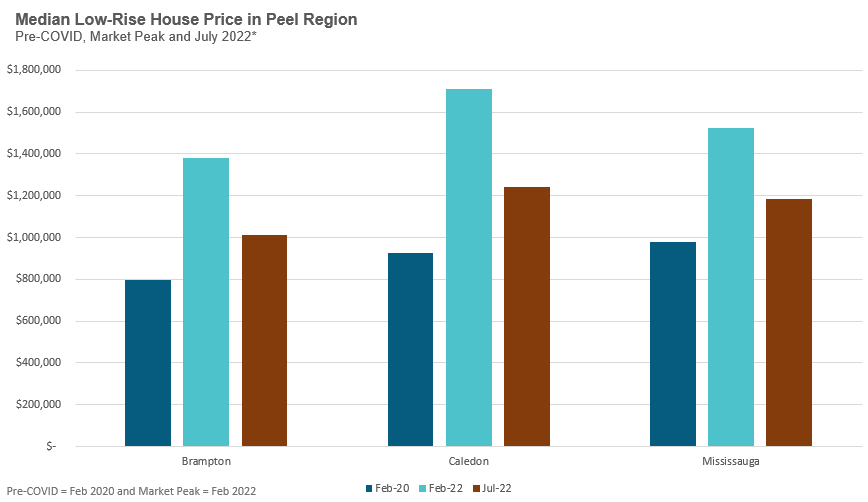
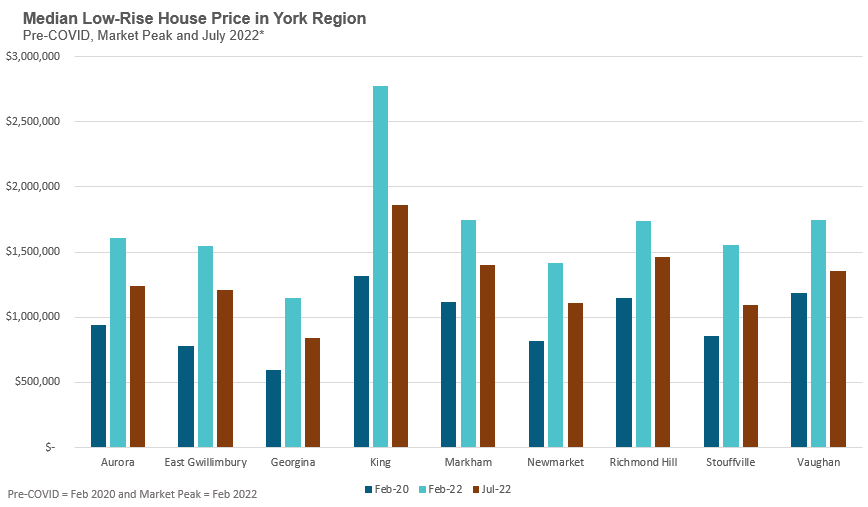
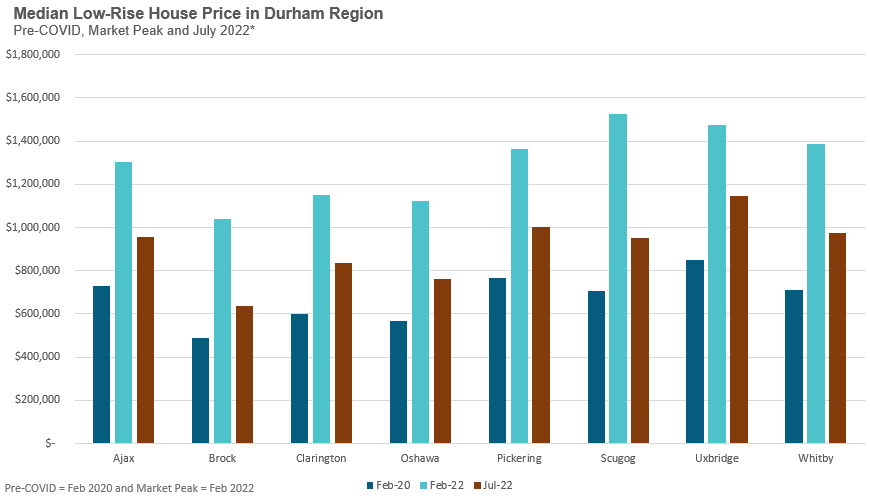
As these charts again show, municipalities that have experienced the biggest price rises during the boom have experienced the biggest drops — as we move into the fall market, we will need to see if prices begin to fall further to erase more of the gains seen during the boom throughout the GTA, or begin to stabilize as consumers begin to adjust to our 'new normal'.
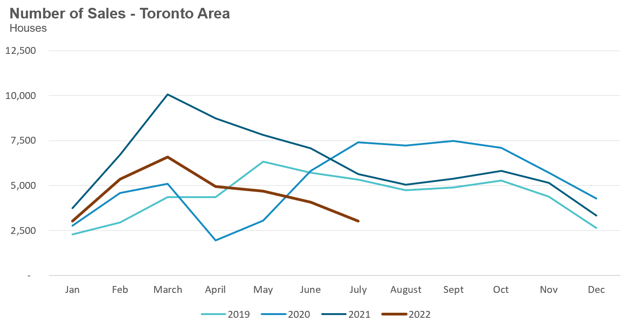
House sales (low-rise detached, semi-detached, townhouse, etc.) in the Greater Toronto Area (GTA) in July 2022 were down 46% over the same month last year and represents a 20-year low for the month of July.
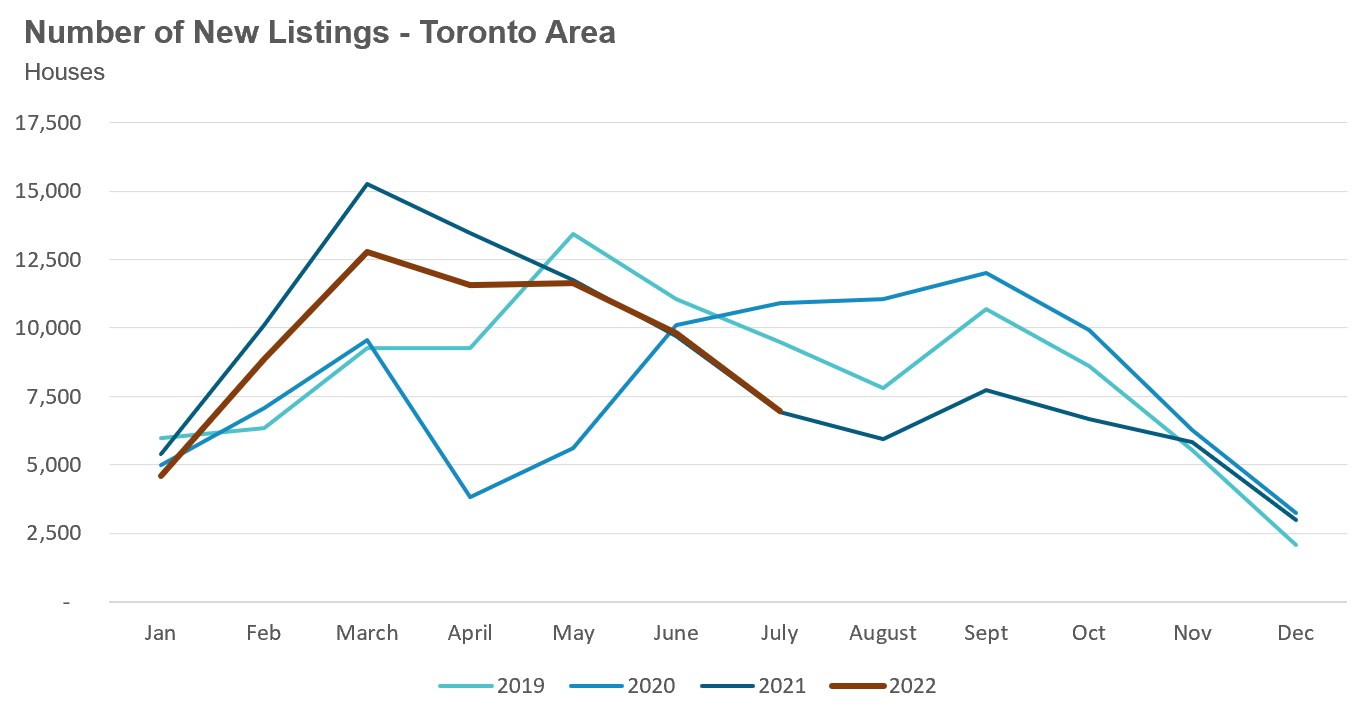
New house listings in July were unchanged compared to last year, but below typical new listing volumes for the month of July.
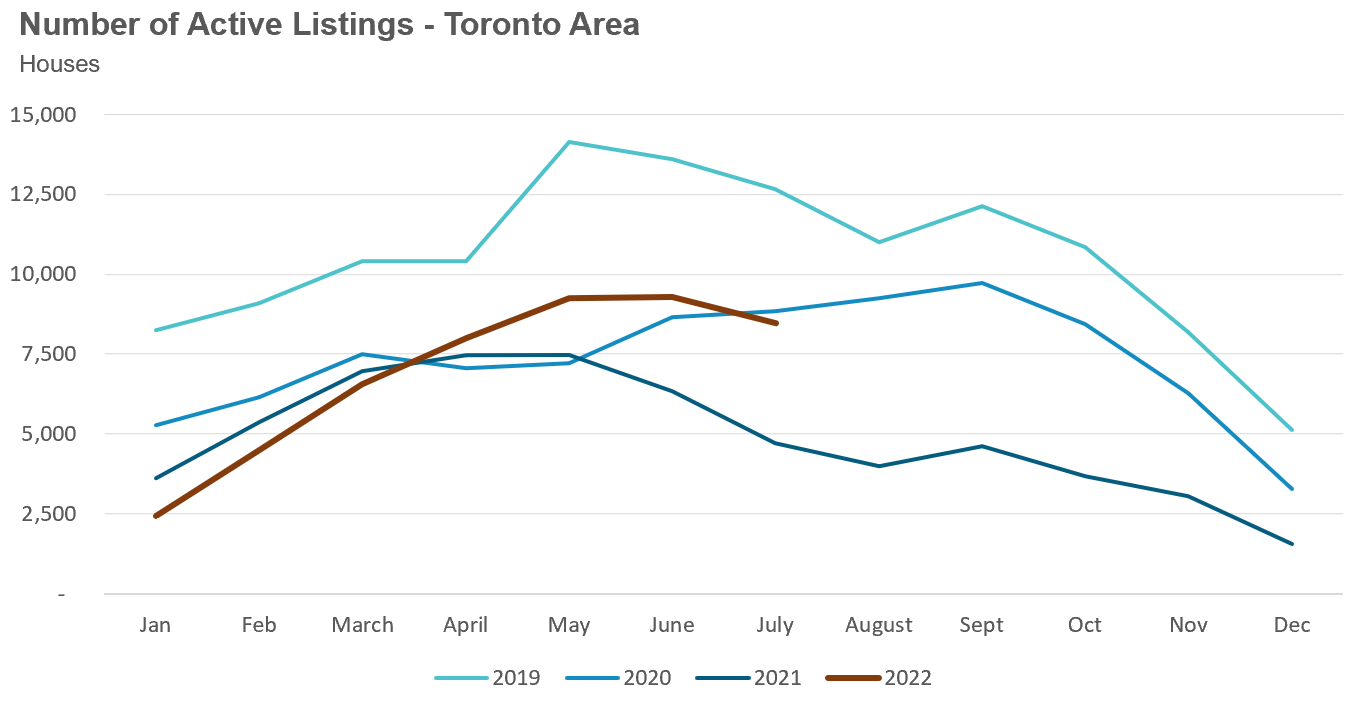
The number of houses available for sale (“active listings”) was up 80% when compared to the same month last year, but still 33% below pre-COVID levels in 2019.
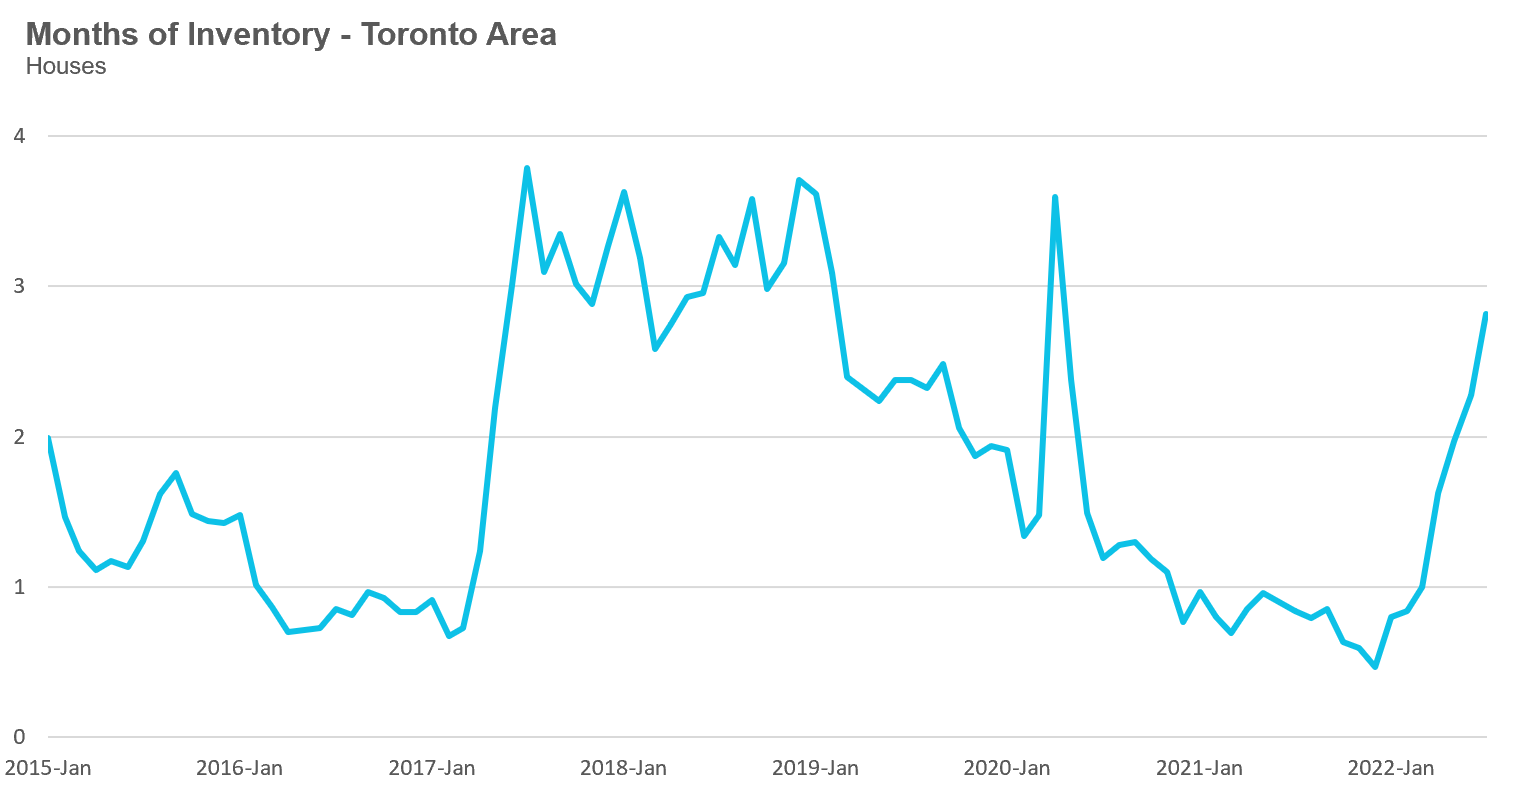
The Months of Inventory ratio (MOI) looks at the number of homes available for sale in a given month divided by the number of homes that sold in that month. It answers the following question: If no more homes came on the market for sale, how long would it take for all the existing homes on the market to sell given the current level of demand?
The higher the MOI, the cooler the market is. A balanced market (a market where prices are neither rising nor falling) is one where MOI is between four to six months. The lower the MOI, the more rapidly we would expect prices to rise.
While the current level of MOI gives us clues into how competitive the market is on-the-ground today, the direction it is moving in also gives us some clues into where the market may be heading.
The MOI was just below 1 in March, but has increased quickly and ended July with 2.8 MOI. The fact that the MOI has been rising rapidly since March is a sign that the market is cooling down just as rapidly.
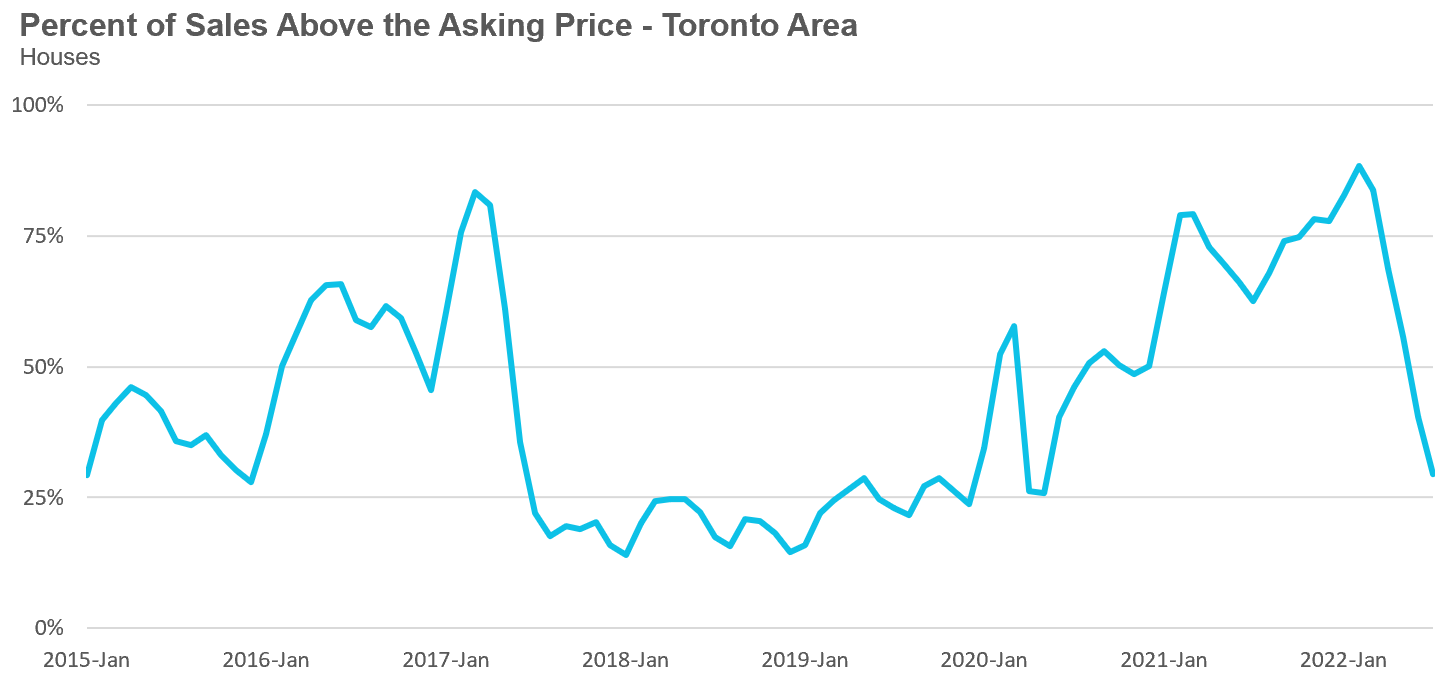
The share of houses selling for more than the owner’s asking price declined to 29% in July.
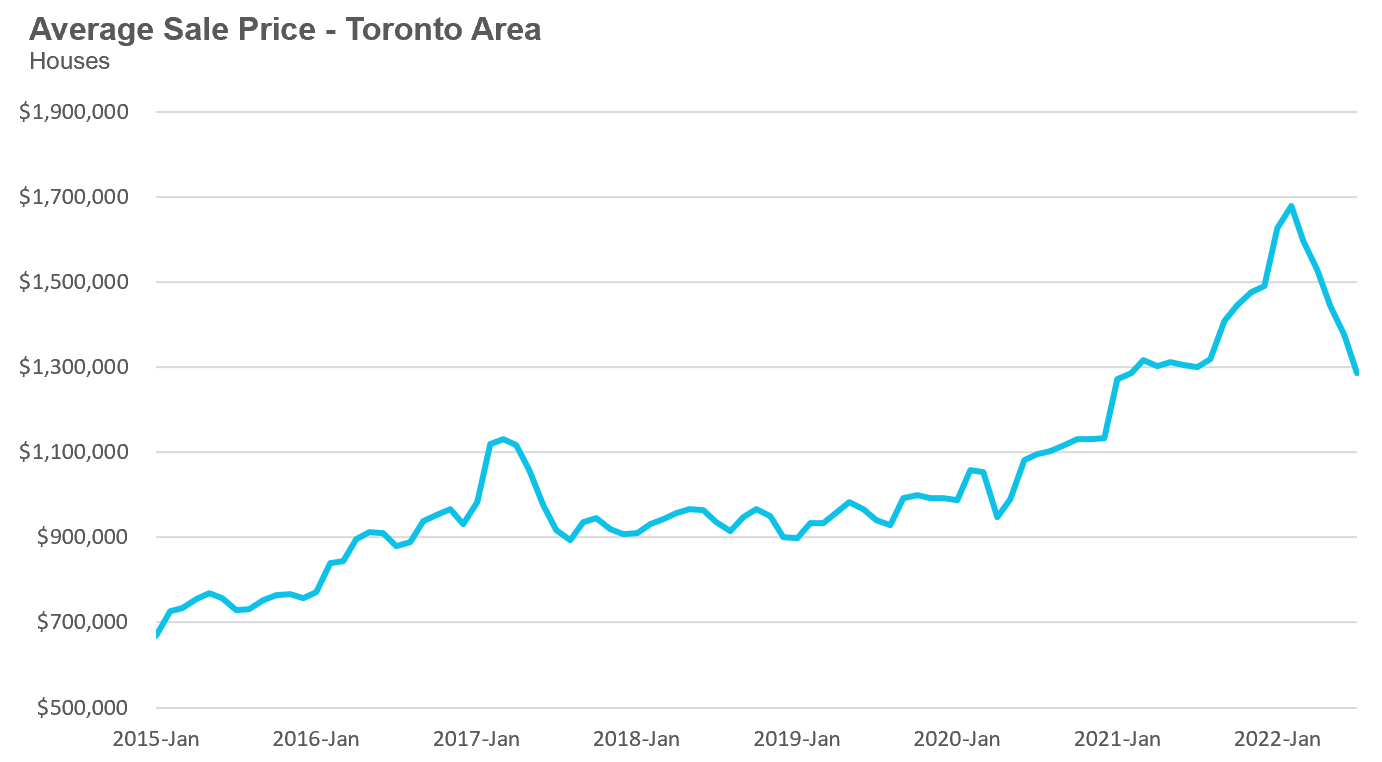
The average price for a house declined month-over-month to $1,285,222 in July 2022 and is well below the peak of $1,679,429 reached in February. The average price was down 1% when compared to the same month last year, the first time prices were down on a year-over-year basis since they began to decline this year.
The median house price in July was $1,125,000, down 2% over last year, and below the peak of $1,485,000 reached in February.
The median is calculated by ordering all the sale prices in a given month and then selecting the price that is in the midpoint of that list such that half of all home sales were above that price and half are below that price. Economists often prefer the median price over the average because it is less sensitive to big increases in the sale of high-end or low-end homes in a given month which can skew the average price.
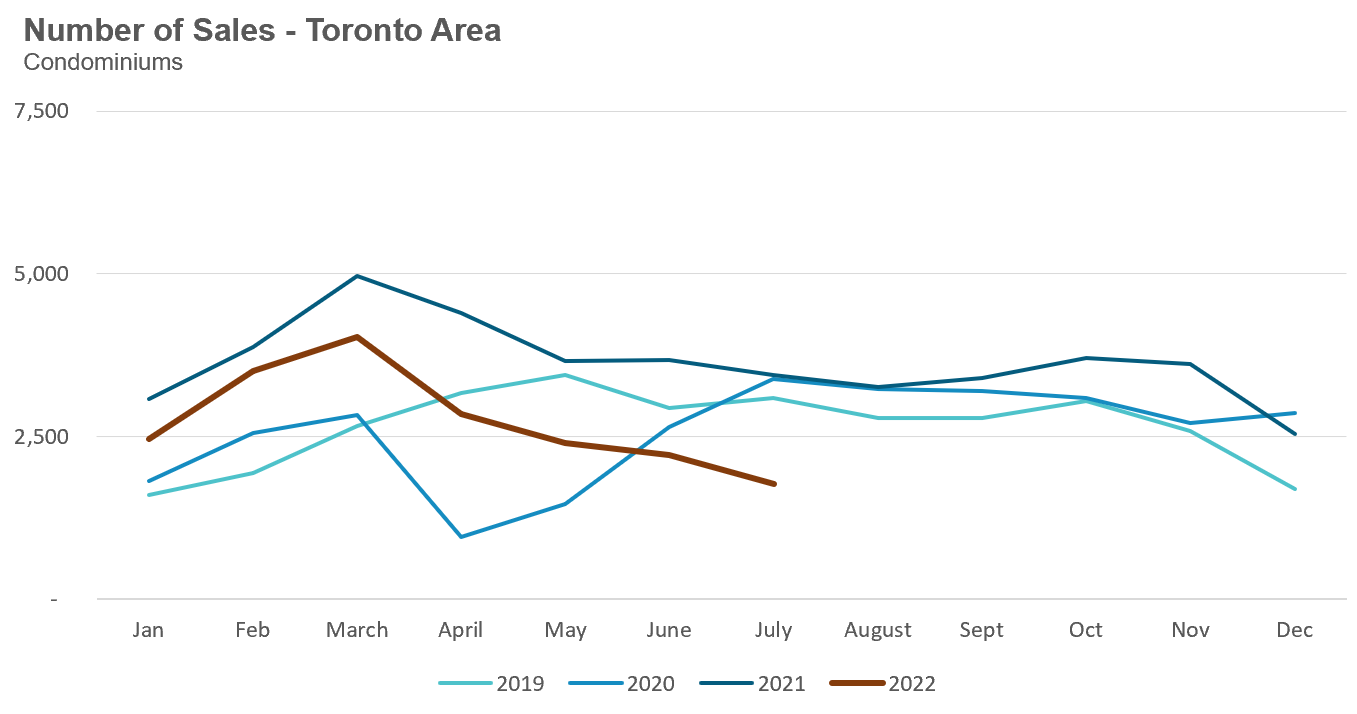
Condo (condominiums, including condo apartments, condo townhouses, etc.) sales in the Toronto area in July 2022 were down 49% over last year and well below pre-COVID sales volumes for the month of July.
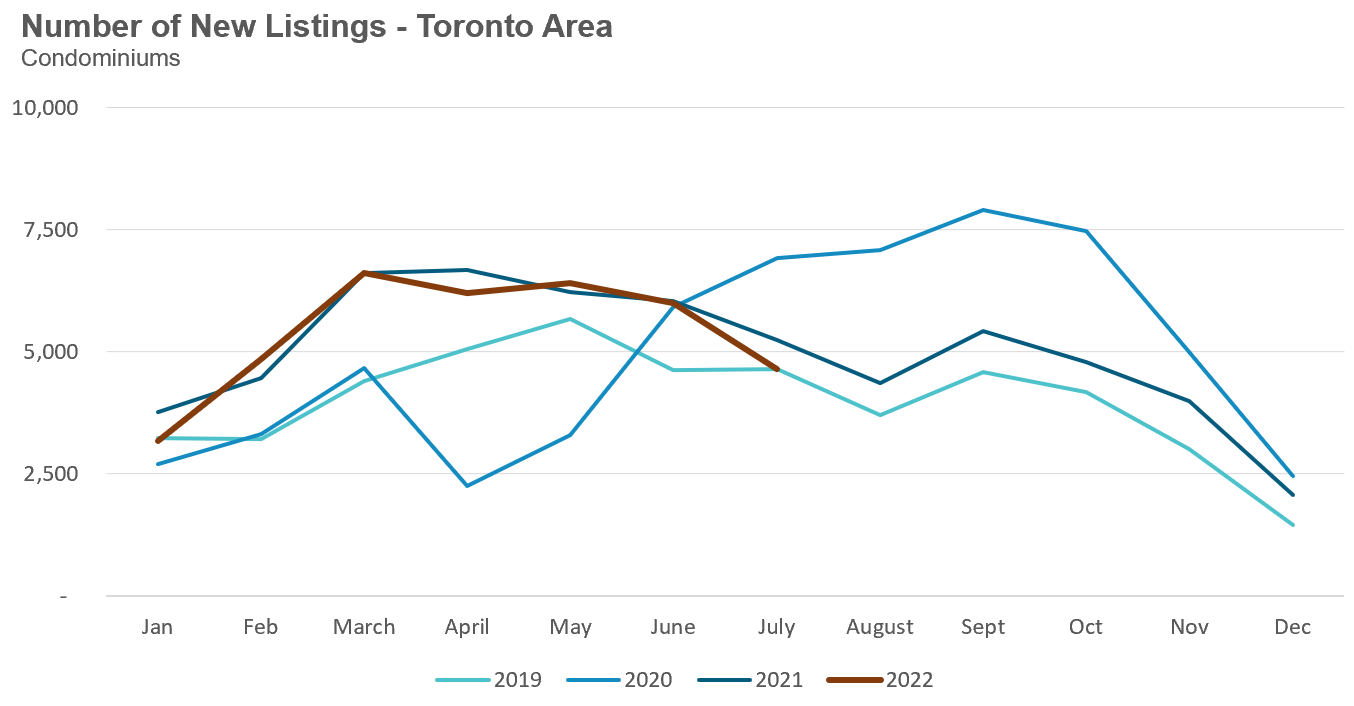
New condo listings were down 11% in July over last year and in line with historical listing volumes for the month of July.
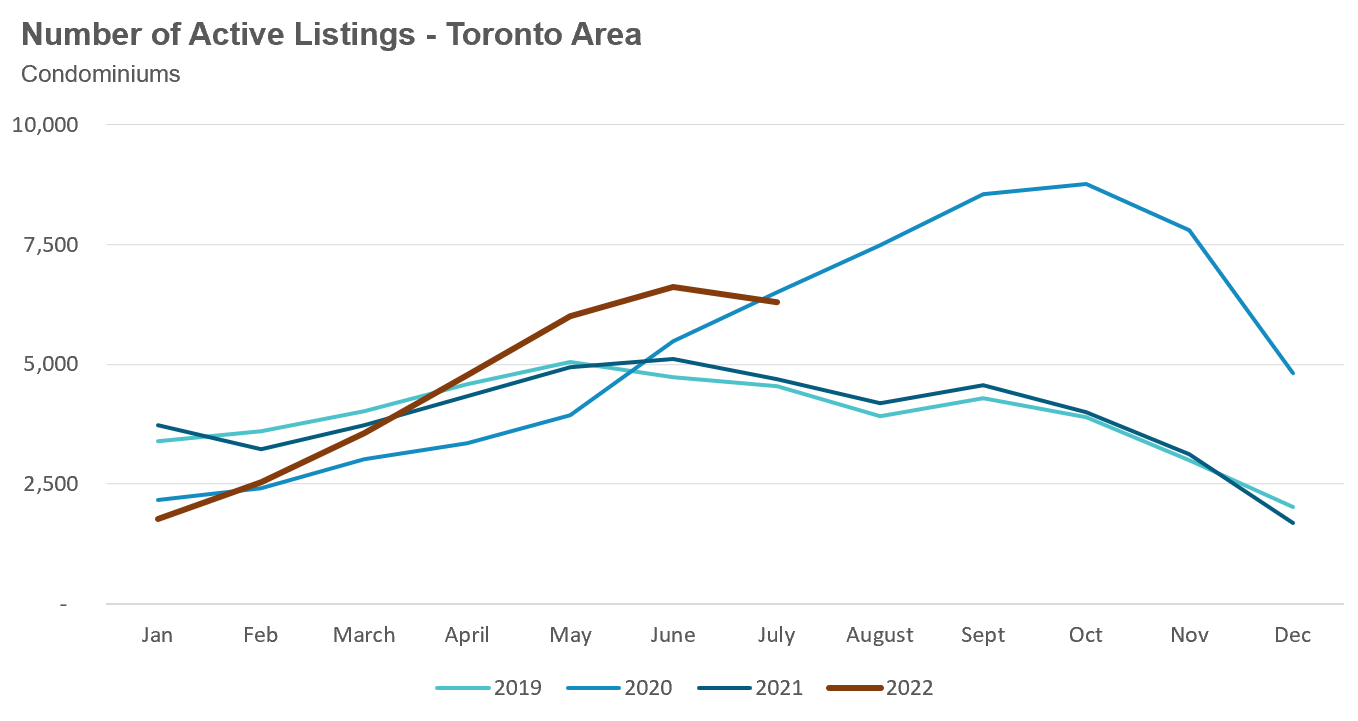
The number of condos available for sale at the end of the month, or active listings, was up 34% over last year.
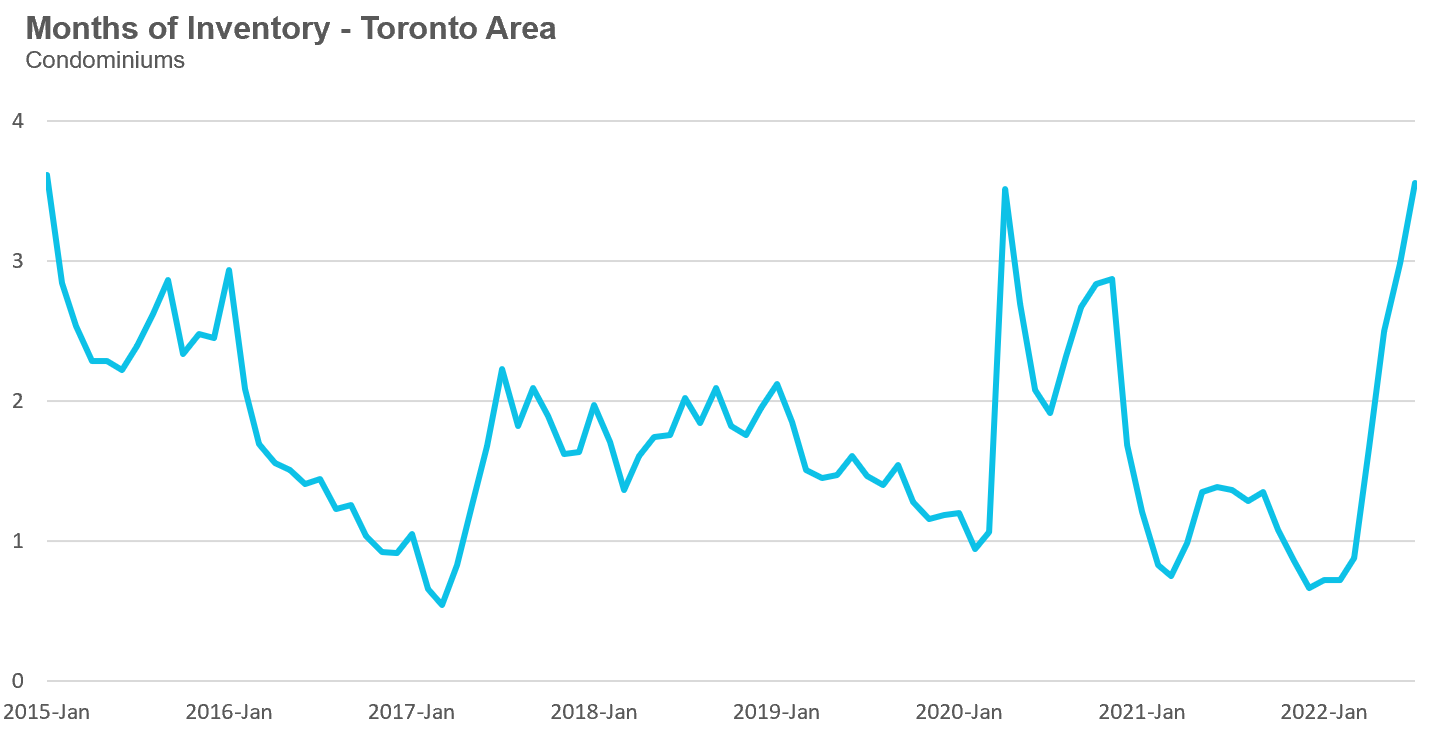
Condo inventory levels have been rising rapidly since March, reaching 3.6 months of inventory (MOI) in July.
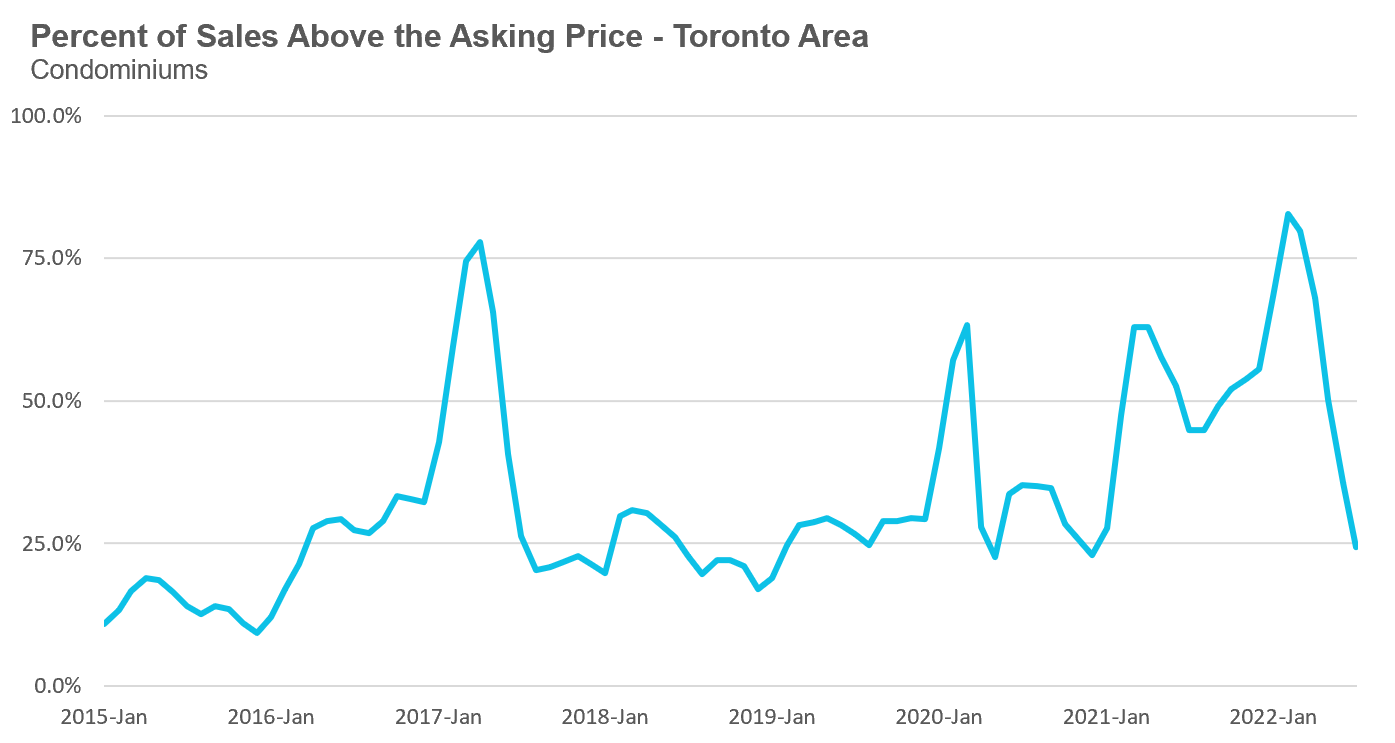
The share of condos selling for over the asking price declined to 24% in July.
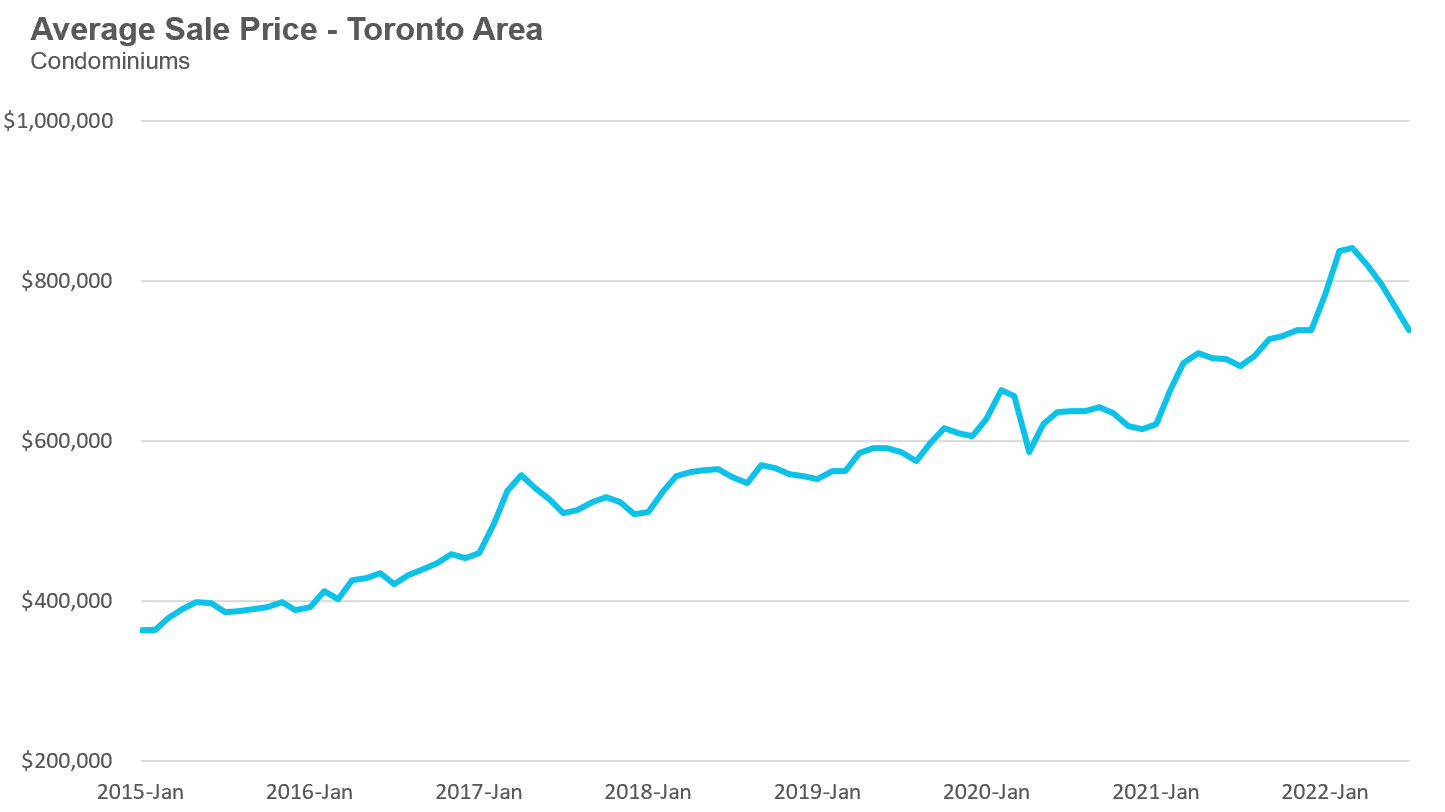
The average price for a condo in July fell to $738,930, down from the peak of $840,444 in March. The average price is up 7% over last year. The median price for a condo in July was $688,000, up 7% over last year, but down from $777,000 from the March peak.
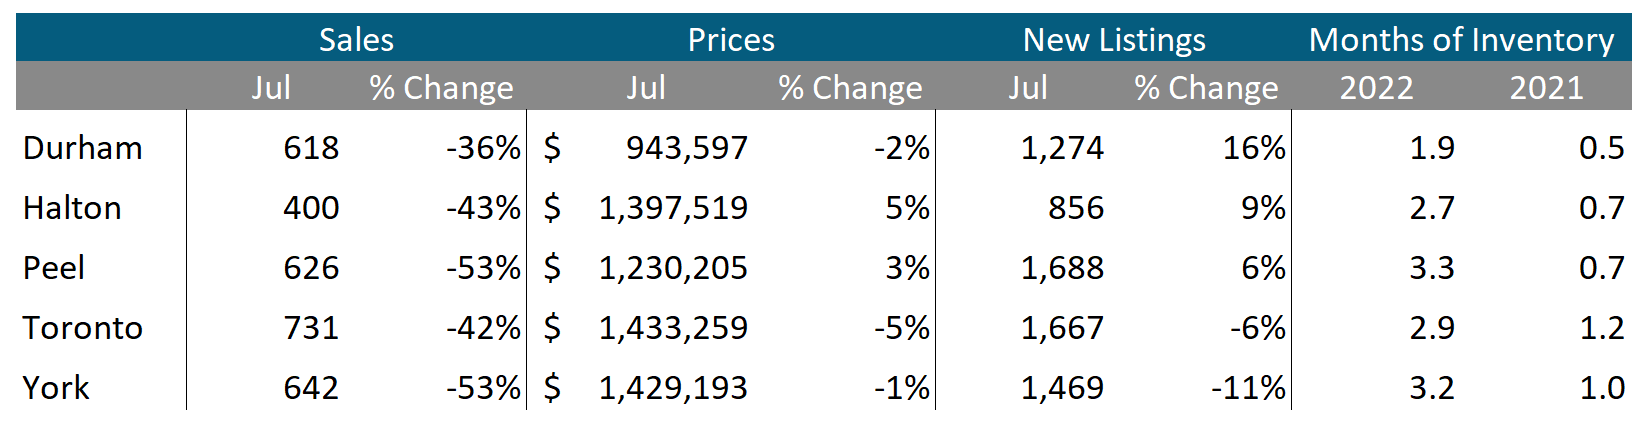
Houses
Average prices were down over last year in Toronto, Durham and York but still up slightly in Halton and Peel. Sales were down significantly across all regions and inventory levels were well ahead of last year’s level.
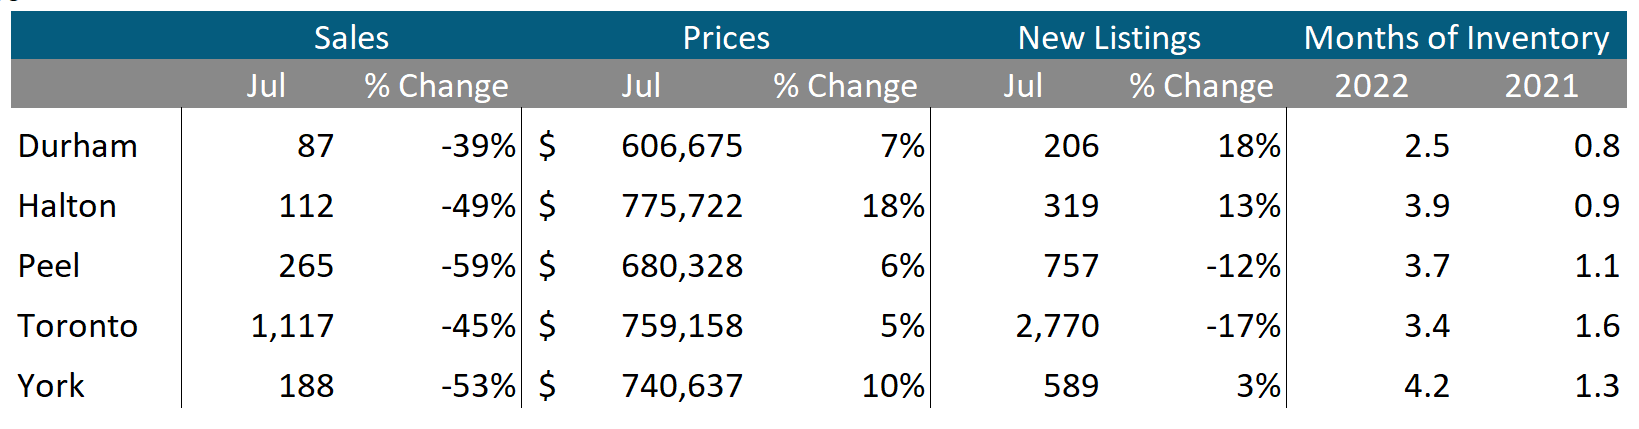
Condos
While condo sales were down across the GTA, average prices continue to be up over last year in all five regions. Sales were down significantly across all regions and inventory levels were well ahead of last year’s level.
See Market Performance by Neighbourhood Map, All Toronto and the GTA
Greater Toronto Area Market Trends
GET MORE DATA
This monthly Move Smartly Toronto Area Real Estate Market Report is powered by Realosophy Realty. Get the same up-to-date Toronto area market data on realosophy.com and additional information on every home for sale, including building permit history, environmental alerts and more when you buy a home with Realosophy Realty.