Author John Pasalis is the President of Realosophy Realty, a Toronto real estate brokerage which uses data analysis to advise residential real estate buyers, sellers and investors. He is a top contributor at Move Smartly, a frequent commentator in the media and researcher cited by the Bank of Canada and others.
FREE PUBLIC WEBINAR: WATCH REPORT HIGHLIGHTS & Q/A - Wed Dec 14th 12PM ET

Join John Pasalis, report author, market analyst and President of Realosophy Realty, in a free monthly webinar as he discusses key highlights from this report, with added timely observations about new emerging issues, and answers your questions. A must see for well-informed Toronto area real estate consumers.
The Market Now
Looking at the most recent statistics for the Greater Toronto Area (GTA) market for the most recent month available, November 2022, we’re seeing that even as sales numbers remain at 20-year lows, home prices have stabilized since July in part because there are relatively few homes available for sale.
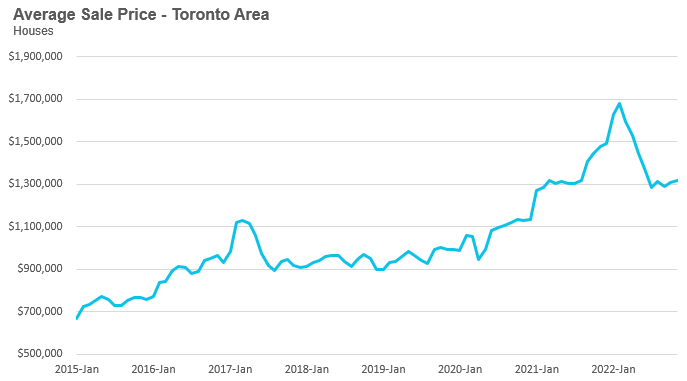
The average price for a house was $1,316,923 in November, down 22% from the most recent peak of $1,679,429 in February, and down 11% over the same month last year. The median house price in November was $1,150,000, down 24% from $1,485,000 in February, and down 12% over last year.
House sales in November were down a whopping 47% over last year while new house listings were down 13% compared to last year. The number of houses available for sale at the end of the month, or active listings, was up 107% over last year, when demand was notably high; excluding that year, the active listings number today is well below historical norms for the month of November.
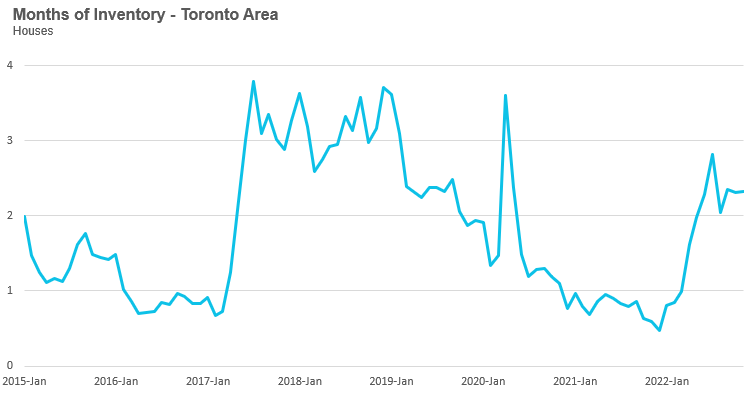
The Months of Inventory (MOI) which is a measure of inventory relative to the number of sales each month (see Monthly Statistics section below for more information on this measure) was unchanged at 2.3 MOI in November, indicating tight supply conditions.
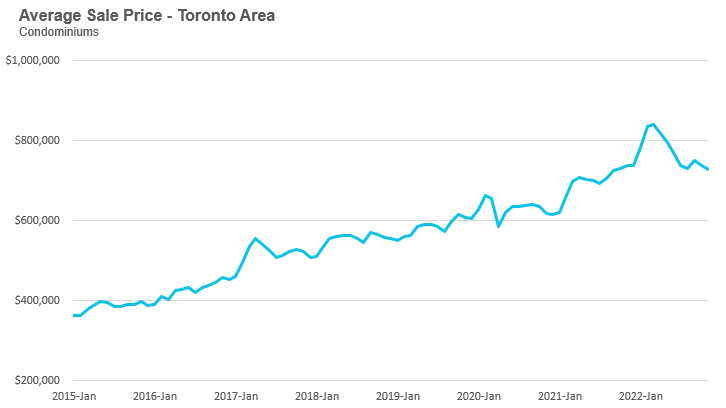
The average price for a condo fell to $728,984 in November, down 13% from the most recent peak of $840,444 in March, and down 1% over last year. The median price for a condo in November was $660,000, down from $777,000 in March and down 1% over last year.
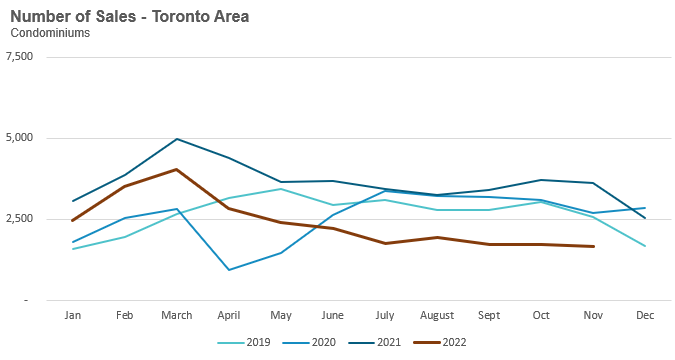
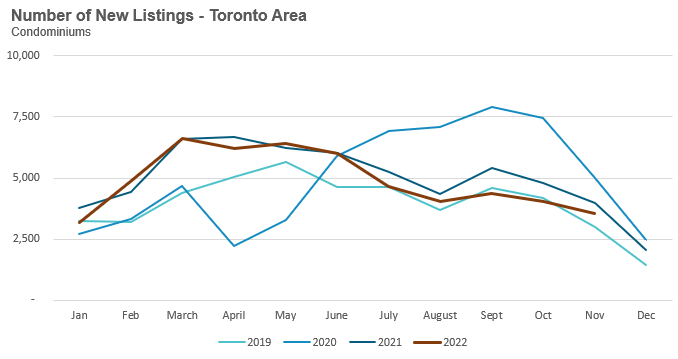
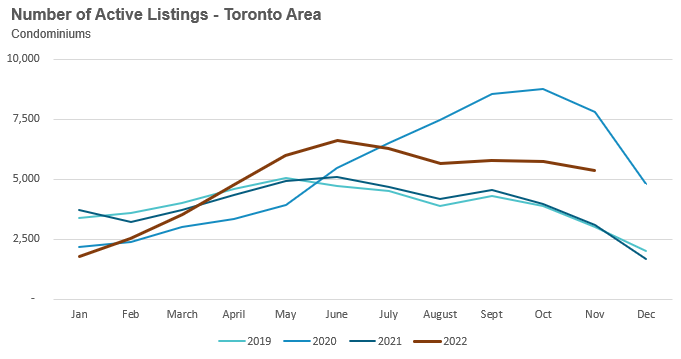
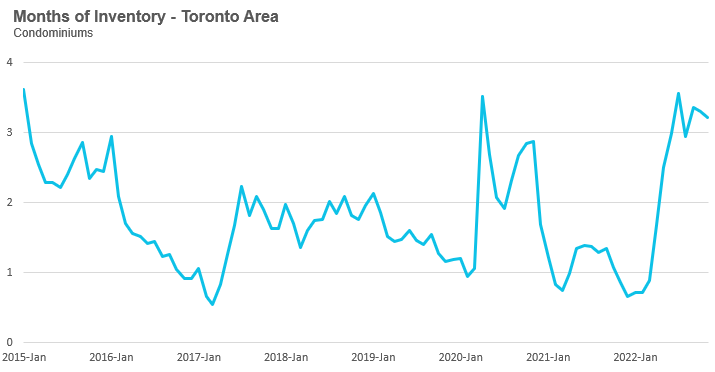
Condo sales in November were down 54% over last year and below pre-COVID sales volumes for the month in 2019. New condo listings were down 11% over last year while the number of active condo listings was up 72% over last year. The MOI decreased slightly to 3.2 MOI in November, indicating that supply is slightly less constrained for condos than for houses.
For detailed monthly statistics for the Toronto Area, including house, condo and regional breakdowns, see the final section of this report.
The federal Liberal government recently introduced the Prohibition on the Purchase of Residential Property by Non-Canadians Act which will prohibit non-residents of Canada from purchasing residential real estate for two years beginning January 1, 2023.
Unfortunately, this policy is too little and far too late to have any meaningful impact on Toronto’s housing market.
How big of an impact have foreign buyers had on the housing market? For years the Canadian Mortgage and Housing Corporation (CMHC) argued they were not influencing house prices and even implied that xenophobia rather than facts was was behind these concerns. Myfavourite comment from their 2016 research was their jab at the “twitterverse” for suggesting that foreign buyers were influencing house prices:
“To some, the scapegoat is obvious: blame foreigners. It's the recurring theme, the clear cause according to the twitterverse and many commentators.”
As someone who has been active on the twitterverse for some time, I can confidently say that very few people were arguing that foreign capital was the single cause for high home prices, but they did argue that it was one of many important drivers of home prices that policy makers should have looked into rather than dismiss the way CMHC did.
Then in 2019, with the help of Statistics Canada, CMHC was able to publish more accurate statistics on the share of existing homes owned by non-residents. It turned out that their original estimate that just over 2% of condominiums in Toronto and Vanvouver were owned by non-residents was well off the mark.
The share of condominiums that have at least one non-resident owner was 11.2% in Vancouver and 7.6% in Toronto. This is a very big share when one considers that this refers to the entire stock of condominiums rather than the percent of sales each year.
The provincial governments in British Columbia and Ontario introduced taxes on homes bought by non-residents in 2016 and 2017 respectively. The Ontario government’s non-resident tax was originally 15% of the sale price of a home, but that was increased to 25% in 2022.
As far as I’m aware, the province of Ontario has not published any recent statistics on the number of homes bought by non-residents each year, but I suspect their non-resident tax has significantly cooled that activity. This doesn’t mean that foreign capital isn’t still flowing into Canada’s housing market, it just means that if it is, it is likely flowing through individuals and companies that are exempted from paying the tax.
The provincial non-resident tax doesn’t target the source of the capital, the tax is based on the residency of the buyer. There’s a big difference between targeting foreign buyers vs foreign capital — the former is far easier than the latter.
It’s for this reason that I was originally hopeful that the federal Liberal government was going to make some material changes to actually target foreign money rather than foreign buyers. Their election platform specifically said they were going to:
“Ban foreign money from purchasing a nonrecreational, residential property in Canada.”
Their announcement regarding the housing related policies in their April 2022 budget also discussed foreign capital:
“Curbing unfair practices that drive up the price of housing by imposing a two-year ban on foreign capital coming into Canada to buy residential real estate.”
But at this point the Liberal’s foreign buyer ban appears to target individuals and corporations rather than foreign capital and their plan will likely have a number of exceptions including for international students. Ensuring the parents of university students can speculate in Canada’s housing market (in their child’s name) appears to be one of the key selling points our governments are promoting when encouraging international students to study in Canada.
Given the existing foreign buyer taxes in Ontario and BC, it’s quite clear that the Liberal’s foreign buyer ban is an exercise in political theatre and will likely have very little impact on the housing market.
When we consider the speed and magnitude of the Bank of Canada’s interest rate increases this year, I don’t think it’s any surprise that today’s higher interest rates are weighing on household finances with many struggling to make their mortgage payments.
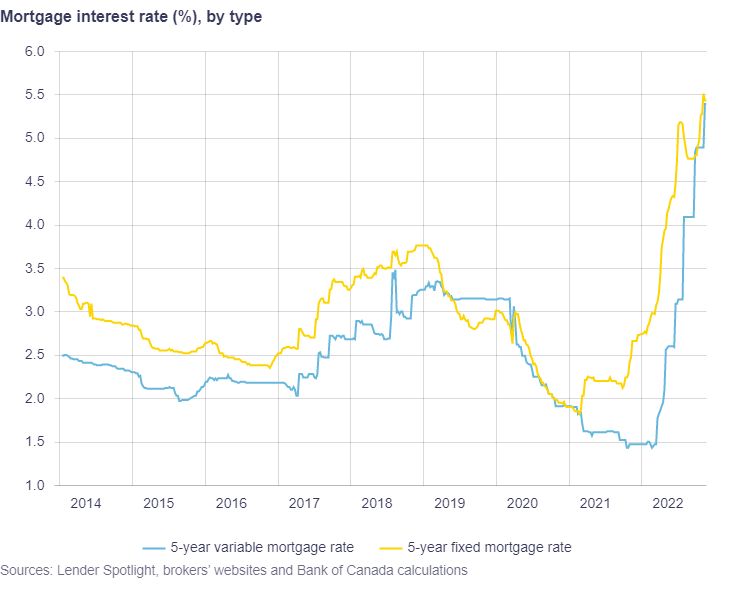
Today’s rising interest rates are especially impacting borrowers with variable rate mortgages. A variable rate mortgage in Canada can either have variable or fixed payments.
With a variable payment mortgage, a homeowner’s monthly mortgage payment changes with the prime rate. If the prime rate increases then the borrower’s mortgage payment increases to cover the additional interest payment.
With a fixed payment mortgage, the homeowner’s monthly mortgage payment remains unchanged even as the prime rate increases. But at some point, the homeowner will hit their “trigger rate” which is the interest rate at which the homeowner’s monthly payment only covers the interest on the mortgage with no contribution going towards the principal.
The Bank of Canada reported that at the end of November, approximately 50% of all variable rate mortgages had hit their trigger rate. This ratio has likely increased given the BOC’s December 50bp rate hike.
What happens when a borrower hits their trigger rate? There is no standardized approach that all banks are taking, but in general the borrower will likely have to increase their monthly mortgage payment to ensure that it covers the cost of interest and some contribution towards the principal.
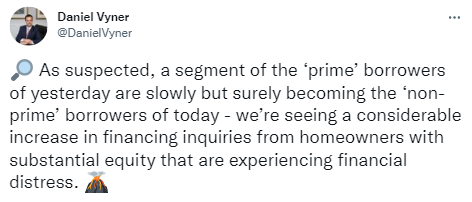
Mortgage broker Daniel Vyner notes that the distress some households are experiencing isn’t just coming from yesterday’s highly leveraged non-prime home owners. Households who were prime borrowers yesterday, he argues, are becoming non-prime borrowers today.
Any household that is renewing their mortgage over the next year will likely face a significant increase in their monthly mortgage payments due to today’s high interest rates. In many cases, home owners are seeing their mortgage payments increase by as much as 40 to 50%. For example, a household that had a $2,000 per month mortgage payment would see that increase to $2,800 or $3,000 when renewing at today’s interest rates.
To soften this payment shock, Canada’s mortgage insurers are allowing banks to extend a home owner’s maximum amortization period to 40 years at renewal which would lower their monthly mortgage payment.
As we move into the new year, I suspect we’ll likely hear even more stories of financial distress and I would not be surprised if we see some very highly leveraged real estate investors begin to sell some of their properties in order to deleverage.
This month, I’m going to take a closer look at Toronto’s rental market to see how prices, sales and inventory levels have changed over the past couple of years.
The rental statistics below are based on properties that were listed for sale on the Toronto Regional Real Estate Board’s (TRREB) MLS system. This largely consists of condominium (condo) units and low-rise houses (either an entire house or a unit in a multi-unit home) and does not include purpose-built rental apartments.
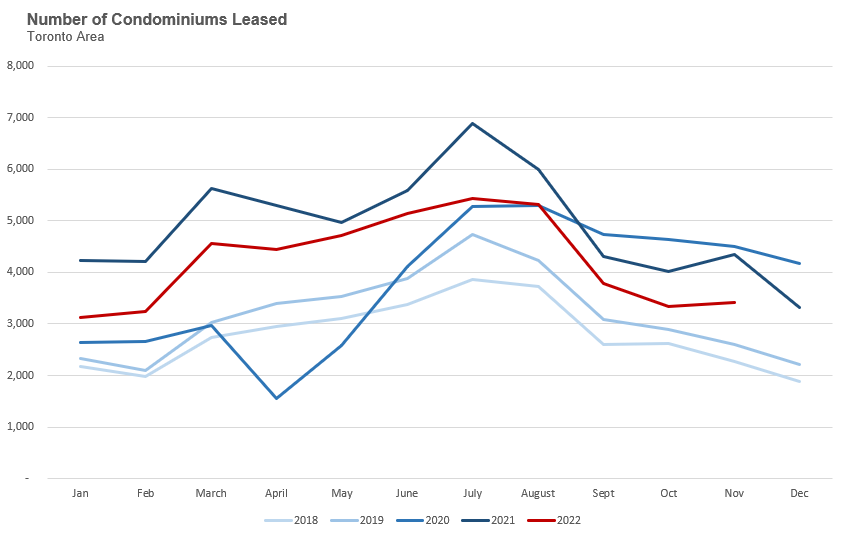
Looking at the number of leases, we see two slightly different trends for condos and low-rise houses. Condo rentals really picked up during the second half of 2020 and continued at a very elevated level during the first three quarters of 2021. While condo rental volumes in 2022 are well ahead of pre-COVID levels, they are down from their COVID peak.
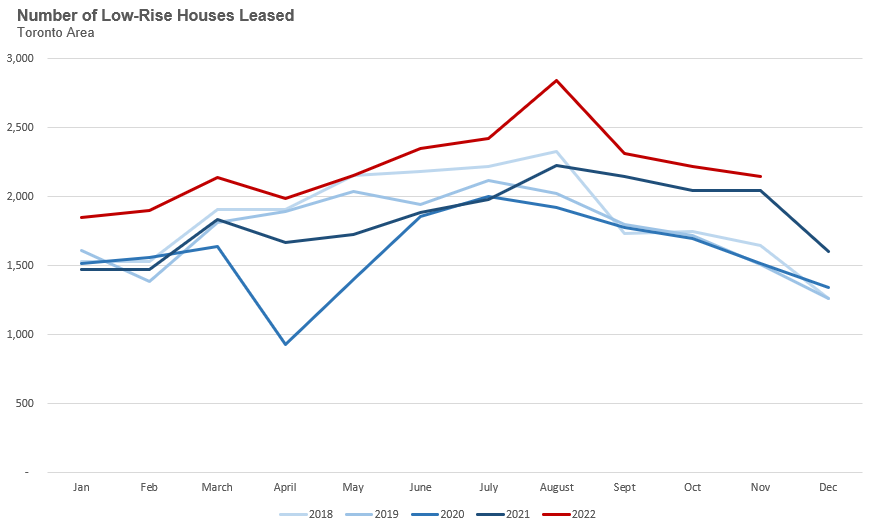
The rental market for low-rise houses, on the other hand, is at an all time high during 2022. This is likely a product of the fact that low-rise house prices accelerated far more rapidly over the past two years and as prices got further out of reach more potential buyers moved to the sidelines and decided to rent. More recently, high interest rates have made it harder for first time buyers to get a mortgage which has also pushed many buyers to the sidelines.
The number of condos available for lease is inline with historical norms and below levels seen over the previous three years. This is a good place to be as we move into 2023 when the GTA is expected to see roughly 18,000 condo completions during the first half of the year.
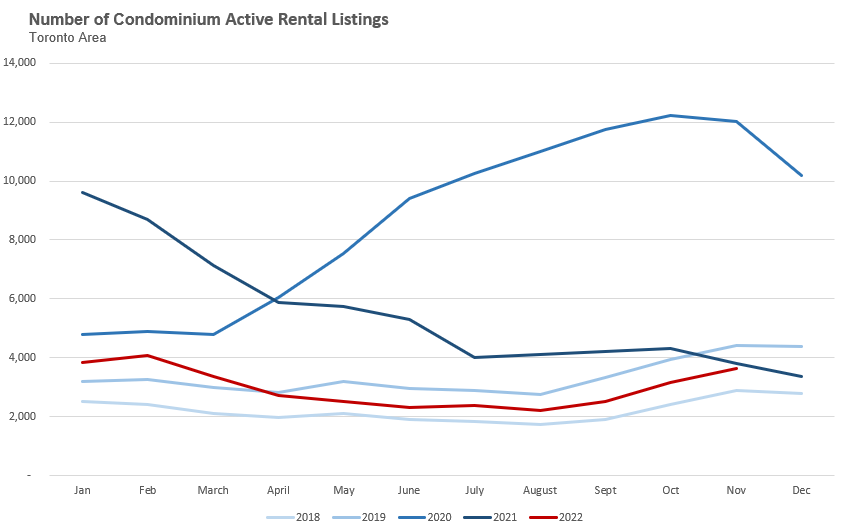
The number of low-rise houses available for rent, on the other hand, is well ahead of historical volumes, but the market is still relatively balanced given the strong sales volume. At the end of November there was just 2 months of available low-rise rental inventory.
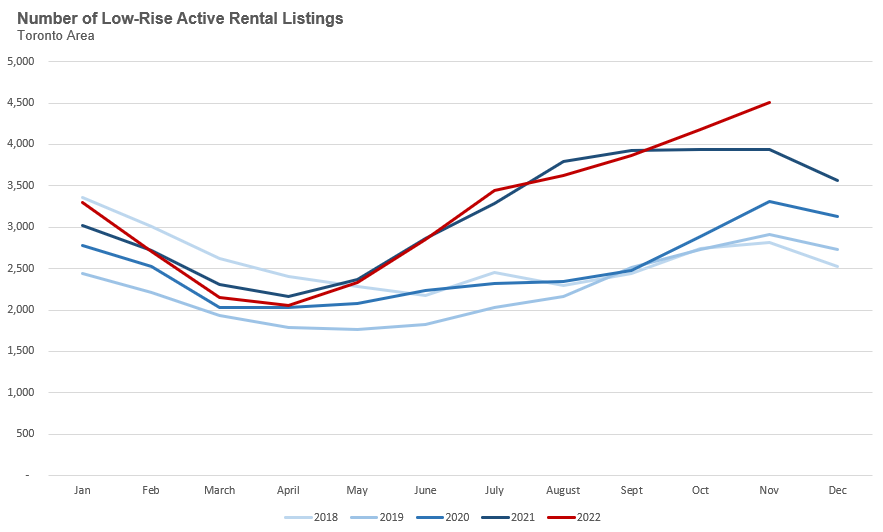
Aside from a short term decline in condo rent prices during COVID, rents have accelerated since 2015 and both condo and low-rise rents are above pre-COVID levels. The decline in average rents the past few months is a typical seasonal trend, rents usually peak in the summer before declining during the fall/winter market.
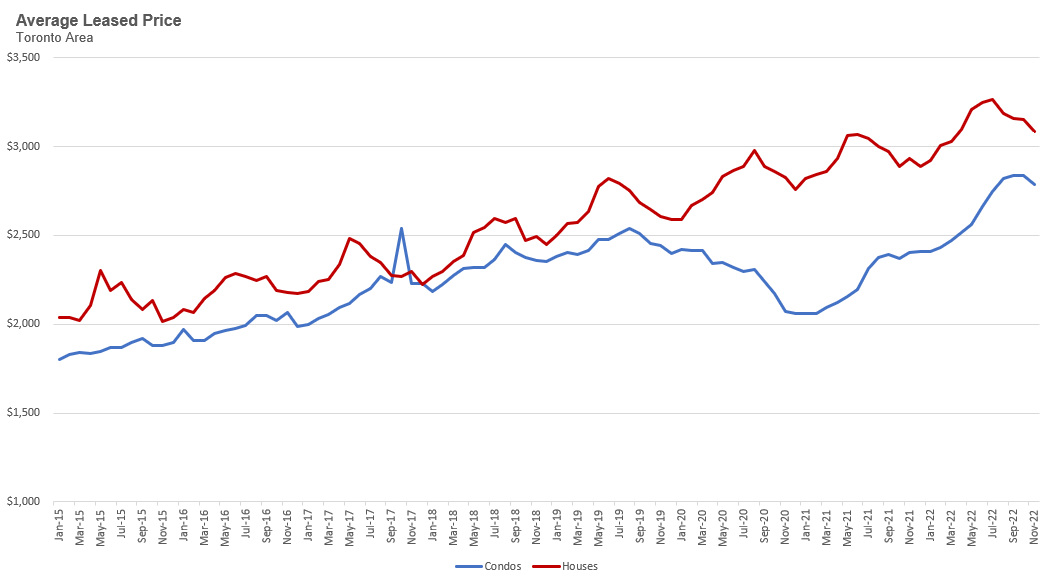
The chart below compares the average condo rent in November 2022 to the pre-COVID average which I have defined as February 2020. The average rent is up by 14% in Toronto, 20% in Peel, 21% in York and Halton and 34% in Durham.
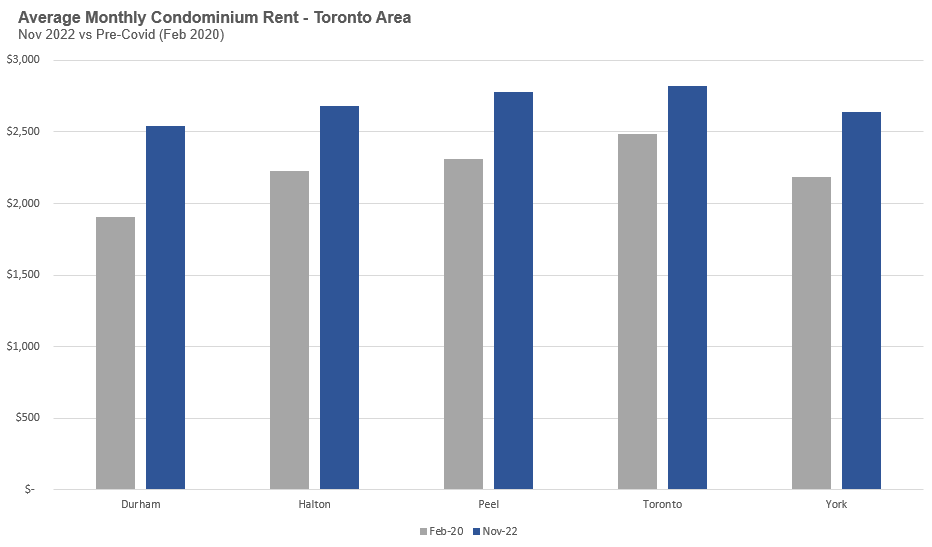
When comparing the average low-rise rent in November 2022 to the pre-COVID average we see that the average rent is up by 8% in Toronto, 17% in Peel, 18% in York, 20% in Halton and 23% in Durham.
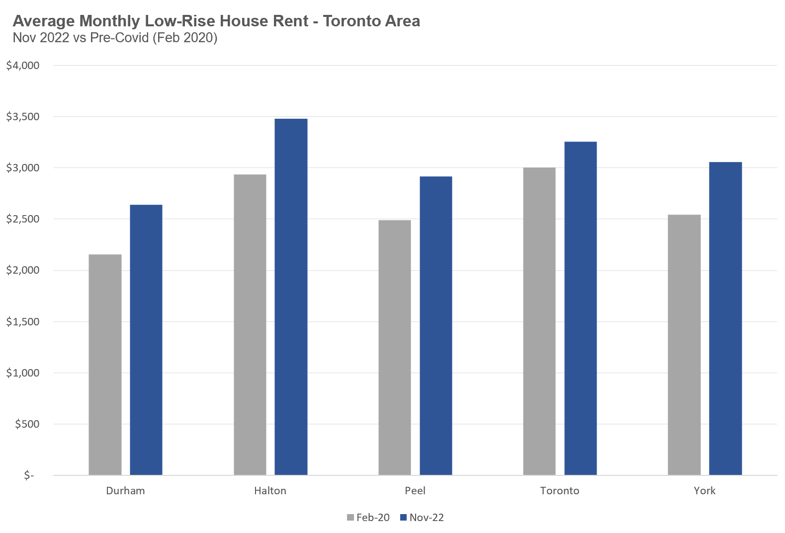
High interest rates coupled with elevated home prices will continue to make it hard for potential first-time home buyers to qualify for a mortgage which will likely lead to continued strong demand for rentals in 2023.
Houses - Condos - Regional Trends
House sales (low-rise detached, semi-detached, townhouse, etc.) in the Greater Toronto Area (GTA) in November 2022 were down 47% over the same month last year and remain well below historical levels for the month.
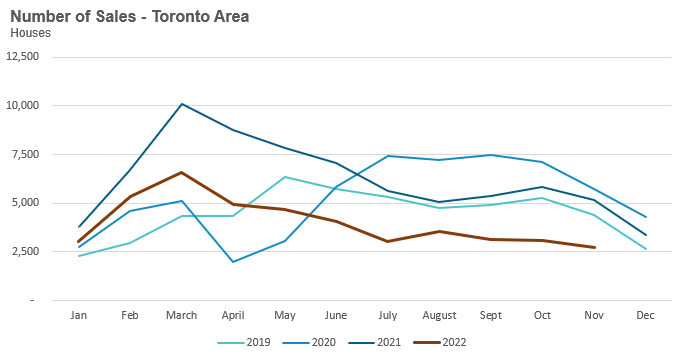
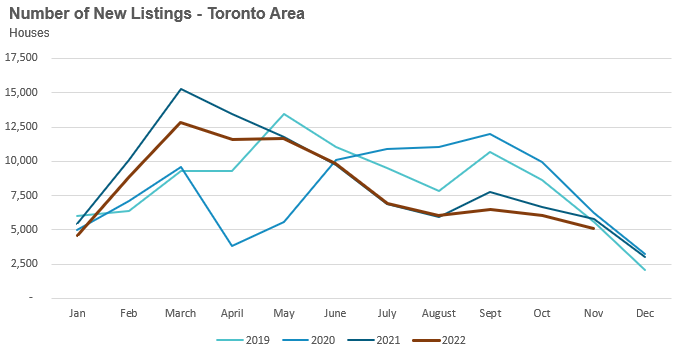
New house listings in November were down 13% over last year.
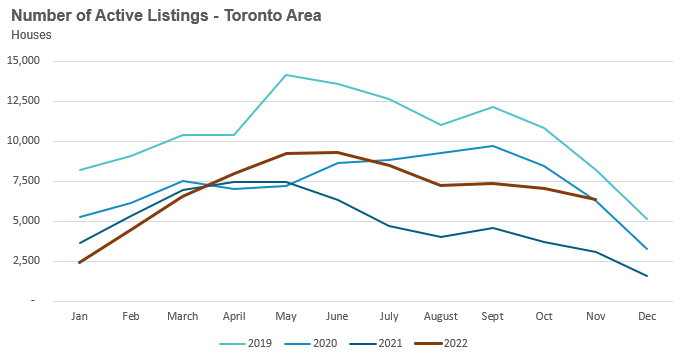
The number of houses available for sale (“active listings”) was up 107% when compared to the same month last year, but still well below pre-COVID levels for the month of November. It’s worth noting that the low inventory levels in the second half of 2021 were due to a surge in demand as the market accelerated towards the peak in February 2022.
The Months of Inventory ratio (MOI) looks at the number of homes available for sale in a given month divided by the number of homes that sold in that month. It answers the following question: If no more homes came on the market for sale, how long would it take for all the existing homes on the market to sell given the current level of demand?
The higher the MOI, the cooler the market is. A balanced market (a market where prices are neither rising nor falling) is one where MOI is between four to six months. The lower the MOI, the more rapidly we would expect prices to rise.
While the current level of MOI gives us clues into how competitive the market is on-the-ground today, the direction it is moving in also gives us some clues into where the market may be heading.
The MOI for houses remained unchanged at 2.3 MOI in November.
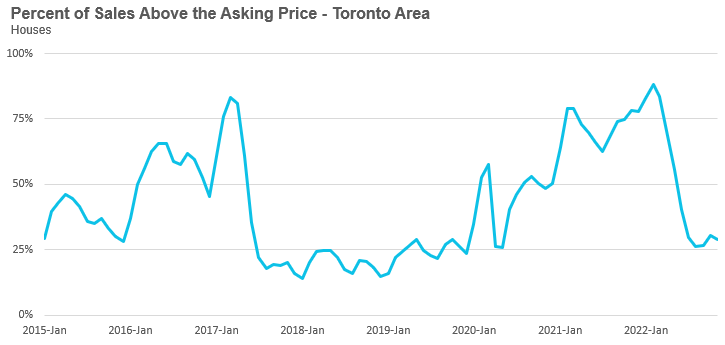
The share of houses selling for more than the owner’s asking price dipped slightly to 329% in November.
The average price for a house in November was $1,316,923 in November 2022, well below the peak of $1,679,429 reached in February and down11% when compared to the same month last year.
The median house price in November was $1,150,000, down12% over last year, and below the peak of $1,485,000 reached in February.
The median is calculated by ordering all the sale prices in a given month and then selecting the price that is in the midpoint of that list such that half of all home sales were above that price and half are below that price. Economists often prefer the median price over the average because it is less sensitive to big increases in the sale of high-end or low-end homes in a given month which can skew the average price.
Condo (condominiums, including condo apartments, condo townhouses, etc.) sales in the Toronto area in November 2022 were down 54% over last year and well below pre-COVID sales volumes for the month of November.
New condo listings were down 11% in November over last year and in line with historical listing volumes for the month of November.
The number of condos available for sale at the end of the month, or active listings, was up 72% over last year.
Condo inventory levels decreased slightly to 3.2 MOI in November.
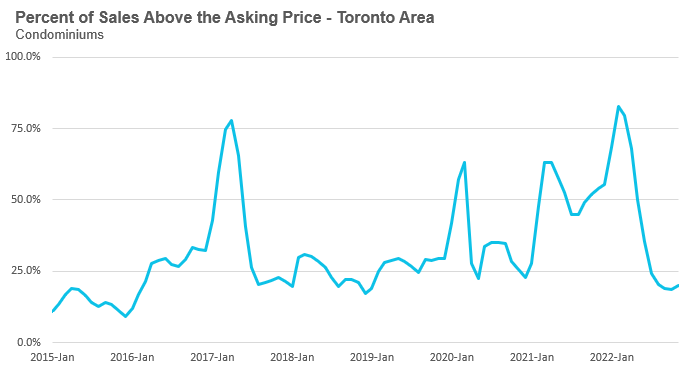
The share of condos selling for over the asking price increased slightly to 20% in November.
The average price for a condo in November was $728,984, down from the peak of $840,444 in March, and down 1% over last year. The median price for a condo in November was $660,000, down 1% over last year, and down from the March peak of $777,000.
Houses
Average prices were down over last year across all five regions with Halton and Toronto seeing the biggest decline in prices. Sales were down significantly across all regions and inventory levels were well ahead of last year’s level.

Condos
Average condo prices were down over last year in Durham, Peel and Toronto. Sales were down significantly across all regions and inventory levels were well ahead of last year’s level.

See Market Performance by Neighbourhood Map, All Toronto and the GTA
Greater Toronto Area Market Trends
GET MORE DATA
This monthly Move Smartly Toronto Area Real Estate Market Report is powered by Realosophy Realty. Get the same up-to-date Toronto area market data on realosophy.com and additional information on every home for sale, including building permit history, environmental alerts and more when you buy a home with Realosophy Realty.