FREE PUBLIC WEBINAR: WATCH REPORT HIGHLIGHTS & Q/A - Thurs Feb 16th 12PM ET

Join John Pasalis, report author, market analyst and President of Realosophy Realty, in a free monthly webinar as he discusses key highlights from this report, with added timely observations about new emerging issues, and answers your questions. A must see for well-informed Toronto area real estate consumers.
Statistics Canada’s Canadian Housing Statistics Program recently published data on real estate investor activity in Canada.
This long-awaited research is important because, according to research, high numbers of real estate investors tend to amplify boom and bust housing cycles, causing prices to rise higher and more rapidly during boom periods and crash further during housing busts.
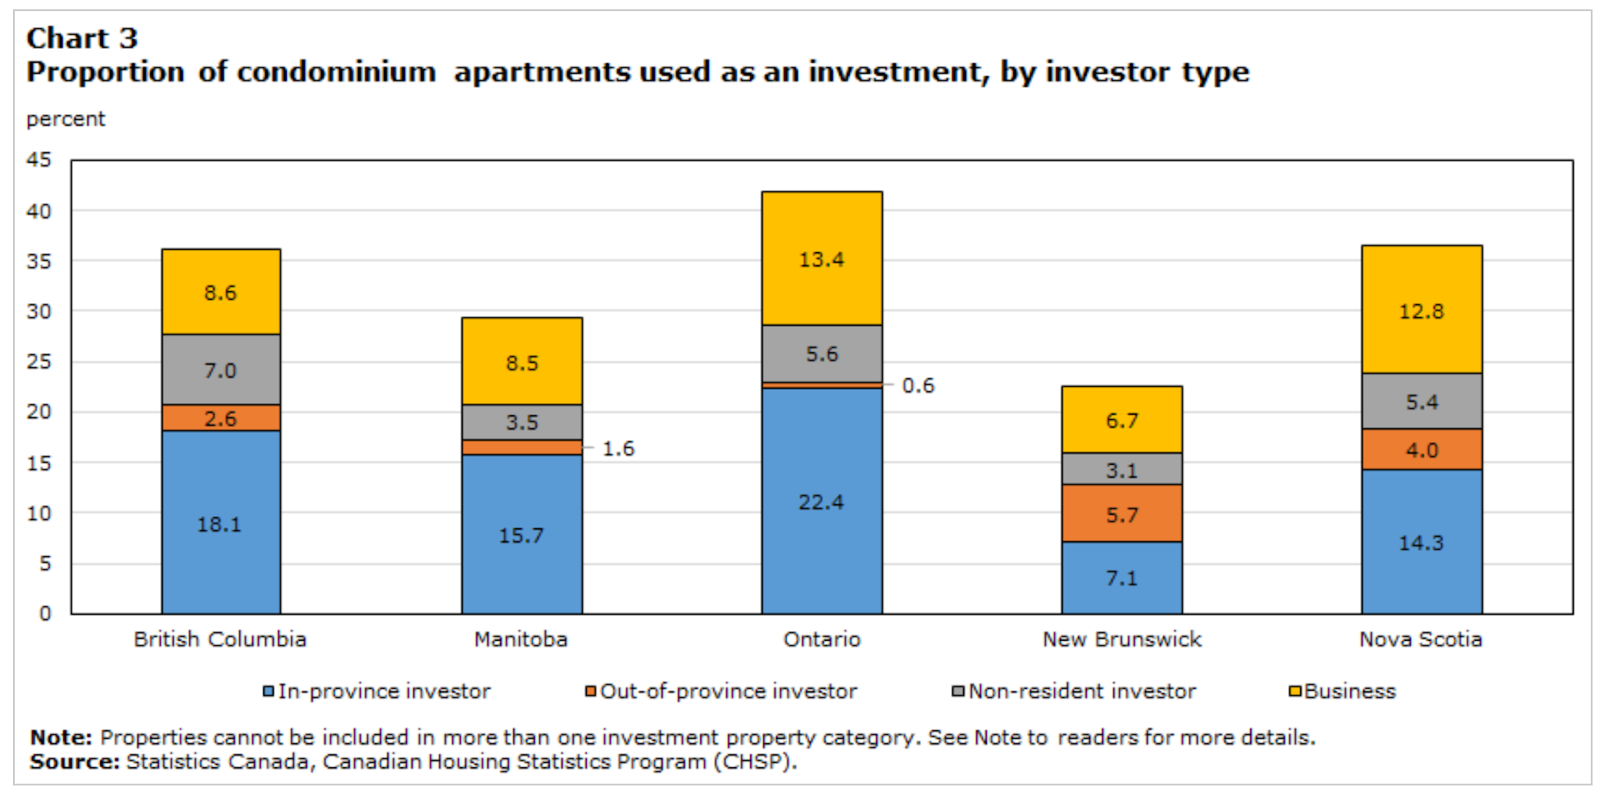
Statistics Canada found that over 40% of condos in Ontario are owned by investors as seen in this chart.
These numbers have raised questions in the media about the role investors might have also played in our housing affordability crisis. However, I think that saying that investors are the cause of high home prices is too simplistic.
Instead, I think this high level of real estate investment is a symptom of a country that did not prioritize the construction of permanent rental housing for decades, leaving a big gap in rental housing supply, which has been filled by, not only institutional and non-resident investors, but in province investors. As I know from my real estate practice and have written about previously,, many of these in-province investors are small-holding individuals and families (‘mom and pop’) investors who have either bought a condo or held onto their condos when moving to a new home in order to rent them out as investments.
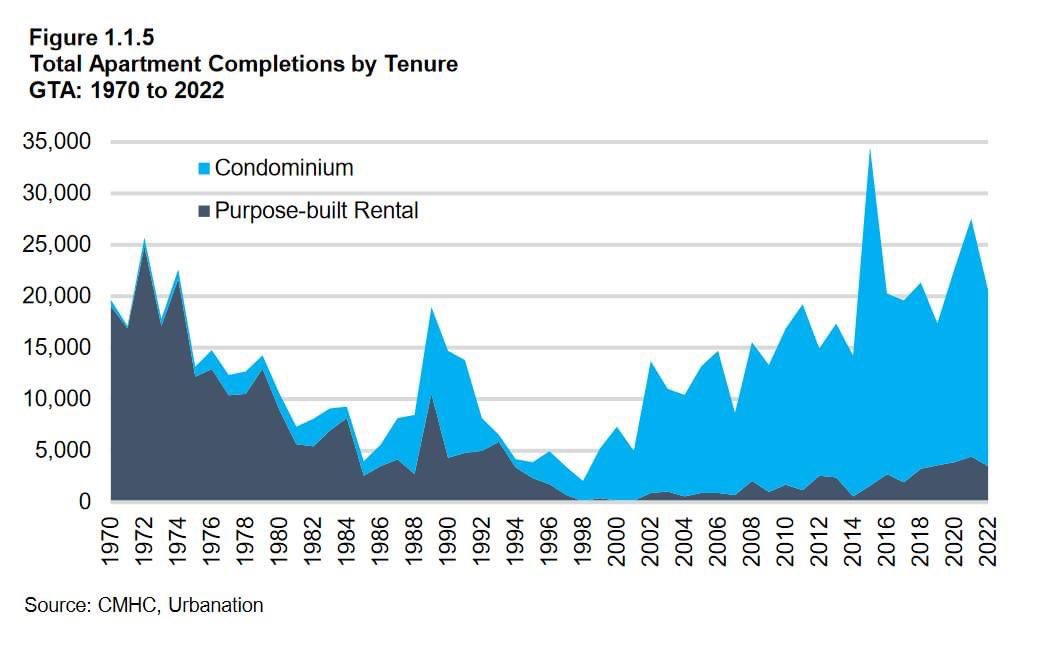
For many renters, today’s condos are yesterday’s apartment buildings.
We can see this gap in the supply of rental housing by looking at the number of rentals completed each year in Toronto against the number of condo completions.
The above chart is from a recent report by the Building Industry and Land Development association that looked into the gap in the supply of purpose built rental housing in Ontario.
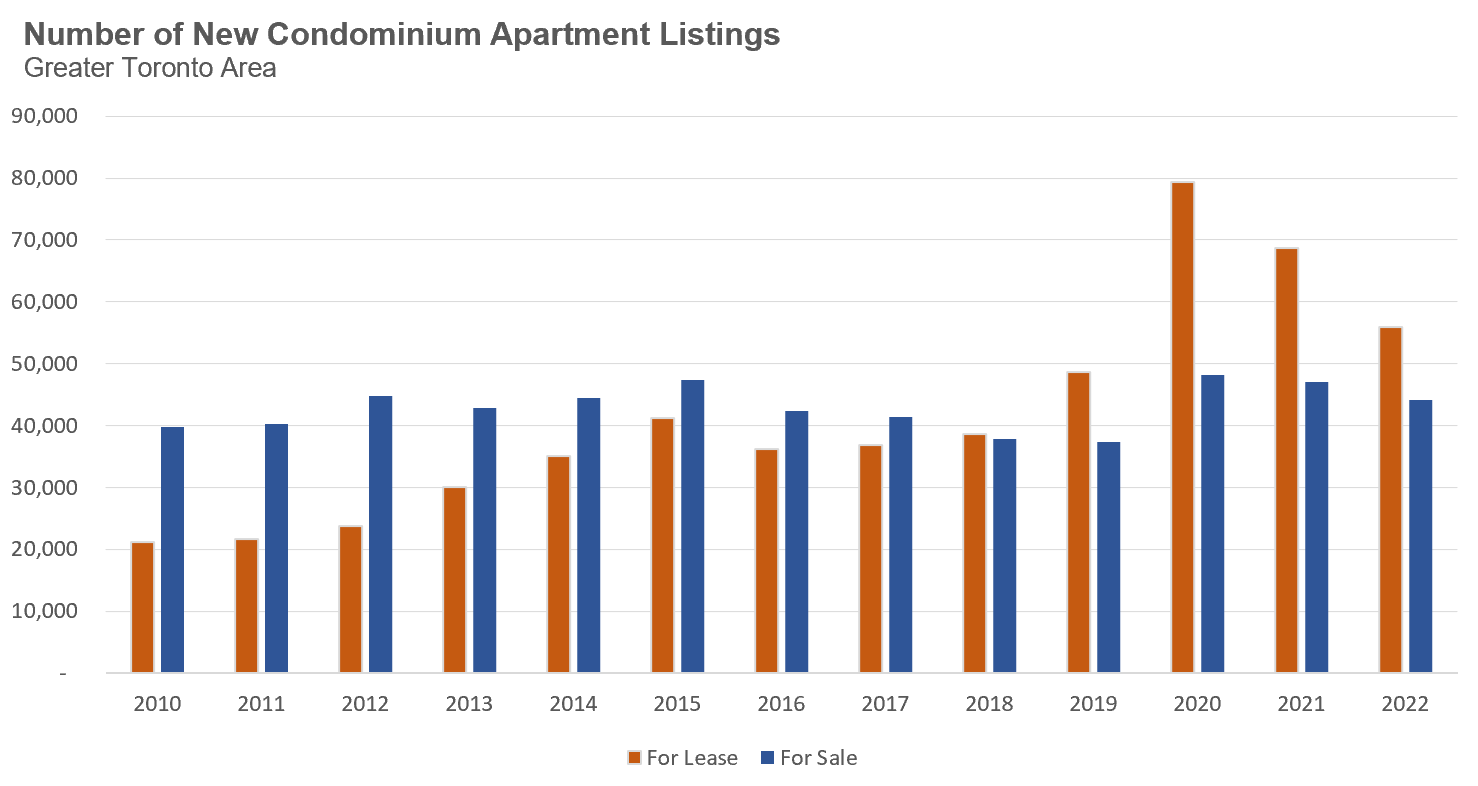
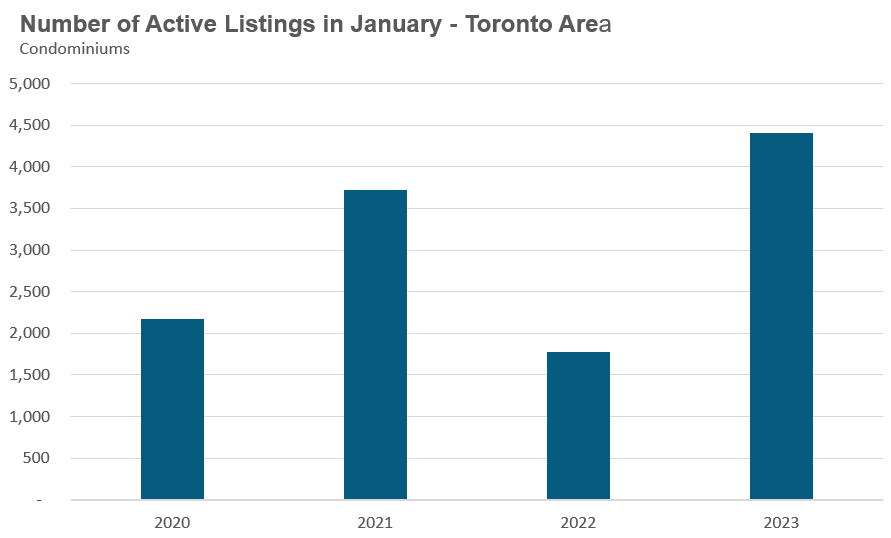
One way to see how the increase in investor-owned condominium units over time has impacted the market is by looking at the number of condominium units listed for lease each year which has accelerated significantly since 2019.
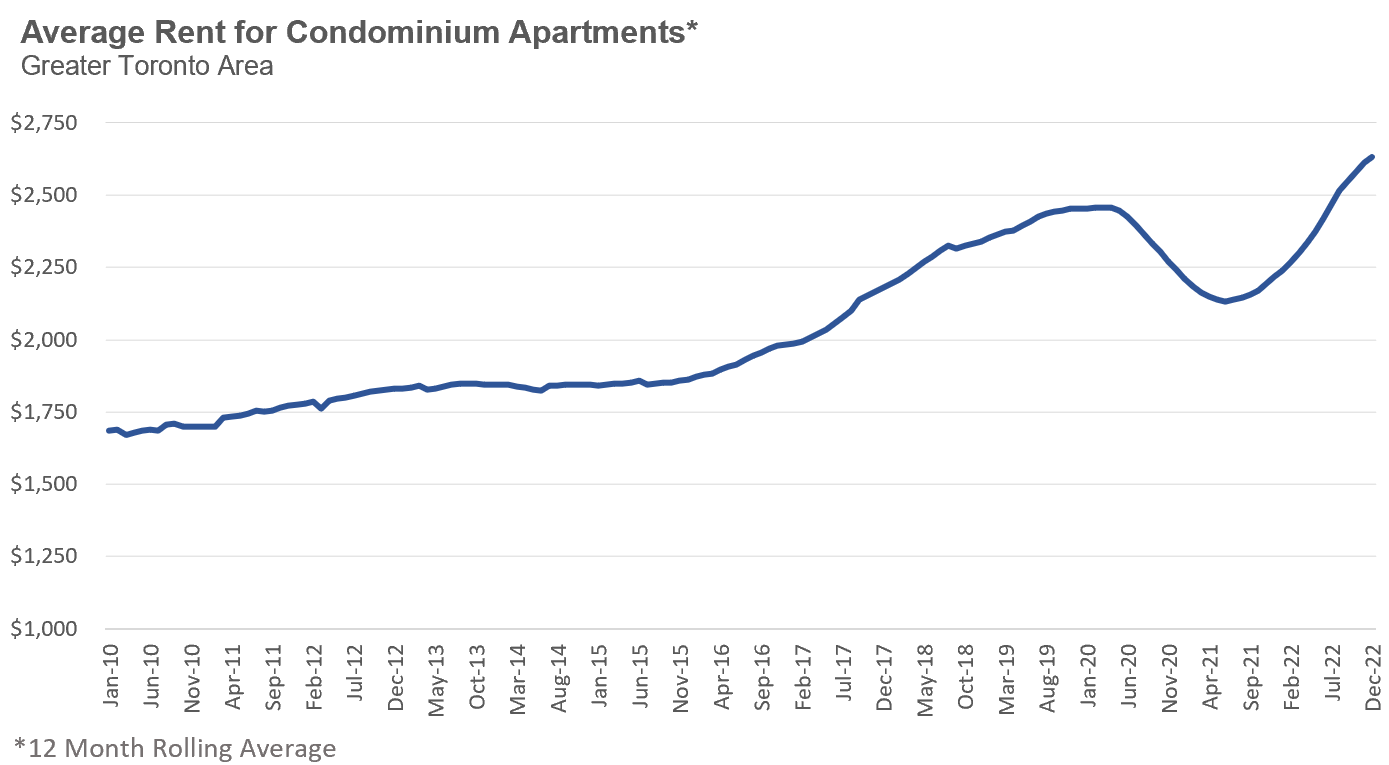
While strong demand from investors, as with any demand, can push condo prices higher, it’s worth remembering that investors are also providing much needed rental inventory in a market that hasn’t built any rental apartments. But despite this increase in condominium rental inventory from investors, this has not damped the change in the average price for a condominium rental. We can see from the chart below that average rents were rising gradually from 2010 until around 2015 but prices accelerated more rapidly between 2015 and 2020. Average rents fell at the start of COVID as many renters moved out of the downtown core but rents have since more than rebounded and are above pre-Covid levels.
As long as Canada’s policy makers continue to ignore the need for permanent rental housing, the gap in the supply of rentals will be filled by mom and pop investors, driving up condo prices.
This lack of foresight is no doubt adding to our housing affordability crisis, particularly for the young professionals and first-time buyers who in the recent past would have purchased condos as their first step onto the housing ladder.
In spite of the cold temperatures outside, many real estate professionals have been surprised by Toronto’s real estate market starting the year a bit hotter than expected.
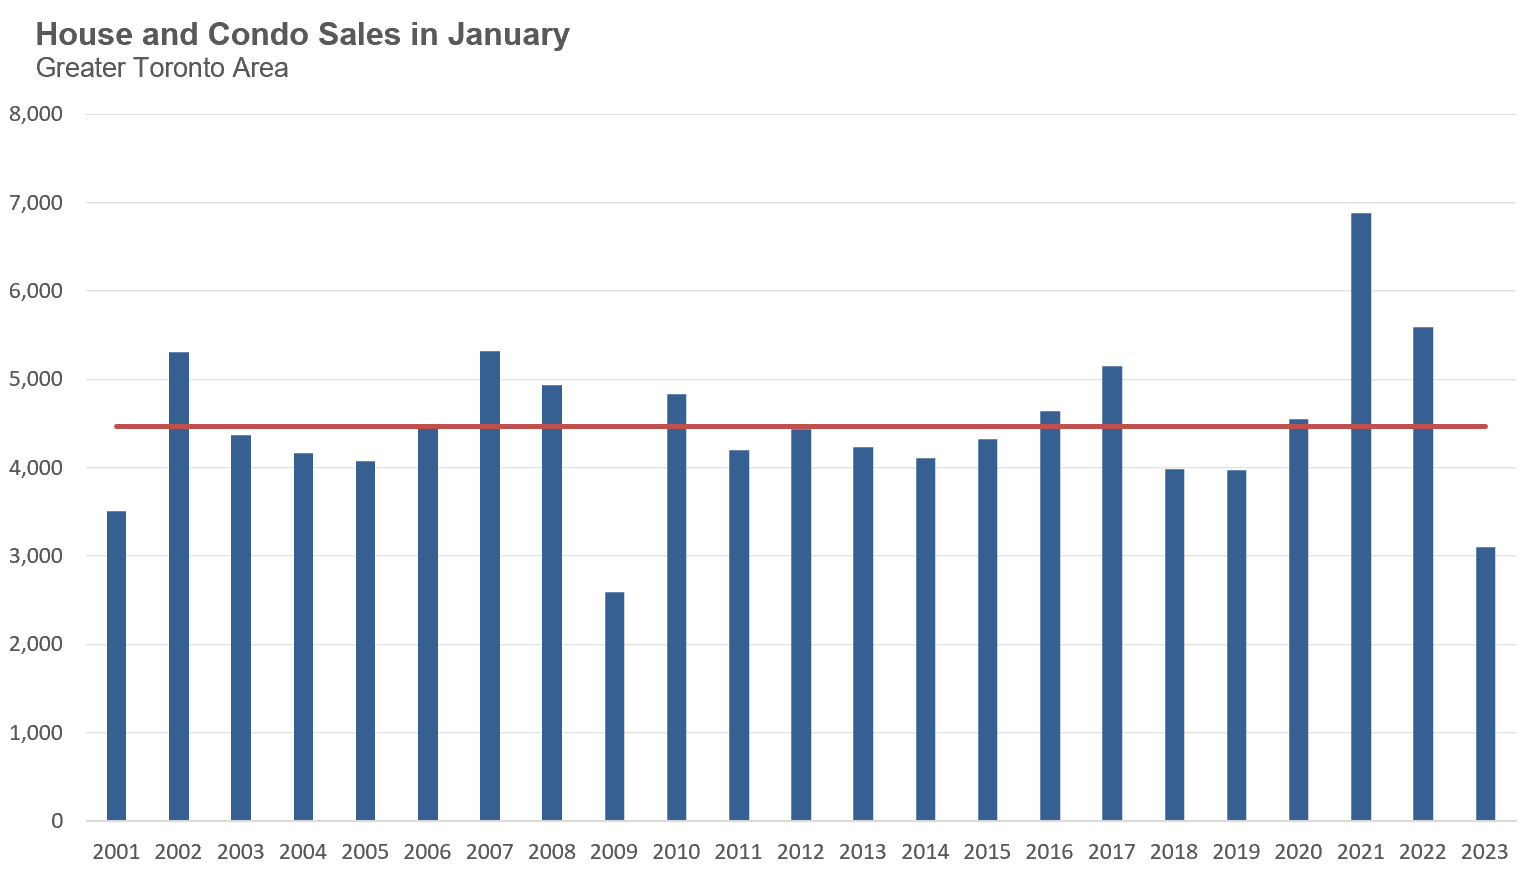
Home and condo sales in the Greater Toronto Area (Toronto Area or GTA) last month, January 2023, were the second lowest level for the month of January in twenty years. In fact, home sales in the GTA each month have been at an approximately 20-year low since the 2022 fall market.
Given these trends and along with the continued concerns about high interest rates and concerns about the overall economy, most real estate watchers went into 2023 expecting a very slow market to continue. However, on the ground, those of us active in the industry have been a bit surprised to see that market activity 2023 appears to have accelerated from the low levels we saw during the fall.
The two trends driving this are lower supply and increased demand. Let’s look at the supply side first.
During most housing downturns, a significant and sustained decline in home sales is usually followed by an increase in the inventory of homes available for sale. Inventory usually picks up because during downturns, declines in demand are not usually matched by a decline in new listings. In fact, it’s more often the case that new listings accelerate as some sellers and/or investors rush to exit the market before home prices cool even further.
But that’s not happening in the Toronto area right now. The decline in sales has been matched by an equally low level of new listings (new homes on the market listed for sale) which has kept inventory levels relatively low.
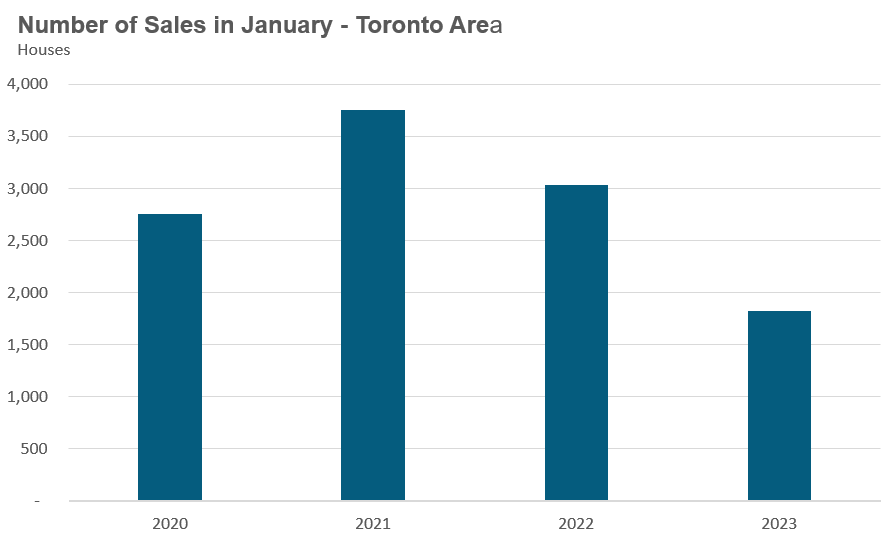
As you can see from the chart below, the number of new house and condo listings last month was the second lowest level for the month of January in 20 years.
On the demand side, I suspect much of this increase in demand is coming from buyers who were searching in 2022 and decided to hit pause on their home search expecting prices to continue to trend down rather than net new buyers entering the market. However, as average home prices continued to remain flat since July - rather than falling further - this relative stability in prices may have motivated some buyers to jump back into the market thinking the worst of the price declines are behind us.
Buyers right now largely fall into one of two categories. The first is reluctant/cautious buyers who are making very conservative offers on homes in part because they’re not sure if prices will fall further, and the second is more confident buyers who believe that price declines are behind us and are simply motivated to just buy a home and move on with their lives. This second group might be best captured by one of our buyer clients who recently told our agent Anastasia Spozito: “I like listening to John, but can we just buy a house already so I can stop hearing about Toronto’s housing market every single week?!”
““I like listening to John, but can we just buy a house already so I can stop hearing about Toronto’s housing market every single week?!””
- Buyer Client
Because there are so few desirable homes on the market, these (frustrated) optimists are setting the prices.
As this strong demand for homes meets the low volume of new listings on the market, we have started to see more homes receiving multiple offers and selling for more than the owner’s list price. While most homes are selling for a price that is still within the property’s market value, I have started to see some sale prices that are above this value, a trend we often see when buyer demand is stronger than supply.
We have also noticed an increase in the number of older listings, properties that have been on the market since the fall, that are suddenly finding buyers. In response to a thread I shared on Twitter discussing my early observations about Toronto’s surprisingly competitive market in 2023, a recent home seller messaged me to share his recent experience.
When this seller originally listed his two bedroom condominium for sale in November, he got very few showings and even fewer offers. The offers that he did receive were all low-ball offers, 10% below his asking price. He eventually decided to take the condo off the market with the expectation that he would list it in the new year.
Within three days of re-listing his condo for sale last month, he received a dozen showings and three offers and the unit eventually sold for 5% above the owner’s list price. It’s worth noting that in neither instance did he list his unit for a lower than market value price in order to attract multiple offers - the condo was re-listed for the exact same price as in November, but demand was much higher in January and they just happened to get three buyers making offers at the same time.
What’s interesting about anecdotes like this, which are consistent with what I’m observing, is how the market sentiment has changed from one in which there were very few showings and low-ball offers to a market in which showings are strong and buyers are paying above the list price.
We can see this slight shift in the market by looking at micro trends in the data as well.
This next chart shows the percentage of low-rise homes each week that sold for more than the owner’s list price. This ratio has been accelerating since the start of the year and by early February 36% of homes sold for above the list price, the highest weekly level since the first week of July 2022.
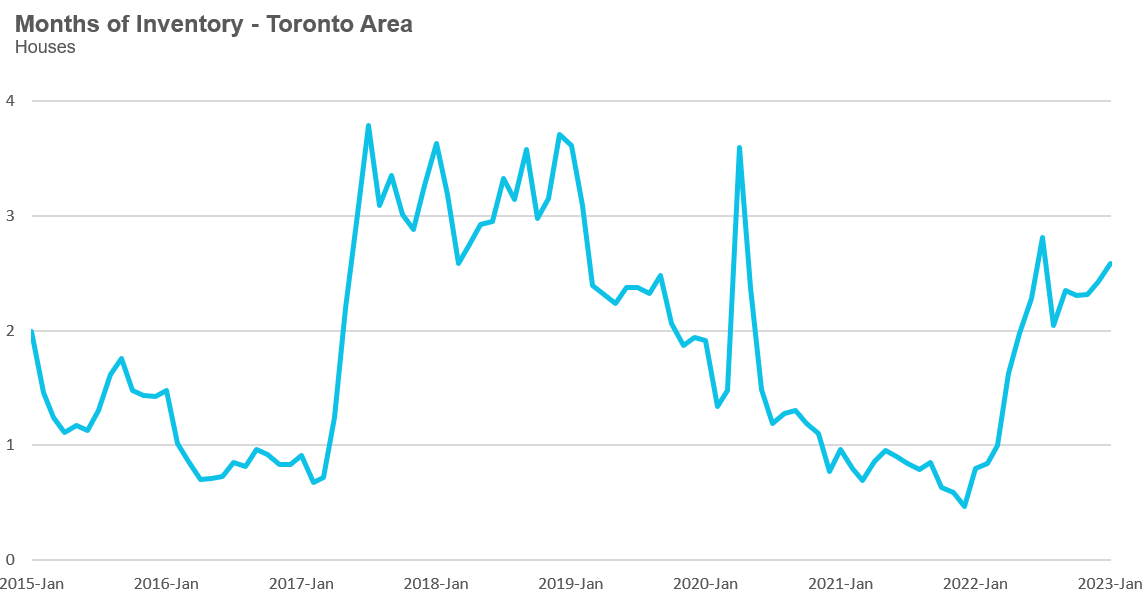
Looking at the months of inventory each week, we can see that inventory levels declined significantly during the last few weeks with inventory levels for houses falling below 2 months of inventory (MOI) while condo inventory levels dipped below 3 MOI.
It’s worth noting that the spike in MOI towards the end of December and early January was largely due to the very low volume of sales over the holiday season, which meant that listing homes stayed on the market longer - because of seasonal trends like this, we can’t read too much into a two-week trend, but it is noteworthy that inventory is trending down again.
Similarly, one or two sales above market value in a given neighbourhood doesn’t make a market, but if we continue to see buyers paying above market value this could gradually drive prices up in the weeks and months ahead.
Over the next few months, the volume of new listings will ultimately be the big factor determining how balanced the market is. If listings remain low, we could see continued pressure on home prices, possibly nudging them up slightly as buyers compete for the few listings coming on the market each week. But if listings accelerate, we could see competition for homes ease, taking some pressure off of buyers — and off of prices.
House sales (low-rise freehold detached, semi-detached, townhouse, etc.) in the Greater Toronto Area (GTA) in January 2023 were down 40% over the same month last year and well below historic sales volumes for the month of January.
New house listings in January were down 10% over last year and well below historic sales volumes for the month of January.
The number of houses available for sale (“active listings”) was up 94% when compared to the same month last year, but still well below pre-Covid levels for the month of January. It’s worth noting that the extremely low inventory levels during the first quarter of 2022 was due to a surge in demand as the market accelerated towards the peak in February 2022.
The Months of Inventory ratio (MOI) looks at the number of homes available for sale in a given month divided by the number of homes that sold in that month. It answers the following question: If no more homes came on the market for sale, how long would it take for all the existing homes on the market to sell given the current level of demand?
The higher the MOI, the cooler the market is. A balanced market (a market where prices are neither rising nor falling) is one where MOI is between four to six months. The lower the MOI, the more rapidly we would expect prices to rise.
While the current level of MOI gives us clues into how competitive the market is on-the-ground today, the direction it is moving in also gives us some clues into where the market may be heading.
The MOI for houses increased slightly to 2.6 MOI in January.
The share of houses selling for more than the owner’s asking price increased slightly to 28% in January.
The average price for a house in January was $1,272,381 in January 2023, well below the peak of $1,679,429 reached in February and down 22% when compared to the same month last year.
The median house price in January was $1,110,000, down 23% over last year, and below the peak of $1,485,000 reached in February.
The median is calculated by ordering all the sale prices in a given month and then selecting the price that is in the midpoint of that list such that half of all home sales were above that price and half are below that price. Economists often prefer the median price over the average because it is less sensitive to big increases in the sale of high-end or low-end homes in a given month which can skew the average price.
Condo (condominiums, including condo apartments, condo townhouses, etc.) sales in the Toronto area in January 2023 were down 52% over last year and well below pre-COVID sales volumes for the month of January.
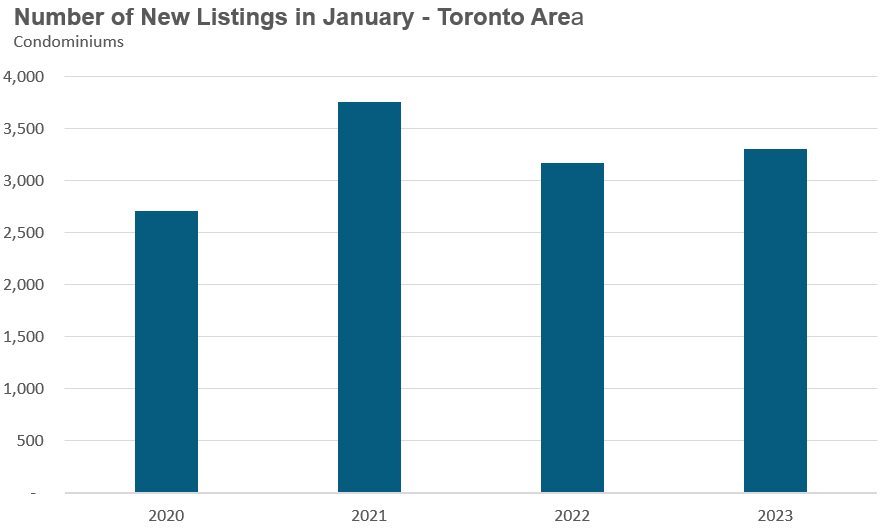
New condo listings were up 4% in January over last year.
The number of condos available for sale at the end of the month, or active listings, was up 149% over last year.
Condo inventory levels increased slightly to 3.8 MOI in January.
The share of condos selling for over the asking price remained unchanged at 17% in January.
The average price for a condo in January was $704,784, down from the peak of $840,444 in March, and down 10% over last year. The median price for a condo in January was $638,000, down 12% over last year, and down from the March peak of $777,000.

Houses
Average prices were down over last year across all five regions with Peel, Durham and Halton seeing the biggest decline in prices. Sales were down significantly across all regions and inventory levels were well ahead of last year’s level.
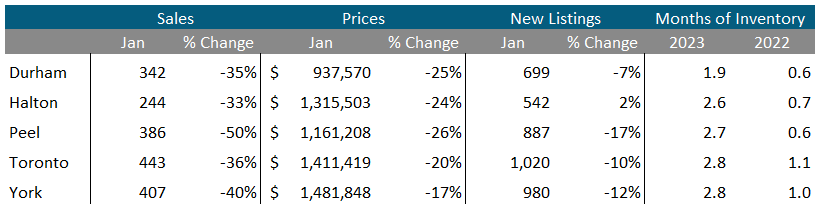
Condos
Average condo prices were down over last year in Durham, Peel and Halton down, with Toronto and York seeing little change. Sales were down significantly across all regions and inventory levels were well ahead of last year’s level.
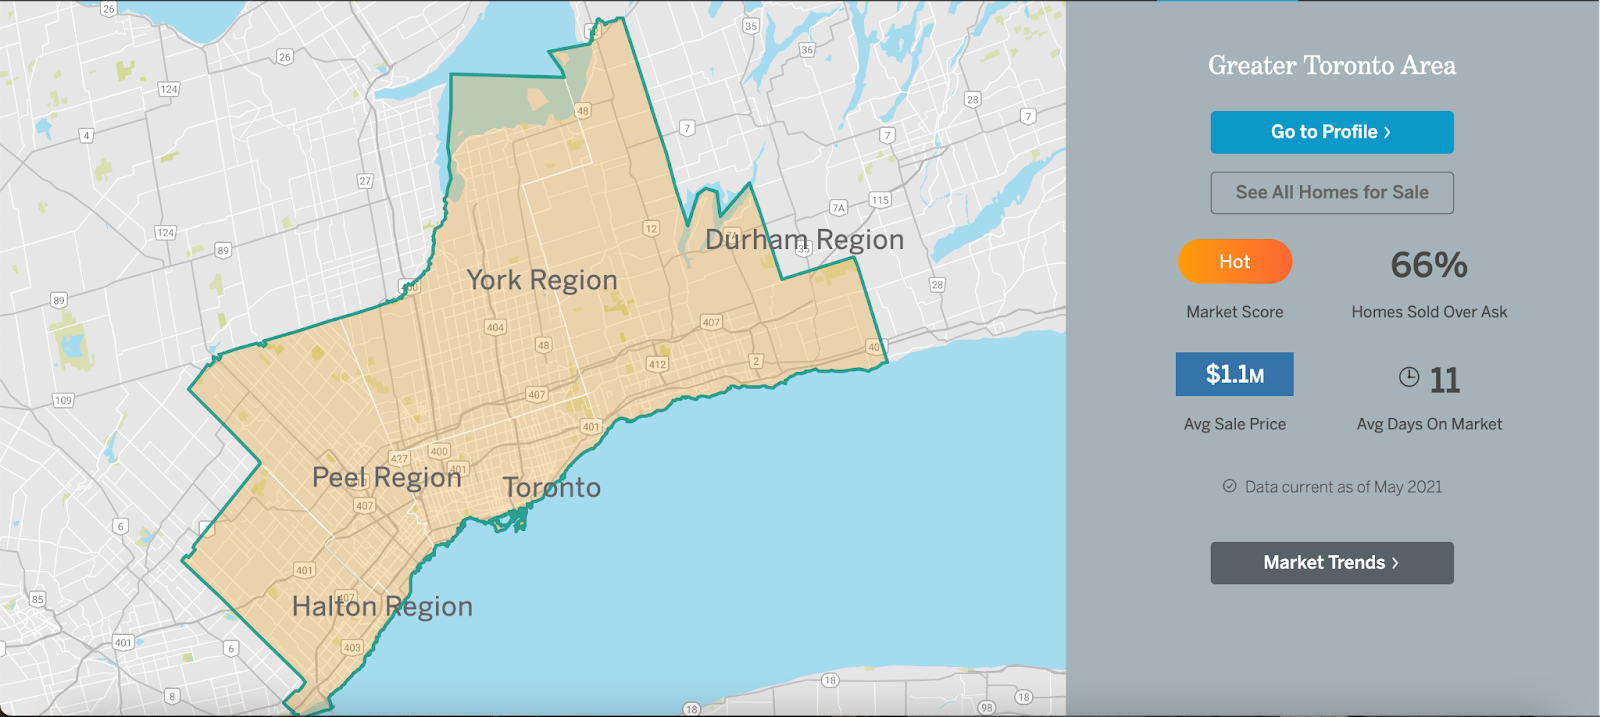
See Market Performance by Neighbourhood Map, All Toronto and the GTA
Greater Toronto Area Market Trends