While Toronto's condo market is showing signs of cooling, some units are performing better than others. But which units are performing well and which are a tougher sell in today's market?
One way to measure this Is to compare the current number of properties for sale against the number of homes that sold over the past month which gives us a metric called the Months of Inventory (MOI). The higher the MOI the more inventory there is relative to current demand suggesting a cooler market while a lower MOI suggests that properties are selling relatively quickly and demand remains strong.
Realtor Scott Ingram of Century 21 had the clever idea of analyzing the MOI in the condo market by unit size to see if there are differences in how over or undersupplied the condo market is by condo unit size. Scott's results were for the City of Toronto; I extended this analysis to the GTA and added last year's MOI results as well as a point of reference.
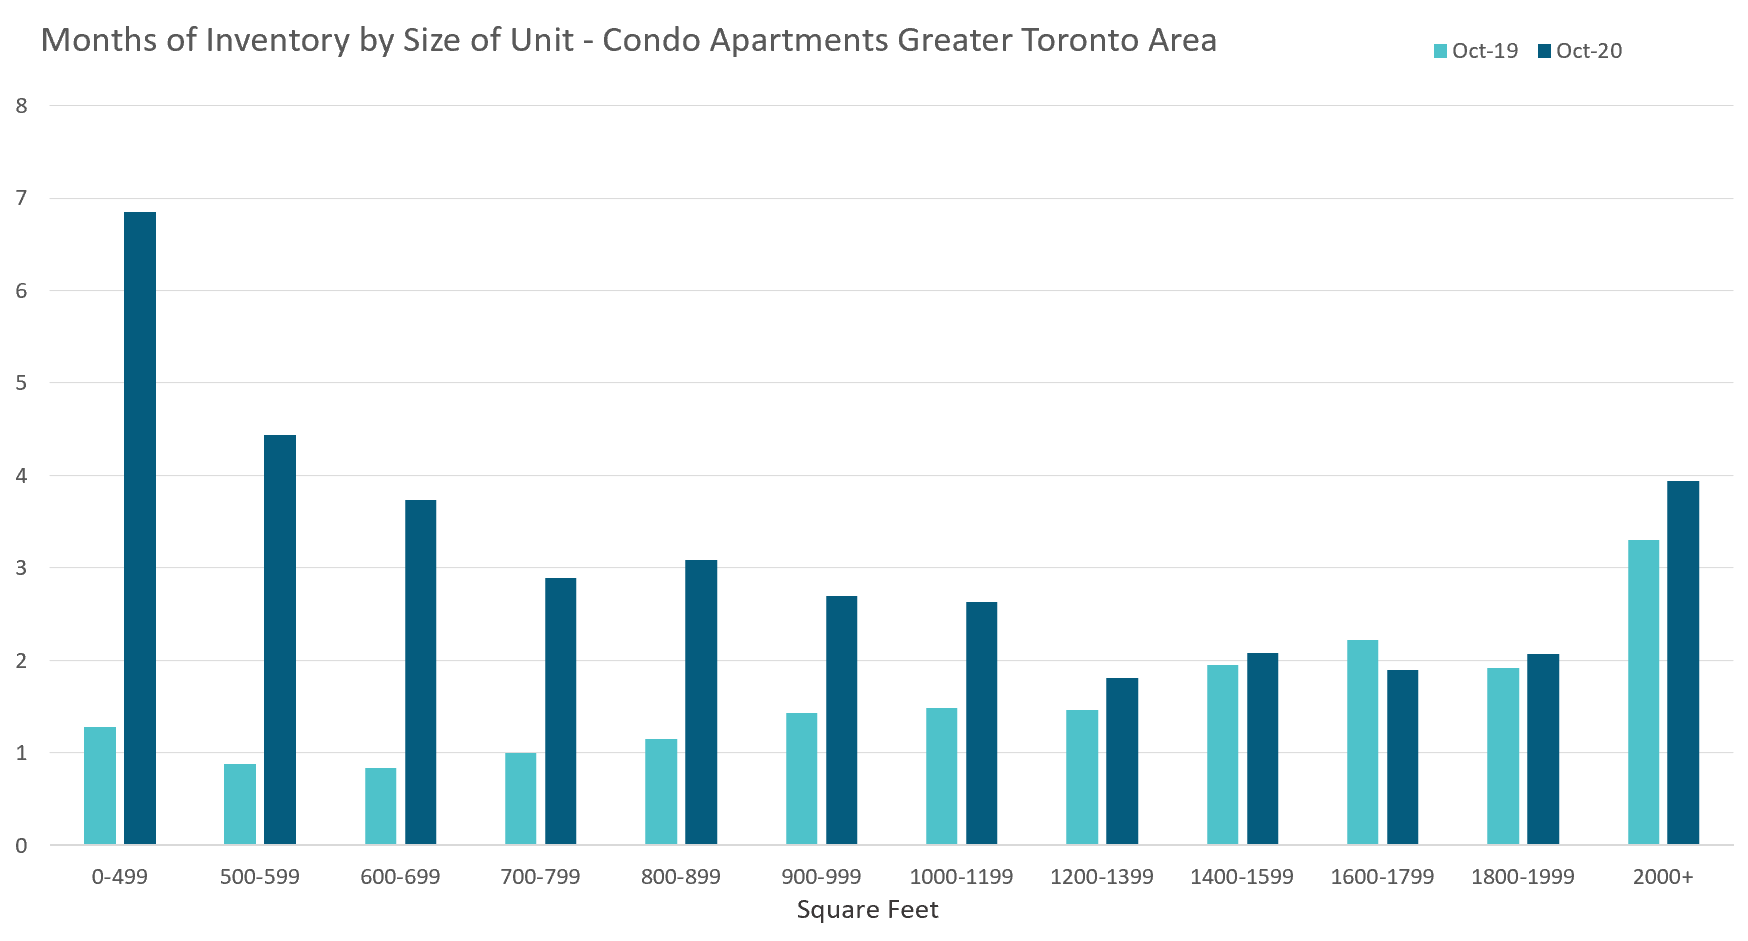
The light blue shows the MOI by unit size in October 2019. We can see that smaller units generally had the lowest level of inventory and inventory levels gradually increased as units got larger – a common trend since larger units also tend to be more expensive.
We see a very different pattern in 2020. The most oversupplied units in the condo market today are units that are smaller than 600sq ft. In fact, these units are more oversupplied and harder to sell than units that are over 2,000 sq ft in size which tend to be in the luxury segment.
We also see a U-shaped pattern in the MOI by unit size. Inventory levels decline as units get larger, reaching their lowest level in the 1,200-1,399 range before gradually increasing again as units get larger.
On the ground, this means that if you're a buyer looking for a 1,200-1,399 sq ft unit you're likely to find the market tightly supplied with units selling relatively quickly. If you're looking to buy a condo that is smaller than 500 sq ft, the supply of units significantly exceeds demand today.
This shift away from micro condos is likely due to a desire for larger living spaces as more people are working from home due to COVID restrictions.
These trends are noteworthy for a couple of reasons.
Firstly, there is historically a very close link between MOI and changes in price - the higher the MOI the more likely we are to see downward pressure on prices. If this trend continues into the future it suggests that we may end up seeing more downward pressure on very small condos while larger units may end up performing better.
The other reason this trend is noteworthy is because small condos make up a significant portion of the new condo supply that is coming on the market. More inventory of small condos from new condo completions could put even more downward pressure on prices.
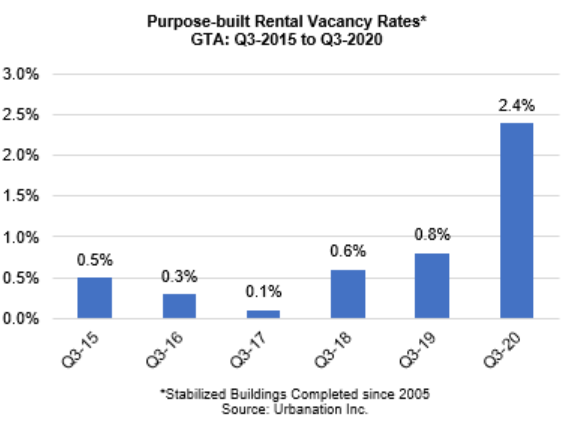
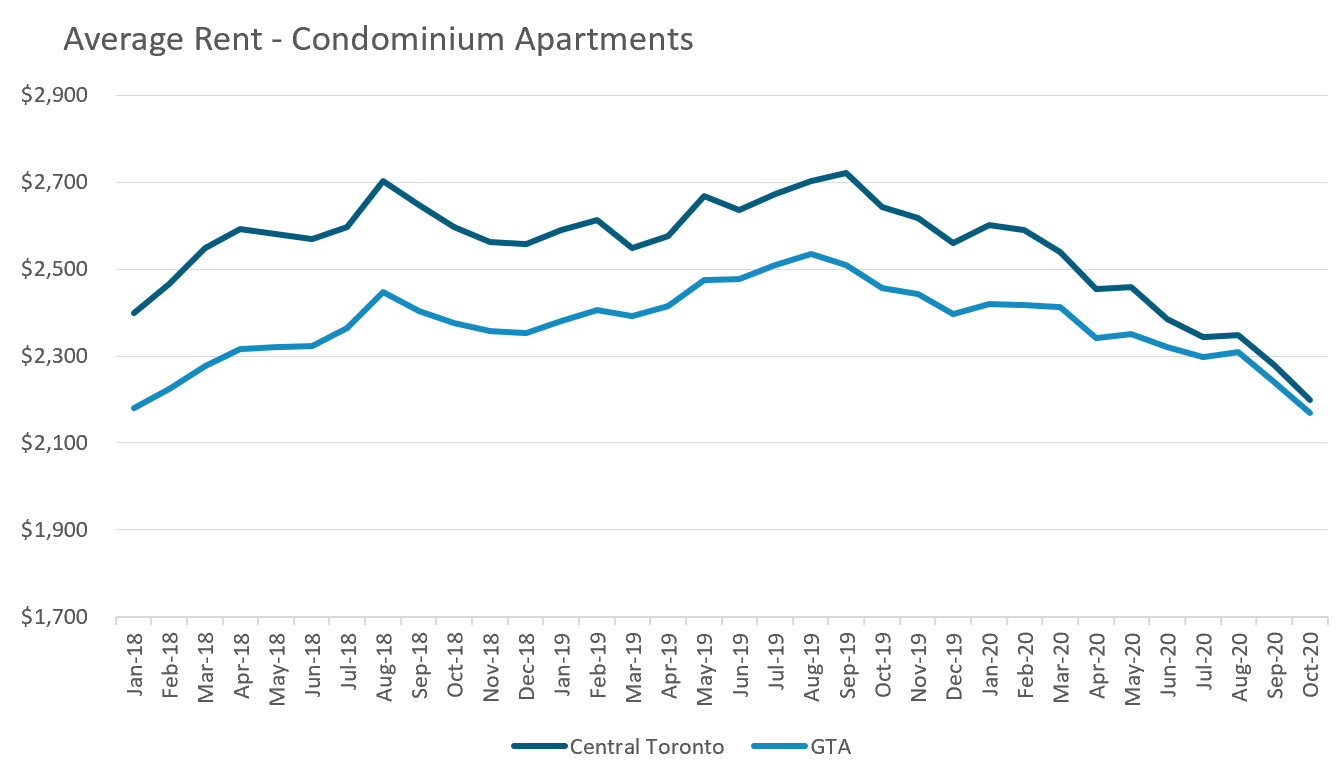
Vacancy rates for purpose built rental apartment buildings climbed from 0.8% in the third quarter of 2019 to 2.4% in the third quarter of 2020 according to research firm Urbanation. This pushed the average rents in the GTA down 5.8% while average rents in the former city of Toronto were down 9.3%.
When looking at the condo rental market, available inventory continued to climb in October to 12,219 units compared to just 3,941 a year earlier.
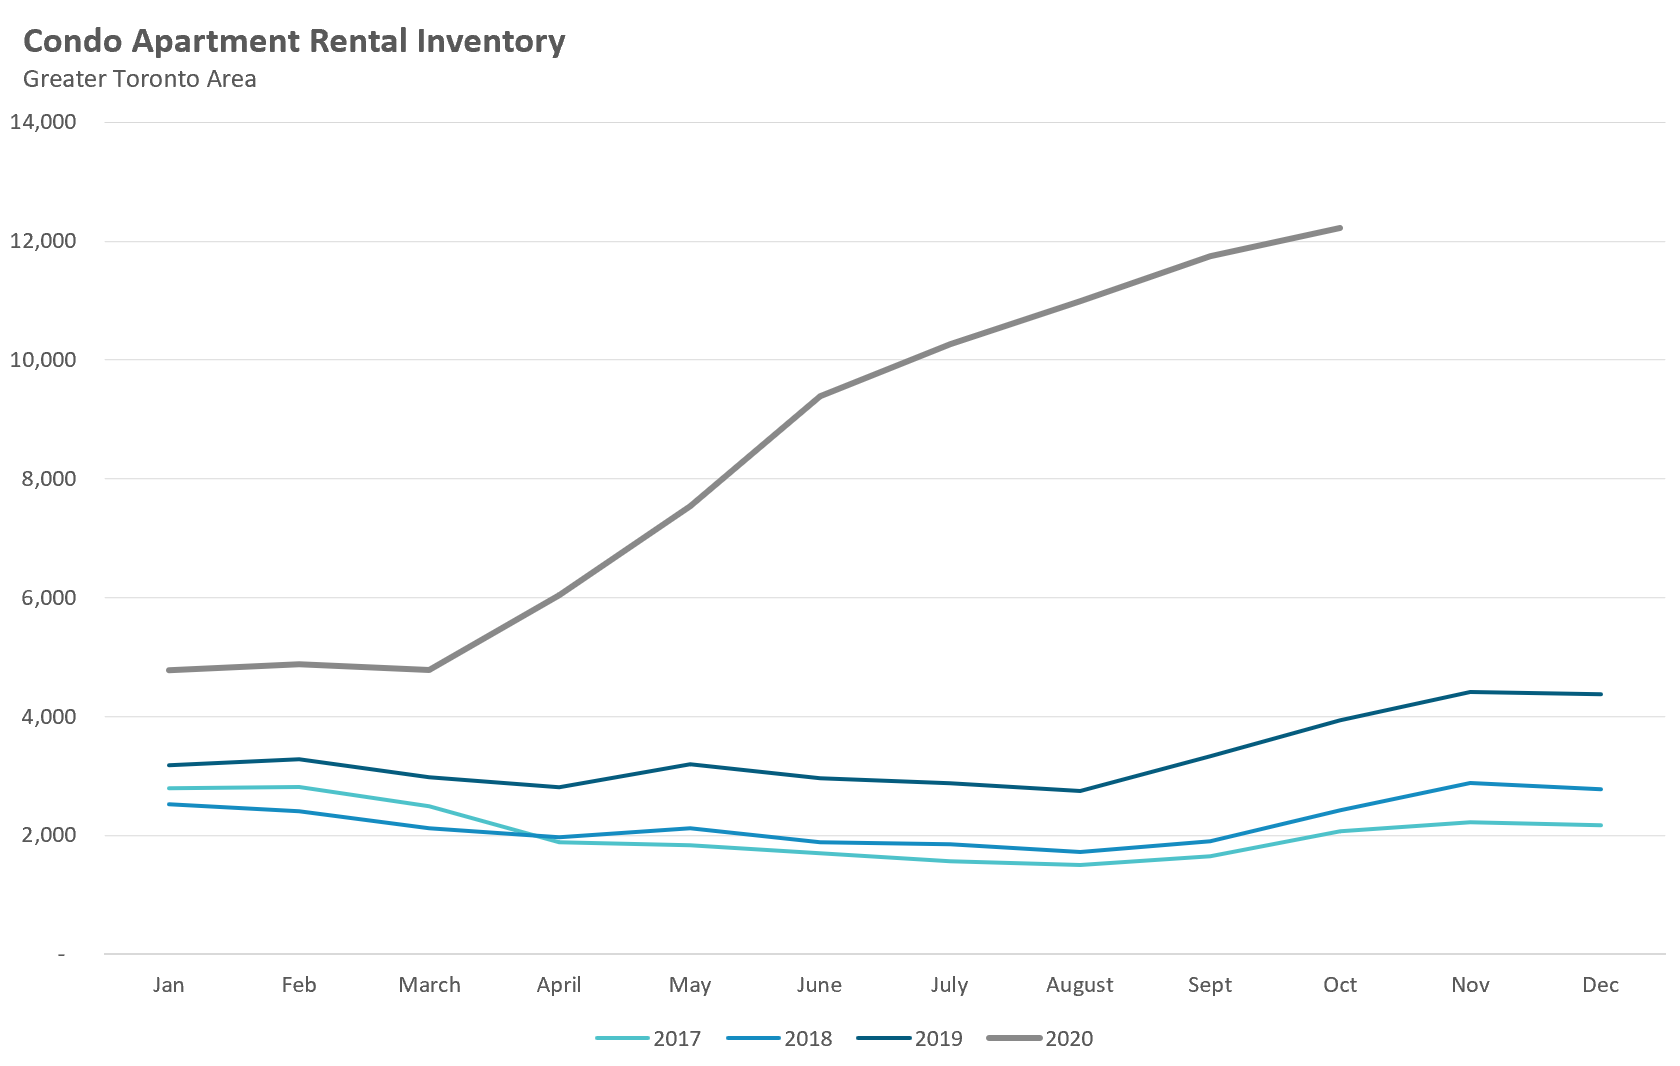
This high inventory has continued to put downward pressure on rents with average rents for condominium apartments in the old (core) City of Toronto down 17% in October over last year.
Hearing that Toronto home prices are setting records during a recession has left many wondering why home prices are surging given record levels of unemployment and lost income? The chart below from a recent article in the Globe and Mail can help answer this question.
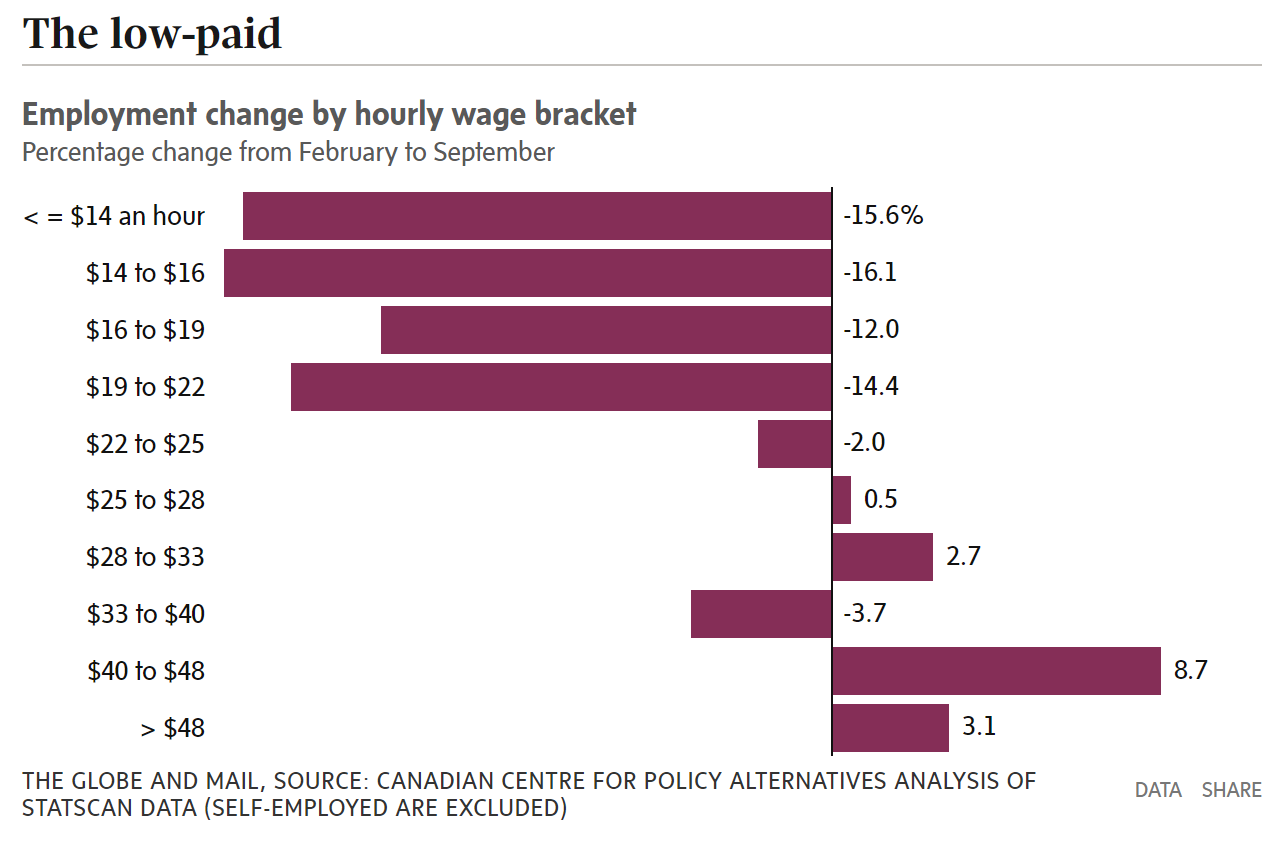
“The COVID-19 labour market can be broadly summarized: The more you earn, the less likely your employment was affected.”
Income earners who make less than $22 per hour have seen the biggest decline in employment since February and because lower income earners tend to rent rather than own their own homes, this is one factor contributing to the downward pressure on rents.
On the flip side, the more you earn the more likely you are to own your own home (or are planning to buy) which explains why demand for housing continues to remain strong despite Canada’s high unemployment rate.
In early October, Bloomberg published an article titled “Condo Listings Surge 215% in Signal of Downtown Toronto Weakness” while a couple of weeks later Livabl published an article titled “Toronto condo prices rise over 8% even as new listings surge”.
The Livabl article had a more optimistic tone quoting the Toronto Regional Real Estate Board's chief market analyst Jason Mercer saying that “there was still enough competition between buyers to support average selling prices substantially above last year’s levels.”
While this is technically true, it leaves one with the impression that condo prices are trending up when in fact average condo prices have been trending down over the past seven months.
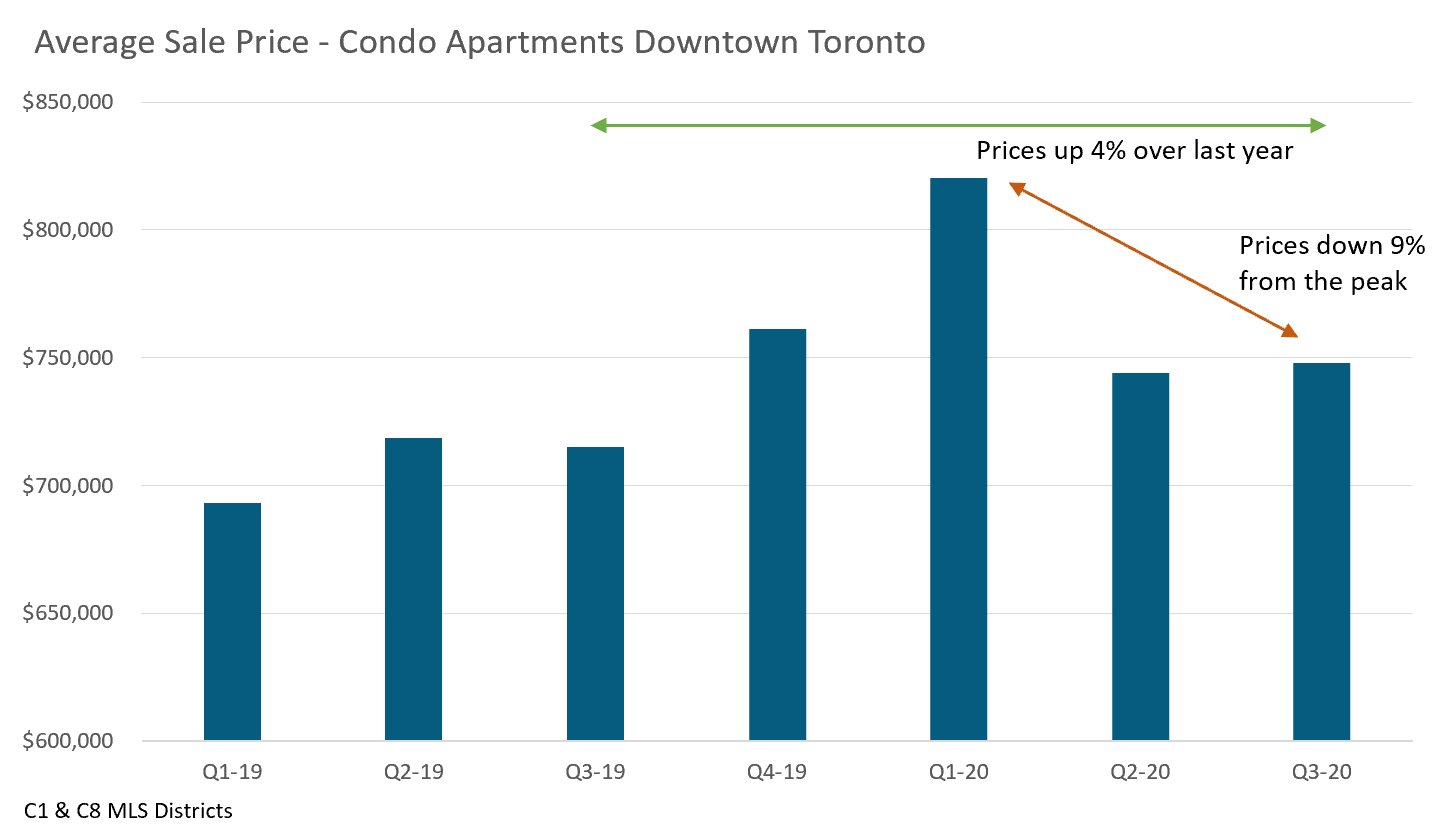
To better understand how prices can be up over last year, but still be trending down we’ll need to look at some data. To do this, I’m going to focus on the downtown Toronto condo market (the area south of Bloor between the DVP and Dufferin) since it’s the hardest hit area in the GTA.
The chart below shows the average price for condominium apartments for each quarter since the start of 2019.
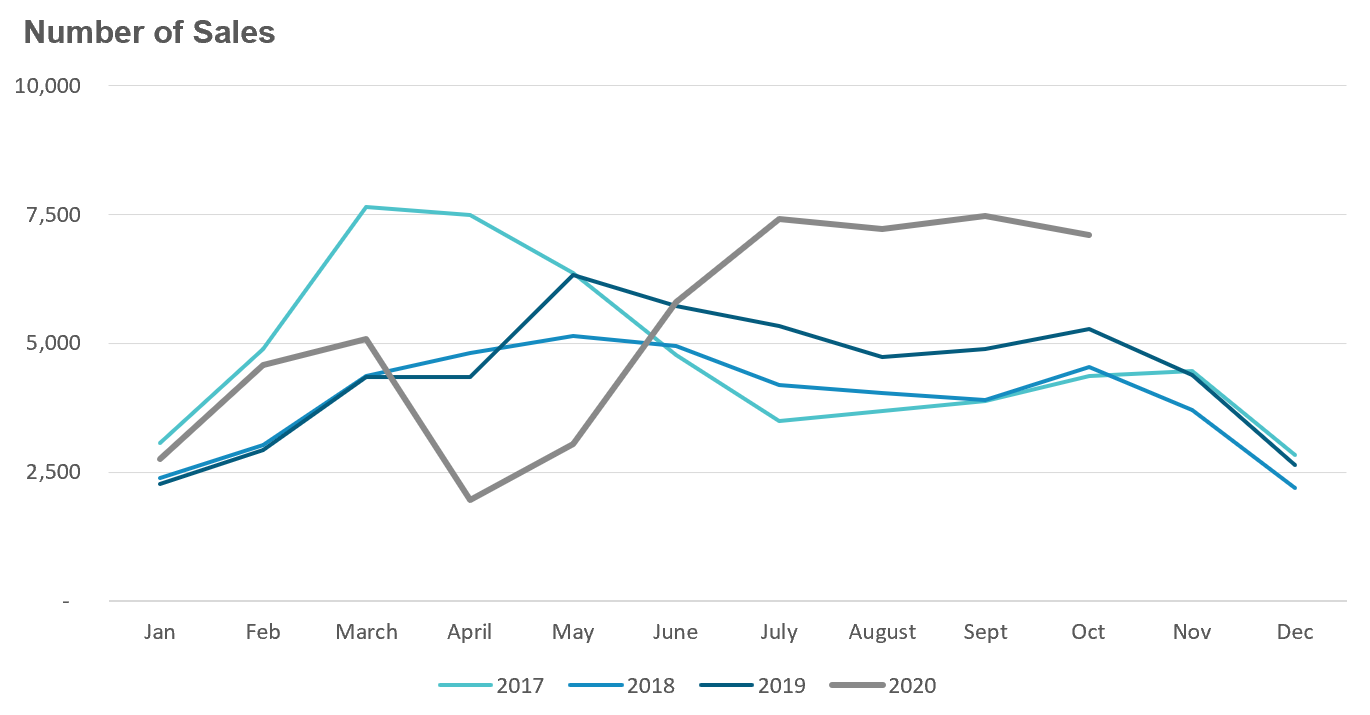
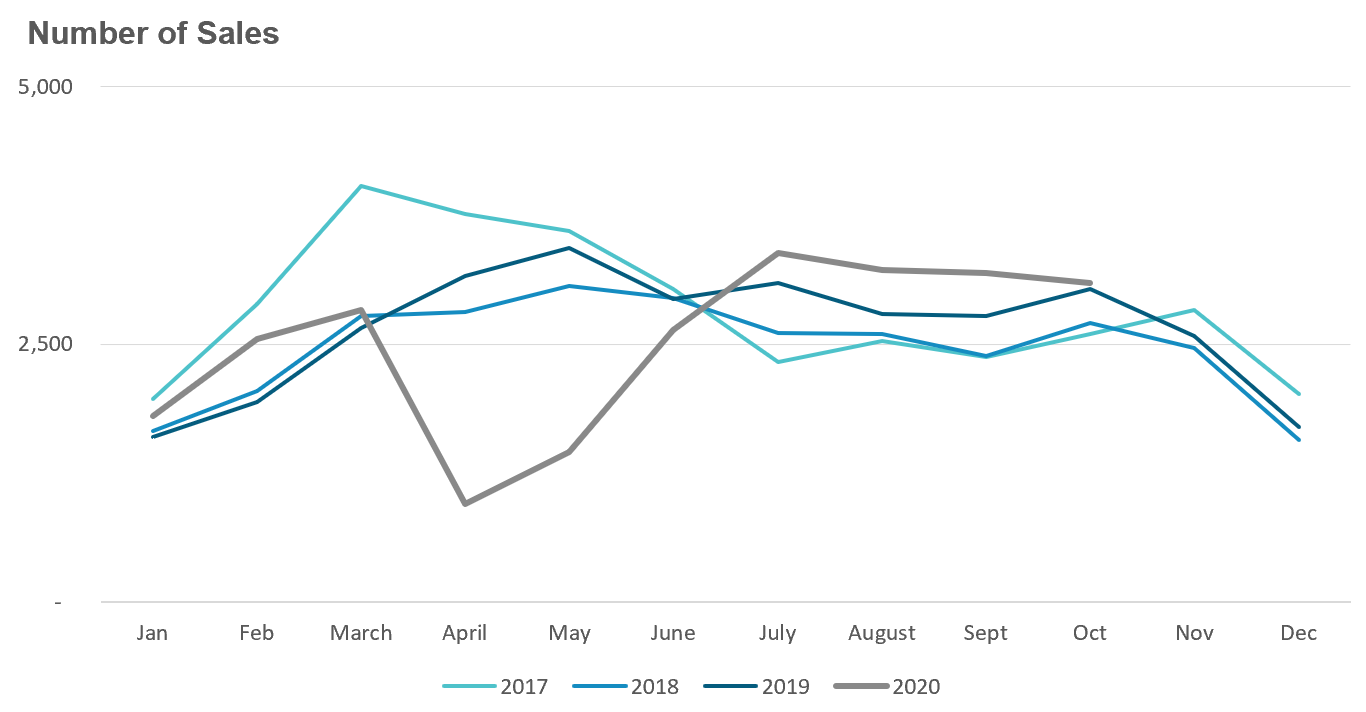
Year to date house sales in 2020 are up 14% over last year's sales volume.
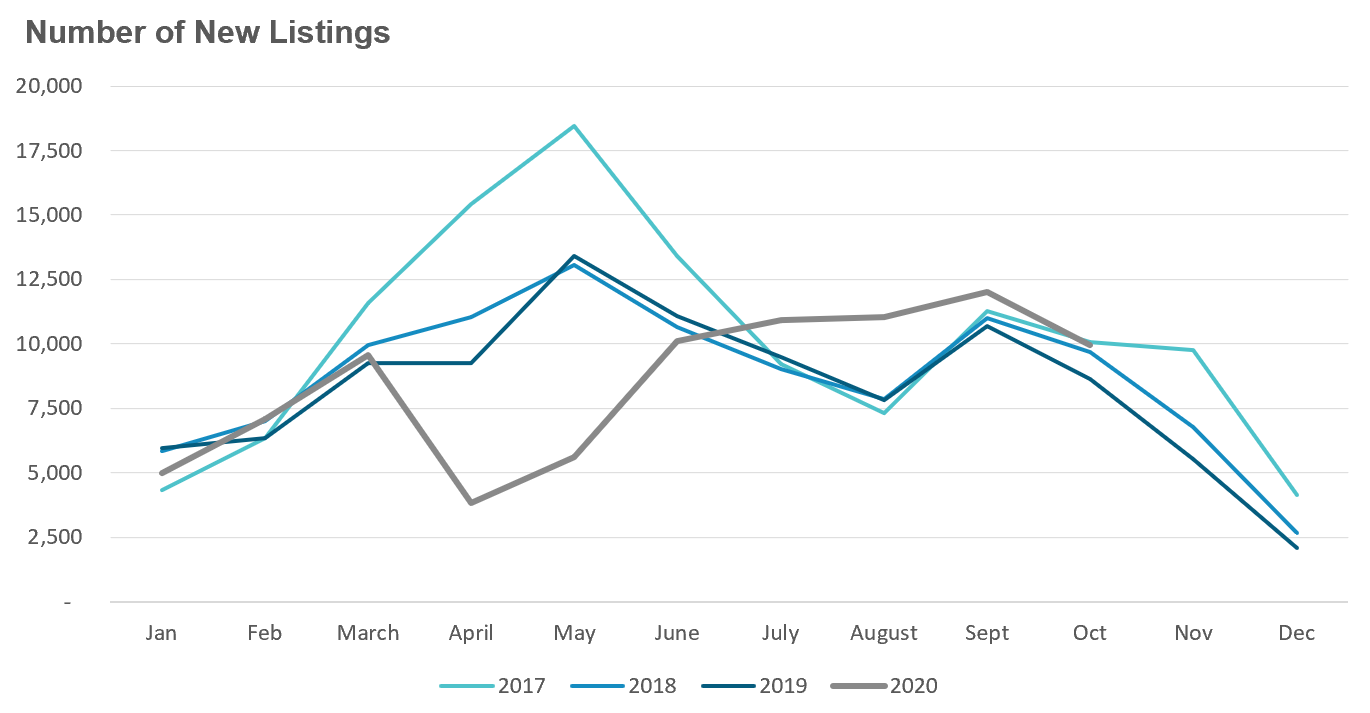
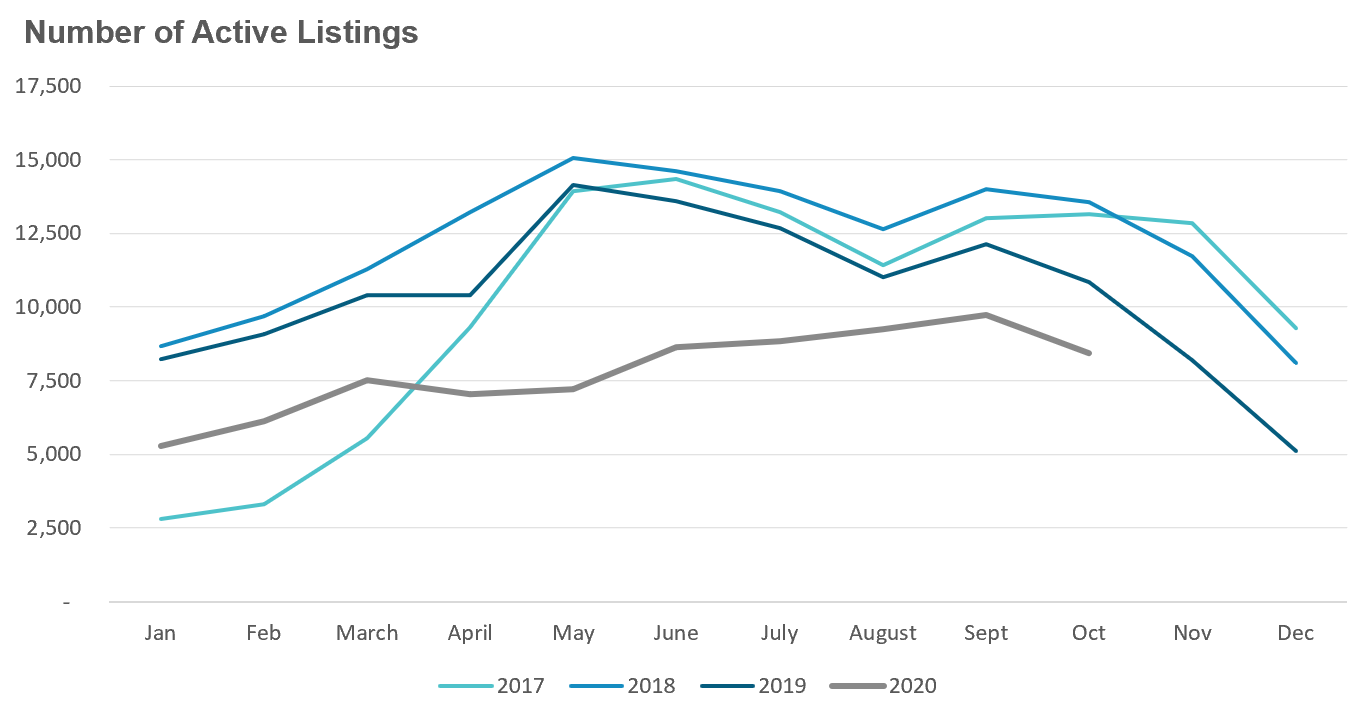
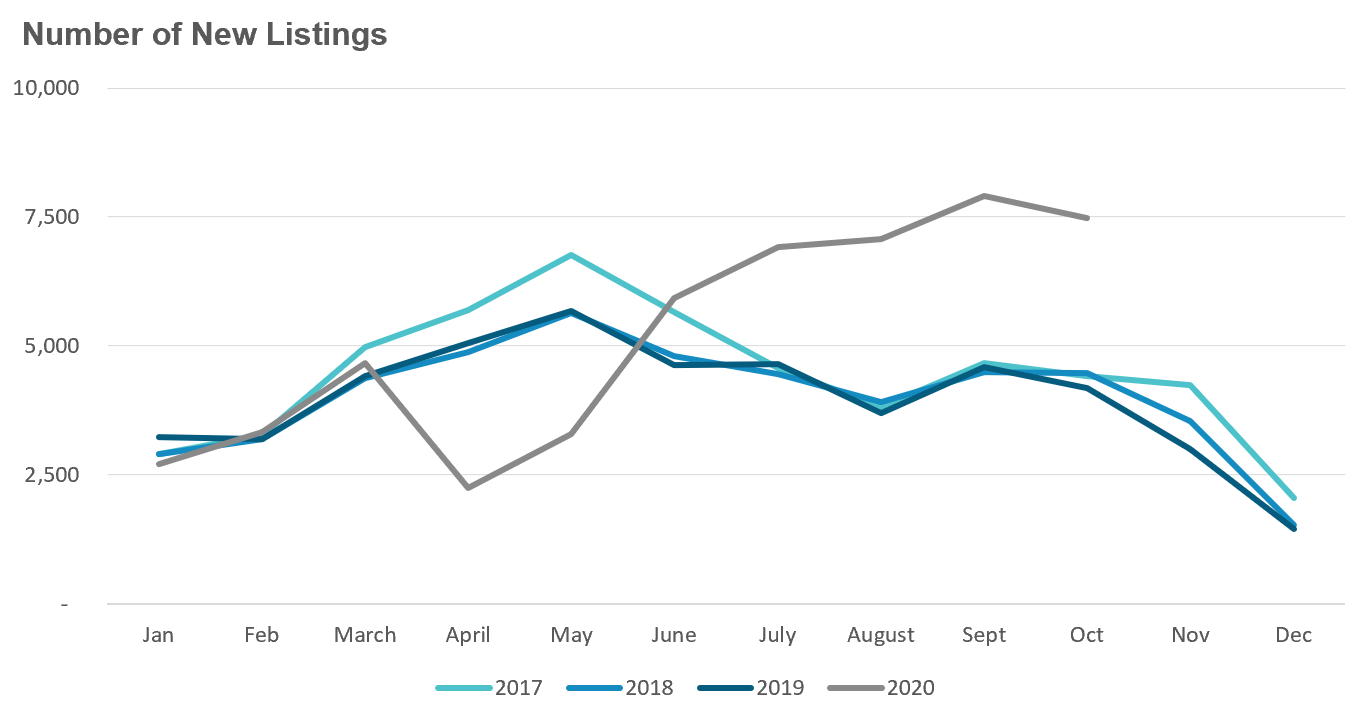
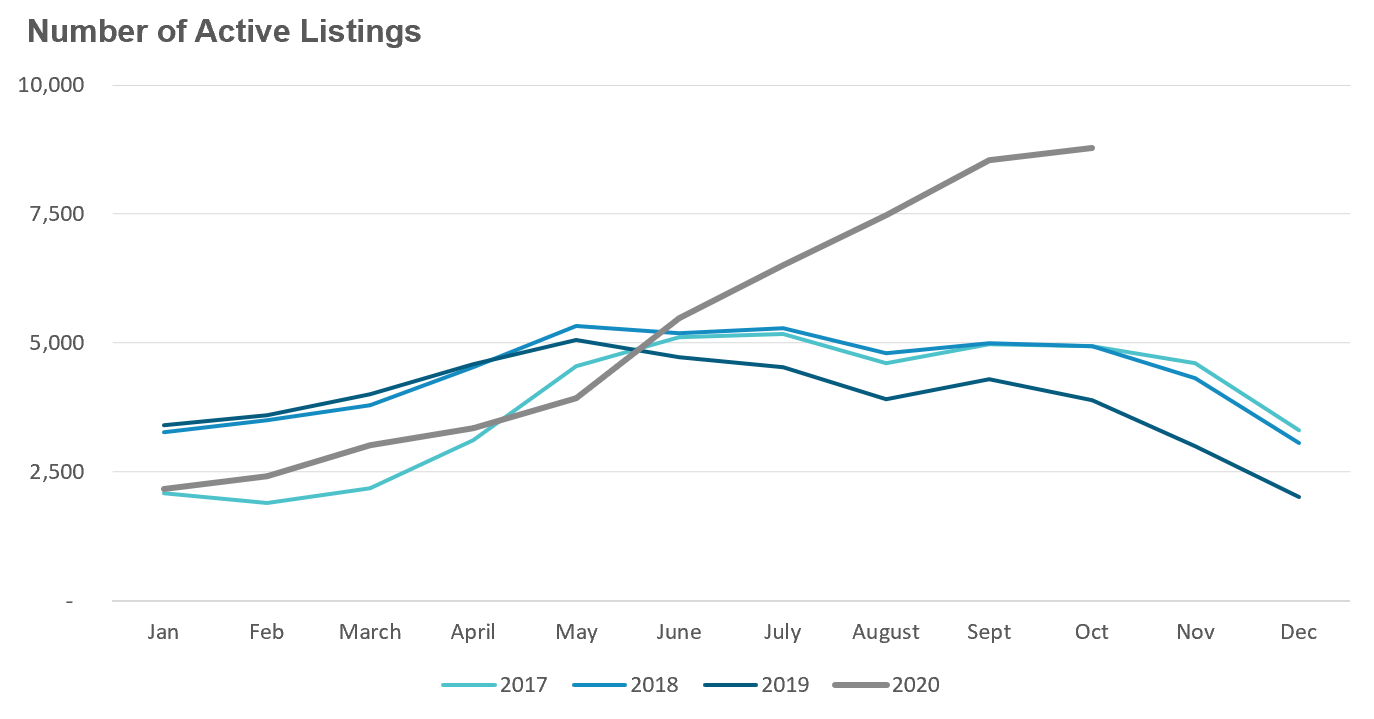
New listings did not keep up with the strong pace of demand. September saw a 15% increase in new listings over last year while the number of homes available for sale (“active listings”) was down 22% when compared to the same month last year.
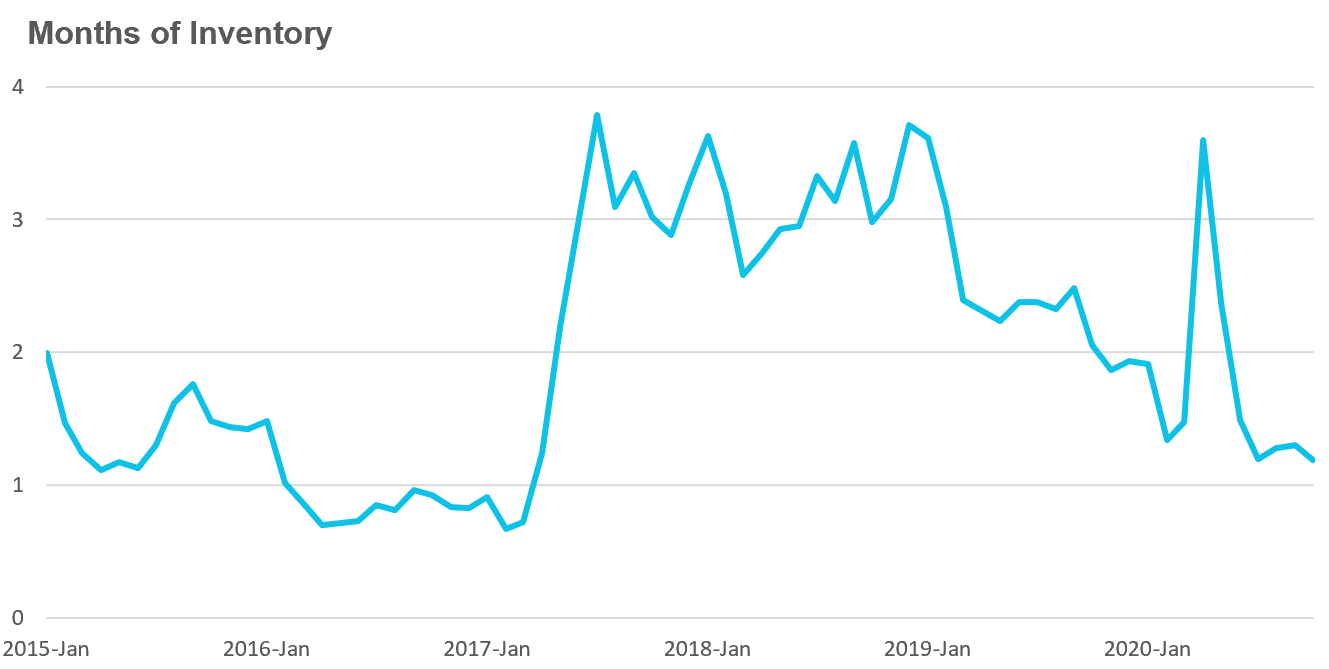
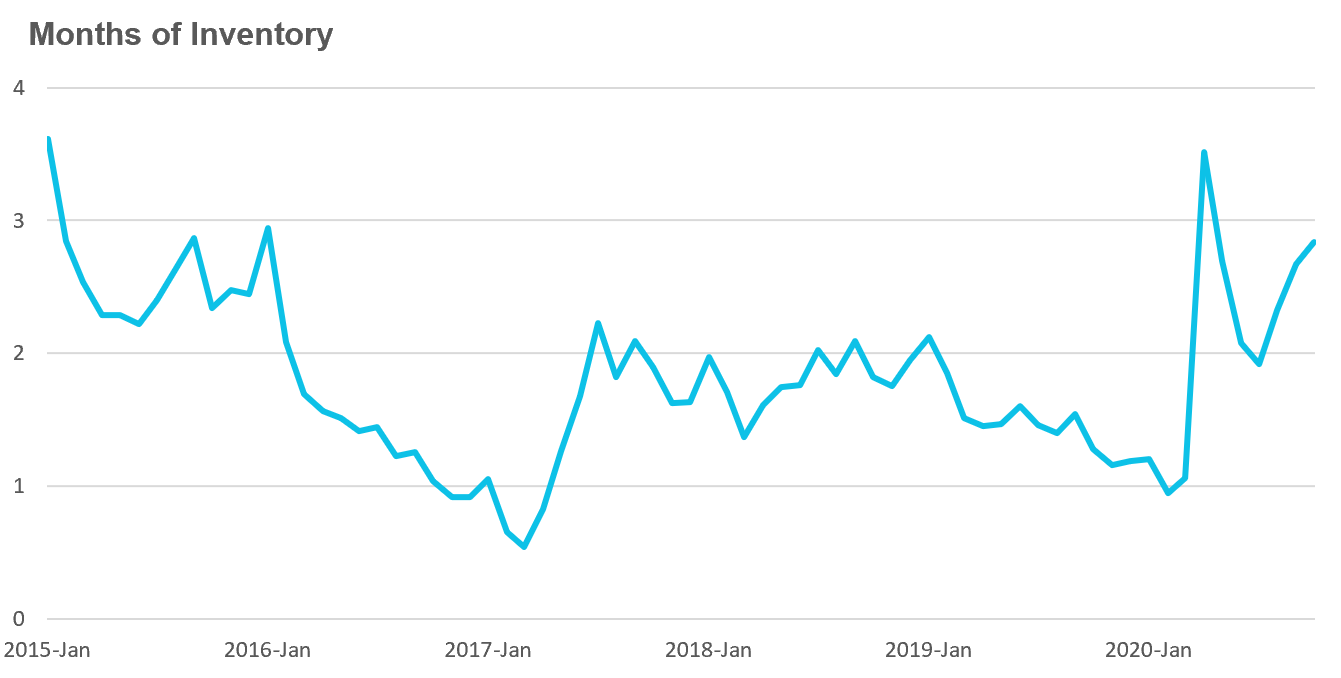
The Months of Inventory (MOI) looks at the number of homes available for sale in a given month divided by the number homes that sold in that month. It answers the following question: If no more homes came on the market for sale, how long would it take for all the existing homes on the market to sell given the current level of demand?
The higher the MOI, the cooler the market Is. A balanced market (a market where prices are neither rising or falling) is one where MOI is between 4-6 months. The lower the MOI, the more rapidly we would expect prices to rise.
The market remained very competitive in September with an MOI of just 1.2 months.
While the current level of the MOI gives us clues into how competitive the market Is on the ground today, the direction it's moving in also gives us some clues into where the market may be heading. The MOI has been relatively steady since July suggesting that the market is neither heating up or cooling down but remains a competitive seller's market.
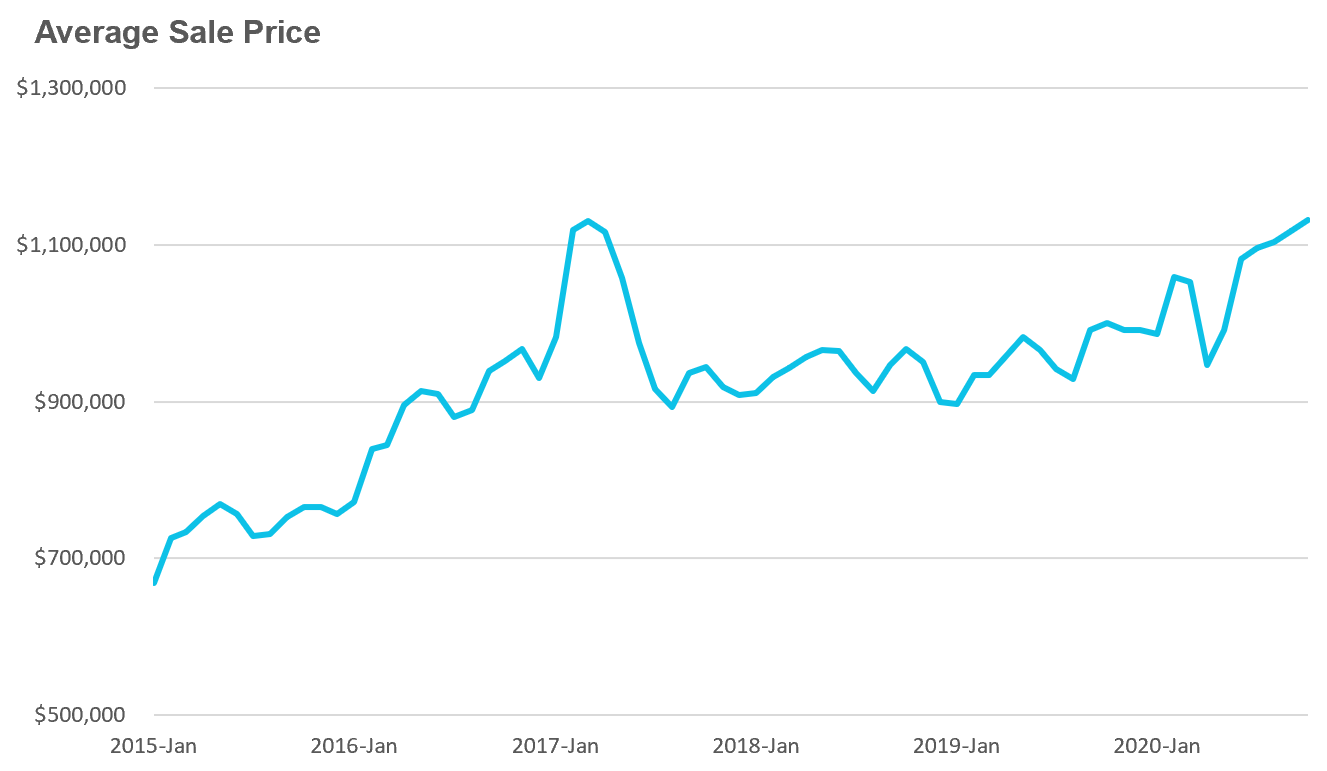
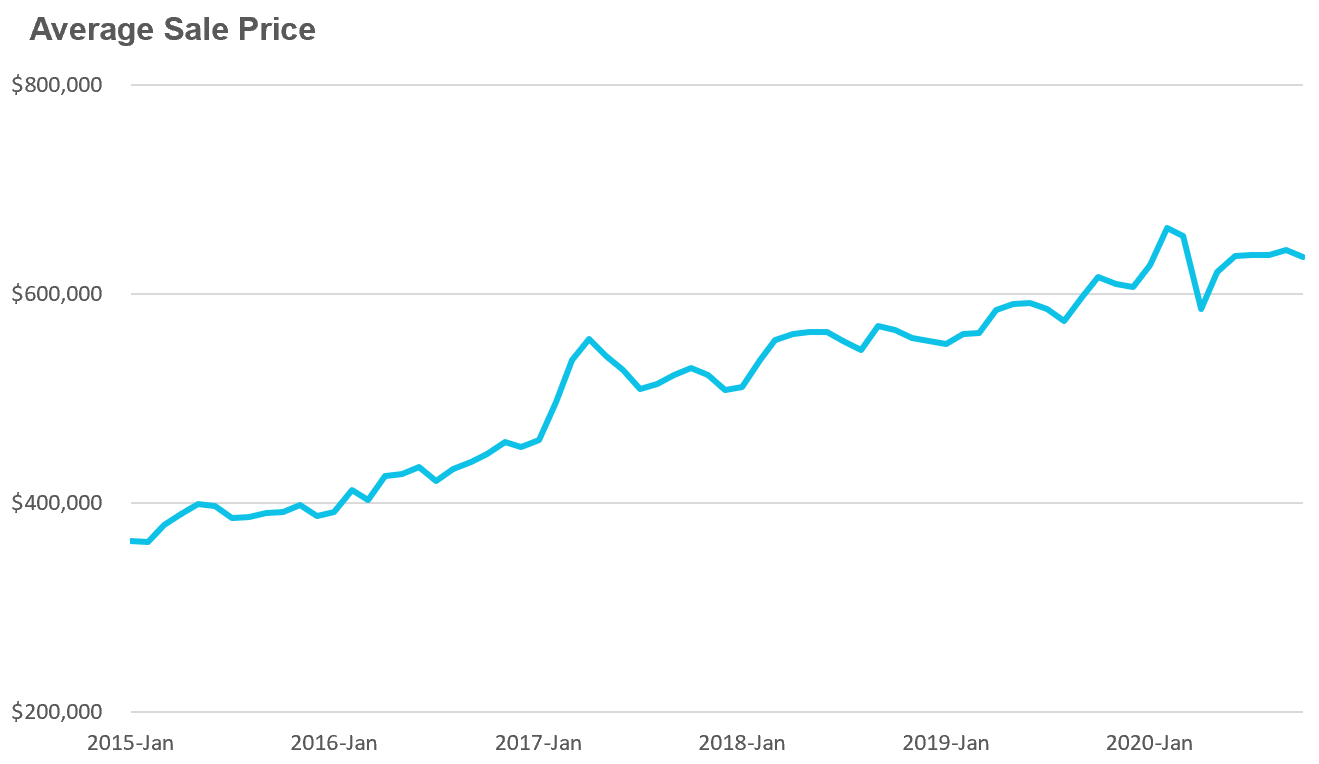
Strong demand coupled with very low inventory levels helped push average house prices up 13% over last year.
New condo listings were up by 79% in October which pushed the active number of condos available for sale in October up by 125% over last year.
This spike in inventory is leading to a cooling down in the condo market with the MOI increasing from just under 2 months in July to 2.8 in October.
Toronto area condo prices are up 3% over last year, but are down 4% from the peak reached in the first quarter.
It's worth noting that the downtown condo market is currently cooler than the rest of the GTA with an MOI of 5, and while average prices are still up over last year, they are down by approximately 9% from the peak prices reached during the first quarter.
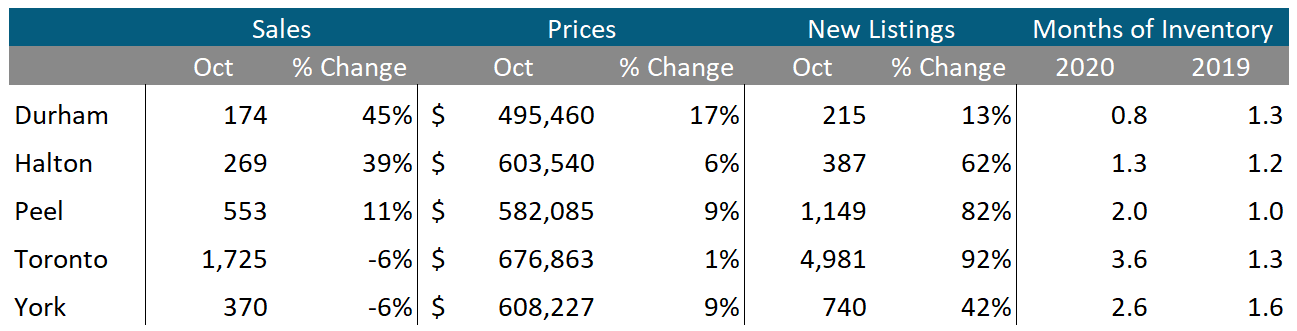
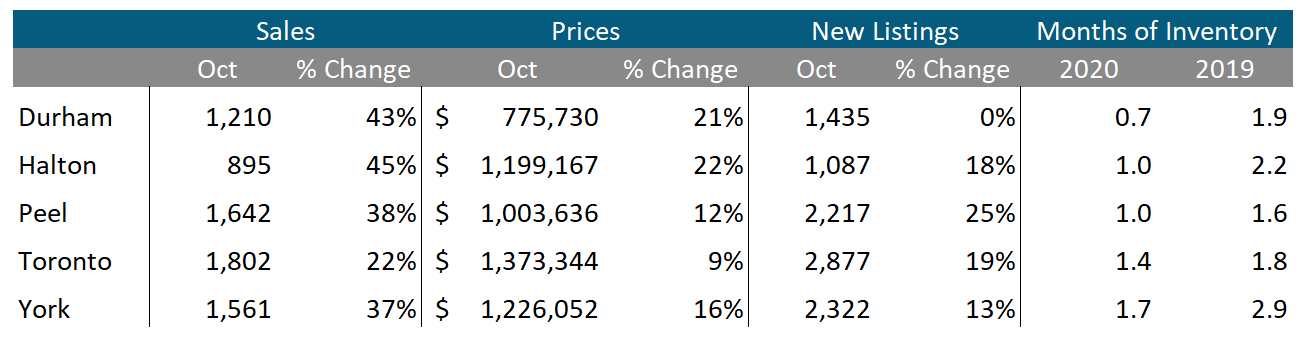
Houses
We can see that house sales and prices are up across all five regions in the Toronto Area. New listings were up in four of the five regions with Peel seeing the biggest increase at 25% and Durham showing no change in new listings.
The MOI is down significantly in all five regions when compared to last year which tells us that the market is more competitive than it was a year ago.
Condos
Condominium sales continue to see big increases in Durham and Halton, but both are relatively small markets for condominiums. The City of Toronto and York saw a 6% decline in condo sales and the MOI for Toronto's condo market increased from 1.3 months last year to 3.6 months in October indicating a cooling market.