John in Toronto Real Estate News
Anyone keeping a close eye on Toronto’s real estate market might find the sales statistics published by the Toronto Real Estate Board this year a bit puzzling.
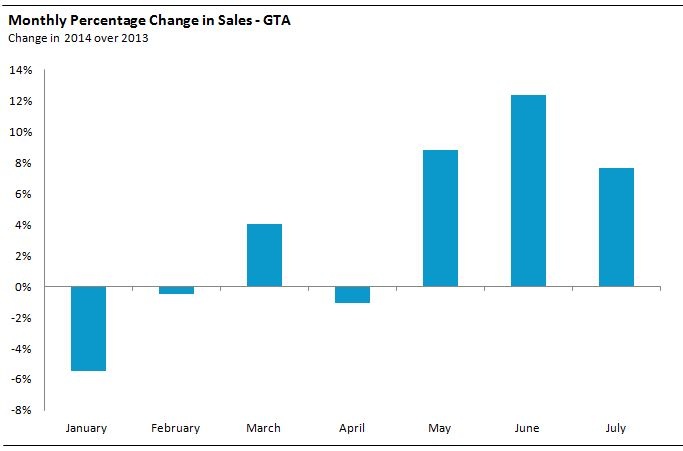
For example, anyone looking at the change in sales each month in 2014 vs 2013 would conclude that the market got off to a slow start in 2014 and only started to pick up on May. They might also conclude that the demand for homes was a lot higher between May and July than it was between January and March of this year.
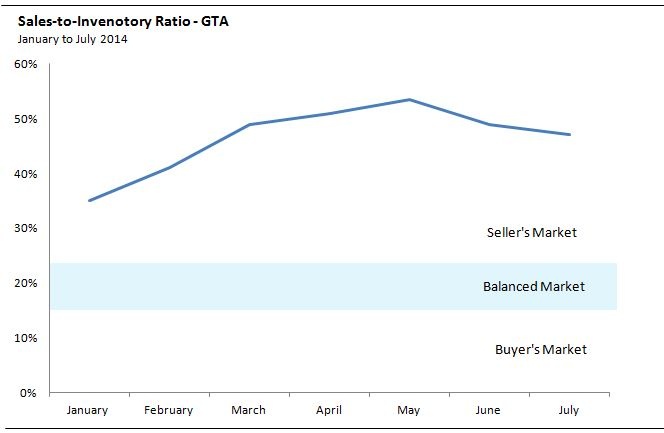
If we also look at the sales-to-inventory ratio we see a similar story. The sales-to-inventory ratio is typically used to measure the relationship between demand (sales) and supply (inventory) in the market. The higher the ratio the more competitive the market is. Looking at the sales-to-inventory ratio for 2014 would lead us to believe that the market in July was more competitive than it was in January and February and only slightly more competitive than it was in March.
The problem with both of the above narratives is that they don’t actually reflect what we observed happening in the real estate market. The real estate market between January and March of 2014 was fiercely competitive with the majority of houses getting no fewer than 10 offers on their offer night. In contrast, the market has slowed down significantly during the summer months with houses staying on the market longer and fewer houses getting bidding wars. When a house does have multiple offers they are more likely to get 2-4 offers rather than the 10+ most were getting earlier in the year.
We can also see this in the media stories about the real estate market. In early 2014 media coverage about Toronto’s real estate market was dominated by stories of houses getting anywhere from 24 to 32 offers on their offer night and selling for hundreds of thousands of dollars over their asking price. We have seen far fewer of these kinds of stories over the past two months.
Why don’t the sales statistics reflect what we are actually seeing in the market?
The main reason for the inconsistencies between what is reported and what we are observing in the market is imperfect data. Specifically, most industry watchers typically use total sales as a proxy for the demand for houses in the market at a given point in time. For example, if 10,000 houses and condos sold in May and only 5,000 in February we would conclude that the demand for houses is twice as high in May as it is in February.
One of the big problems with using sales to measure the demand for houses in a given month is that it does include the shadow demand for houses which often exceeds the number of sales reported.
When we use sales to measure demand in the real estate market we are only counting the number of people who successfully purchased a house in any given month. Shadow demand on the other hand represents the thousands of people actually looking for houses, many of which bid on houses but did not actually buy one.
In a typical bidding war, the demand for a particular house would be measured by the one person who successfully won the bidding war. The shadow demand represents the 10 people who lost the bidding war.
The problem with shadow demand is that there’s no accurate way of measuring it which is why we often use sales as a proxy for the demand for houses.
The total demand for houses in the market in any given month is equal to the number of people who bought that month plus the shadow demand in that month – the people who were actively looking to buy but did not purchase.
With that in mind I’ll try to paint a picture of what I have observed in Toronto’s real estate market during the first seven months of 2014.
There are generally two main home buying seasons in Toronto, the spring market and the fall market. The majority of buyers who want to buy in the spring will typically start their search in January or February and fall buyers will typically start their search in late August or early September. There are a relatively low number of buyers who start their home search in the middle of the buying season.
This means that we typically see the highest demand for houses very early in the season around February, and as eight to ten thousand people actually buy a home each month we gradually start to see fewer buyers actively looking in the market. This happens because the 10,000 people who bought a home in May for example are not replaced by 10,000 new buyers entering the market in June.
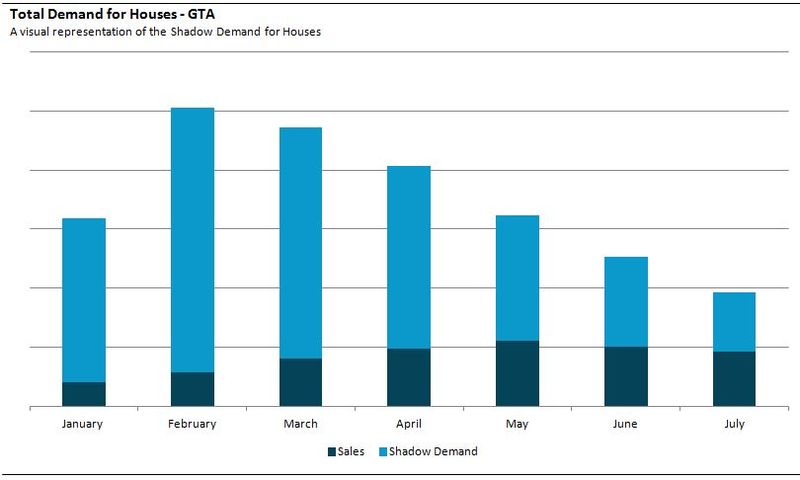
The chart below is a visual representation of both the number of sales and the shadow demand for houses in a given month. Since there is no way of actually measuring shadow demand, the data behind this chart is not actually real. I created it to simply illustrate how the overall demand for houses changes during the home buying season. The dark section represents the number of sales reported each month and the lighter section represents the shadow demand. If we were to extend this chart into the fall market we would see an increase in the shadow demand in both August and September as new buyers enter the fall real estate market.
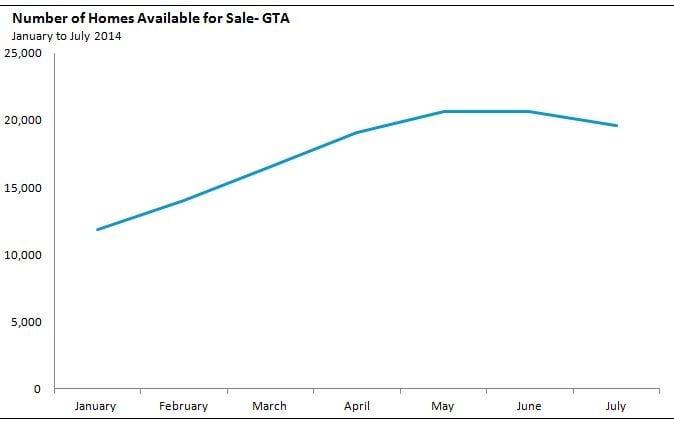
Now that we’ve looked at how the demand for homes changes during the home buying season, let’s take a look at how the inventory of homes on the market changed during the same period. The chart below shows the number of homes available for sale at the end of each month.
We can see the number of homes available for sale nearly doubled between January and May this year.
Between January and March of 2014 we saw a very high demand for houses which was met with relatively low inventory. This drove the hysteria we saw during the first quarter of this year with houses regularly receiving 10-20 offers on their offer night.
As we entered the summer months the total demand for houses declined since most buyers already purchased earlier in the season and the number of homes available for sale increased. The combination of which resulted in a much slower market with fewer bidding wars.
When we take into account the shadow demand for houses and how it declines as we progress into the buying season we are able to make some sense of why the real estate market was actually more competitive during the first three months of 2014 compared to the past three months, even though the data suggests otherwise.
John Pasalis is the President and Broker of Realosophy Realty Inc. Brokerage in Toronto. A leader in real estate analytics and pro-consumer advice, Realosophy helps clients buy or sell a home the right way. Email John
August 12, 2014
Market |


