After months of work, I’m excited that the Realosophy team has added some great updates to our site. One of our goals when we first started was to help home buyers really understand what it might be like to live in one of Toronto’s many neighbourhoods.
While there are plenty of websites and yellowed guidebooks describing the delights of Little Italy or Cabbagetown to browse through, many Toronto neighbourhoods have since moved past their monikers. Toronto has also become much more than its iconic neighbourhoods. We sought to update our knowledge of well-known neighbourhoods and shine a spotlight on those that were lesser known.
If we were going to introduce demographic data to our site, it would have to be consistent with Realosophy’s principles of providing real insight to consumers in a straight-forward and easy-to-use way. What would we want to see before we bought a home? It turned out that it was easier to agree on what we didn’t want to see–rows of numbers and complicated tables. Rather than just being tossed a myriad of Stats Can data, we wanted to be able to zero in on the bottom line. Rather than being told everything about an area, we wanted to know about the key things that truly made it unique.
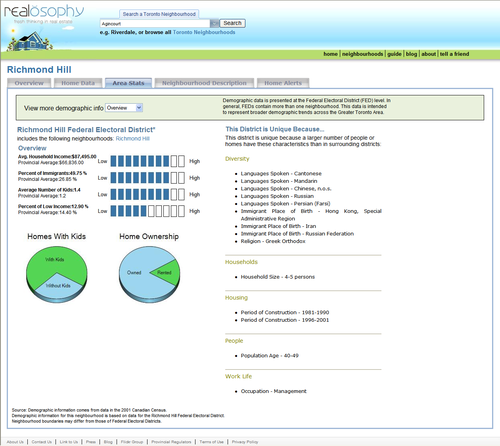
In addition to clearly charting everything from average incomes to mode of transportation, we set to work figuring out how to tell users what made an area unique. To come up with the right algorithm, we identified members of various different communities, backgrounds, income brackets and ways of life belonging to a single area. Then we compared these numbers to those of other areas in the province. From this, we could tell when a group was disproportionately represented in a specific area and more likely to make an impact. Looking at the data this way provides a new and interesting vantage point. The issue is not whether or not Richmond Hill is home to a high number of management professionals (it happens to be), but whether or not it is notable for it. When compared to other areas in the province, it turns out that Richmond Hill has a higher share of these professionals, making it distinct.
In doing things a new way, we had to make some tough calls – at what percentage did a language community become significant to an area? We also had to make some ‘for now’ comprises. Mapping demographic statistics to a particular neighbourhood proved to be a difficult undertaking. Agencies like Stats Canada use boundaries that often differ from the neighbourhood boundaries we are more familiar with. Given that it will take some time for us to reconcile these boundaries, we decided to make a higher level snapshot–at the Federal Electoral District–available to our users immediately. But work is already underway to drill down.
Along with adding new features, an increase in traffic to our site has required us to upgrade our hardware. This has resulted in faster, more useful navigation speeds for users.
It’s funny, when you implement one good idea, about twenty others spring to mind. We are currently working on adding more features to our neighbourhood profiles and responding to user requests to help match them to quality agents.
I hope that you enjoy our updated site as much as we’ve loved putting it together for you.
John
February 11, 2008
Market |


