
John Pasalis in Toronto Real Estate News
The recent slowdown in Toronto’s real estate market has left many people wondering where the market is heading leading up to the busy spring season. Taking a look at a few key real estate statistics will give us a better idea of what’s going on in Toronto’s housing market.
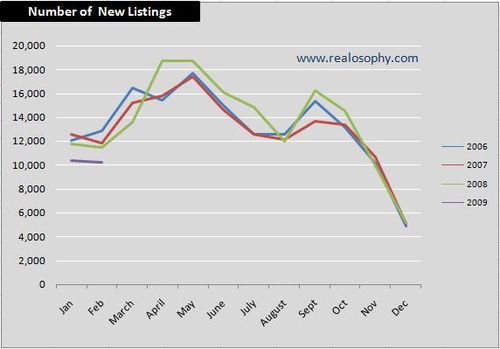
For the first two months of 2009 we saw fewer sellers bring their houses on the market. New listings are down by over 10% when compared to the previous year.
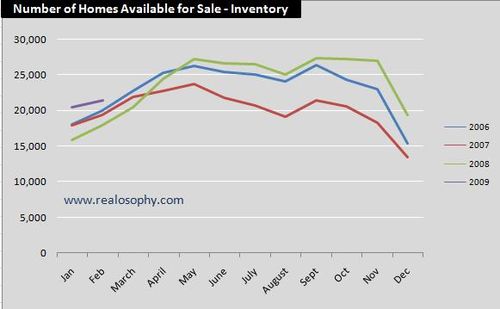
Sellers who don’t have to sell are likely waiting for the market to pick up before they put their house for sale. Sales declined by roughly 50% from October 2008 to January 2009 which resulted in a relatively high number of unsold homes on the market. The inventory of homes available for sale in 2009 is up by 24% over the previous year. High inventory levels are likely one of the key drivers behind the slowdown in new listings.
The following chart shows the number of residential sales for each month. Note the steep decline towards the end of 2008 and the beginning of 2009. Sales were down 31.5% in February 2009 which is an improvement over the roughly 50% decline we experienced in previous months.
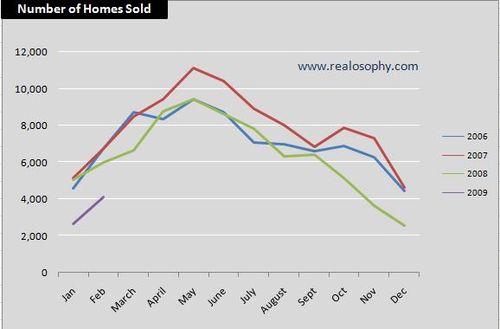
Sales for the first week of March appear to be starting off relatively strong. There were 1,204 sales during the first week of March 2009, a 12% decline over the 1,365 sales during the same time last year. But what appears to be the start of a turnaround in sales for Toronto really has more to do with the poor sales we experienced in March 2008. Sales in March 2008 were down 22% over the previous year. The poor sales figures in March 2008 will make the sales statistics for March 2009 appear to be better than they really are.
The final chart shows the sales-to-inventory ratio for Toronto’s real estate market. To calculate the sales-to-inventory ratio we take the total number of sales in a given time frame and divide that by the total inventory for that same period.
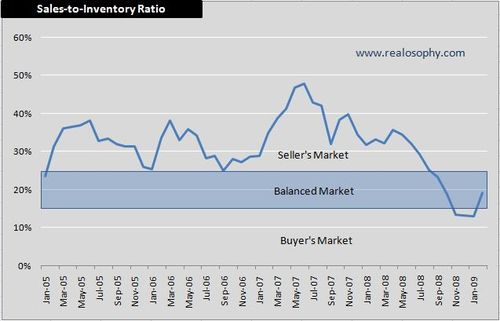
The general consensus among most industry watchers is that a balanced market occurs when sales-to-inventory levels are between the 15% and 25% range. The sales-to-inventory ratio doesn't follow a straight line because real estate sales are very seasonal which causes the ratio to fluctuate.
From November 2008 to January 2009 our sales-to-inventory level dipped below 15% moving us into Buyer’s Market territory. In February the sales-to-inventory ratio increased to 19% moving us back to a more balanced market. I expect Toronto to remain within the balanced market range over the next few months.
John Pasalis is a sales associate at Prudential Properties Plus in Toronto and a founder of Realosophy. Email John
Published: March 11, 2009


