John Pasalis in Toronto Real Estate News
It was a relatively quiet August for Toronto’s real estate market with the number of sales for the month falling 22% over the same month last year to 6,232. The number of new listings coming on the market fell by 1% to 10,488.
You can see all the monthly charts on our real estate statistics page.
Overall, we are seeing more balance in Toronto’s real estate market. We are seeing fewer multiple offers and houses are staying on the market longer than they were six months ago.
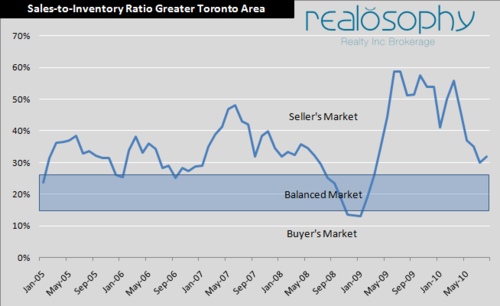
We can see this shift to a more balanced market by looking at the sales-to-inventory ratio for Toronto’s market. This measure is a ratio of the total number of homes that sold in a particular month divided by the total number of homes that were available for sale in that month.
The sales-to-inventory ratio is a key measure of our real estate market because it takes both supply and demand into account telling us how balanced our market is.
We were deep in seller’s market territory when Toronto’s sales-to-inventory ratio peaked in June and July 2009 at 59%. In March 2010 the ratio reached 56% and since then declined to 30% in July and rose a couple of percent in August to 32%.
This decline in the sales-to-inventory ratio was driven by a couple of factors. Firstly between March and May of this year we saw a surge in the number of new listings coming on the market. Because houses were coming on the market at a much faster rate then people were buying them, this added some much needed inventory to the real estate market which helped pull the sales-to-inventory ratio down.
The other factor that is impacting the ratio is the significant decline in sales we've been seeing since June 2010. Over the past three months we've seen double digit declines in monthly sales. The main theory behind the slowdown in demand is that many purchasers rushed to purchase in the spring ahead of the changes to Canada's mortgage rules and ahead of the HST. While the HST does not impact resale housing purchases, a couple of recent surveys suggested that many home buyers were misinformed about this issue and rushed to buy ahead of the introduction of the HST.
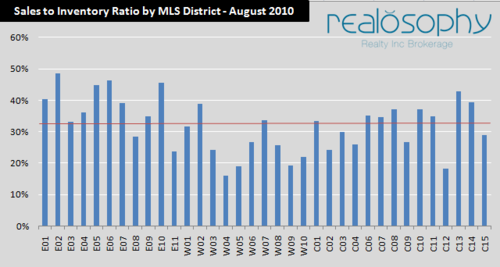
When we look at the sales-to-inventory for each MLS district in the city we see that some areas are still deep in seller’s market territory while others are approaching a buyer’s market.
The chart below shows the sales-to-inventory ratio for every MLS district. The red line indicates the sales-to-inventory ratio for the Greater Toronto Area.
Overall we can see that the east end districts are exceeding the city average, the west end districts are generally below the average and the central districts are the closest to the average.
As I've said in previous blog posts, real estate is a very local business. Whether you are buying or selling you need to understand the current state of the market in your neighbourhood, not just the city averages, in order to make a smart real estate decision.
John Pasalis is the Broker Owner of Realosophy Realty Inc in Toronto. Realosophy focuses on researching Toronto neighbourhoods to help their clients make smarter real estate decisions. Email John
September 8, 2010
Market |


