John Pasalis in Toronto Real Estate News
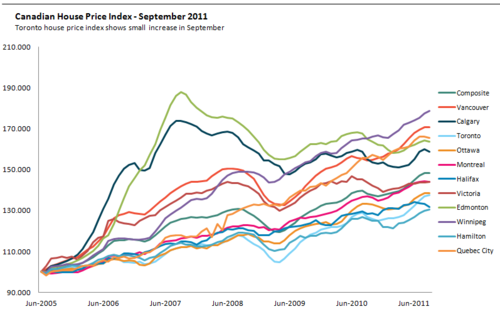
Teranet and National Bank publish a monthly House Price Index that tracks changes in house values in a number of Canadian cities. They recently added 5 cities (Victoria, Winnipeg, Edmonton, Hamilton and Quebec City) to their monthly House Price Index report bringing the total number of cities tracked to eleven.
Using a simple average to measure the change in real estate values can present a number of problems. Averages can be heavily skewed by changes in the housing stock and by a small number of super luxury property sales.
The House Price Index uses something called the repeat sales methodology to calculate changes in house values. This approach requires a property to have been sold at least twice in order for it to be used in their calculations. They take the current sale price of a particular house and compare it to the previous sale price to measure the increase or decrease in value over that period. This approach offers a more realistic look into changes in real estate values.
Instead of reporting on prices for a particular city, National Bank and Teranet have converted house prices into a standard index. To do this they first assign a base period, in this case June 2005, for which the index for all regions is set to 100. The index then captures just the appreciation or depreciation in house values for a particular market.
Let’s take a closer look at the House Price Index data for al 11 cities tracked by the index. I’ll discuss each city in order of their appreciation as measured by the index.
Winnipeg is Hot!
Winnipeg house prices have appreciated at a faster and more consistent rate than any of the other Canadian cities tracked. House values in Winnipeg have increased 78% since June 2005 (the base year of the house price index), roughly 12% per year. Even a global economic and credit crisis in 2008 wasn’t enough to slow down Winnipeg’s real estate market. During that time house values declined by just 3% before resuming their upward trend again.
Vancouver
Vancouver house values were outperforming Winnipeg until the credit crisis in the fall of 2008 when house values retreated by 12%. Since then house values have been increasing steadily and are currently 70% higher than in June 2005, roughly 11% per year.
Quebec City
A lot like Winnipeg, house values in Quebec City have been appreciating at a very consistent rate over the past 6 years. It’s interesting to note that house prices in Quebec City were not impacted at all by the economic crisis in 2008. House values have increased by 65% since June 2005 or roughly 10% per year.
Edmonton
Edmonton house values showed the strongest signs of a housing bubble when prices nearly doubled from June 2005 to September 2007. Prices declined for two years and have slowly started to recover. House prices are down 13% from their peak in 2007. House values have appreciated by 64% since 2005, or roughly 10% per year.
Calgary
House values in Calgary also showed strong signs of a housing bubble when house values increased by 75% from 2005-2007. Much like Edmonton, prices declined for two years and have slowly started to recover. House prices are down 9% from their peak in 2007. House values have appreciated by 58% since 2005, or roughly 9% per year
Victoria
House values in Victoria have appreciated by 44% since June 2005 or roughly 7% per year. Up to 2008 house values in Victoria were appreciating at a similar rate to house values in Vancouver. Victoria saw two dips in house values recently, once in 2008 and again during the second half of 2010. House values are currently at the same level reached during their recent peak in June 2010.
Montreal
House values in Montreal have appreciated by 44% since June 2005 or roughly 7% per year. A lot like Quebec City, house values in Montreal have been increasing at a very steady rate since 2005 and were not at all impacted during the downturn in 2008.
Ottawa
House values in Ottawa have appreciated by 38% since June 2005 or roughly 6% per year.Aside from two small dips in house values in 2008 and 2010 Ottawa’s house prices have appreciated at a relatively steady rate over the past six years.
Toronto
I think our Toronto readers will be a bit surprised to see that Toronto is among the worst performers in terms of appreciation in house values over the past six years. House values in Toronto have appreciated by 38% since June 2005 or roughly 6% per year.During the downturn Toronto’s house price index dropped to the lowest level of all the cities tracked.
Since then house prices have rebounded and have pushed us above the two worst performing cities in Canada.
Halifax
The second last spot goes to Halifax were house values have appreciated by 32% since June 2005 or roughly 5% per year. House values in Halifax have been appreciating at a relatively steady rate and did not see any significant decline in house values during the downturn in 2008.
Hamilton
The title for worst performing real estate market as reported by the Teranet National Bank House Price Index goes to Hamilton. House values have appreciated by 31% since June 2005 or roughly 5% per year.Hamilton also saw downturns in 2008 and 2010 but prices have recovered since then.
John Pasalis is the Broker Owner of Realosophy Realty Inc in Toronto. Realosophy focuses on researching Toronto neighbourhoods to help their clients make smarter real estate decisions. Email John
December 2, 2011
Market |


