John Pasalis in Toronto Real Estate News
The final numbers for 2011 are in and the average price for a Toronto home officially increased by 8% to $465,412 over 2010. Sales were up 4% to 91,756 and the number of new listings were down 4% to 148,014.
But we know the aggregate stats don't tell us too much about the market so I'll take closer look at the key figures that drove Toronto's real estate market in 2011.
Inventory
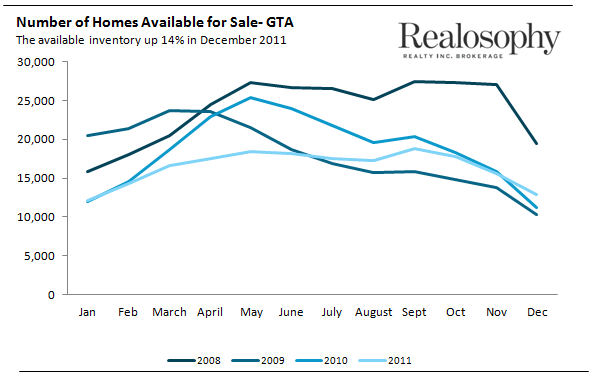
The big news in 2011 was the limited number of houses that came on the market for sale between April and June, traditionally the peak months for the market. The following chart shows the monthly inventory (houses available for sale) for the past four years. You'll see that inventory levels between March and June for 2011 were significantly lower than previous years.
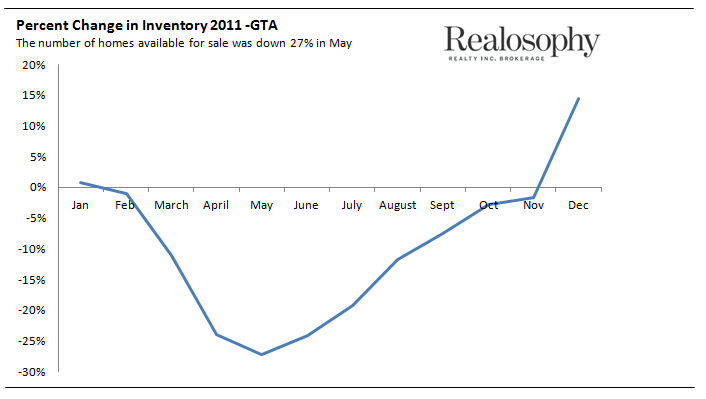
The following chart does a slightly better job of showing just how much inventory levels declined compared to last year. It shows the percentage change in inventory in 2011 when compared to the same month in the previous year. The number of homes available for sale was down 27% in May.
Sales
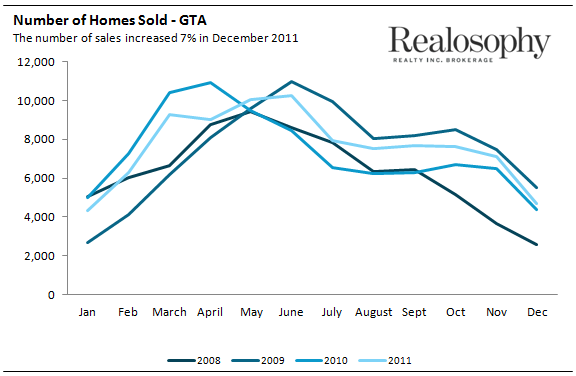
The following chart shows the monthly sales for the past four years. Note that the sales volumes for the first four months in 2011 were actually down when compared to 2010. But from May on sales have been up for every month.
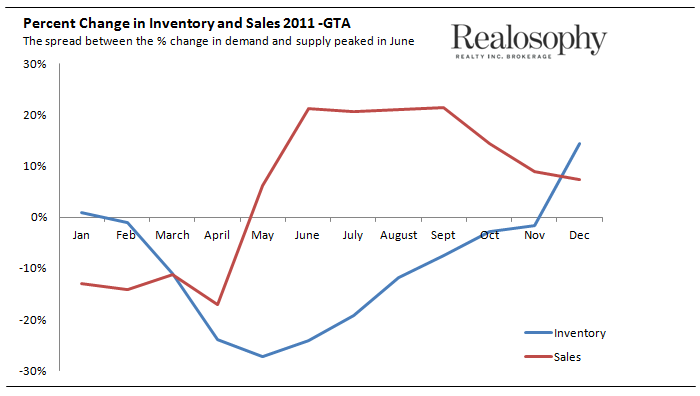
The following chart shows how the change in demand (sales) compared to the change in supply (inventory) for 2011. I added the percentage change in sales to the above charge showing the percentage change in inventory.
You'll see that the difference between the change in demand versus the change in supply peaks in June. Sales were up 21% that month and inventory was down 24%.
Sales-to-Inventory
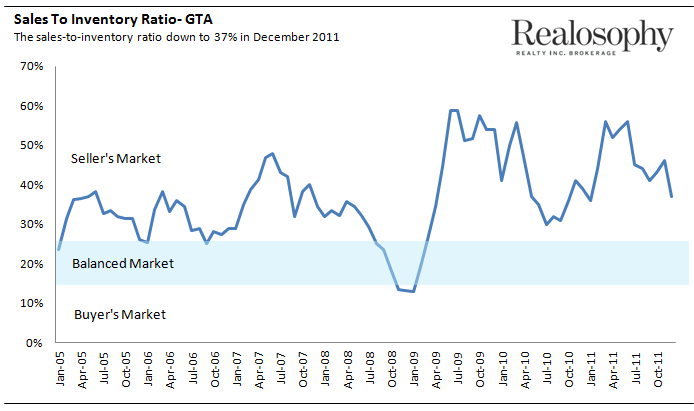
The following chart shows the sales-to-inventory ratio for the past six years. The sales-to-inventory ratio shows the balance between supply and demand in the market. You'll see that the ratio also peaked in June (for 2011) showing that the imbalance between supply and demand was the highest in that month. After June the ratio began to decline as more houses came on the market for sale.
This imbalance between supply and demand resulted in a very competitive market during the first half of 2011 where bidding wars were the norm. During the second half of 2011 more properties came on the market which brought some much needed relief to home buyers. The increase in inventory meant that fewer houses were getting multiple offers and even the ones that were getting multiple offers were getting fewer people at the table compared to what we might have expected during the first half of 2011.
John Pasalis is the President and Broker Owner of Realosophy Realty Inc in Toronto. Realosophy focuses on researching Toronto neighbourhoods to help their clients make smarter real estate decisions. Email John
January 6, 2012
Market |


