John Pasalis in Toronto Real Estate News
The media have stepped up the real estate bubble rhetoric lately so I thought I would take some time away from the busy spring market to offer my thoughts on the one question that’s on most people’s minds, is the Toronto real estate market going to crash?
Most buyers are worried about buying at the peak of the market and with all the bubble talk in the mainstream media they are right to being asking themselves, is this the peak?
If we have hit the peak then we would expect to see a decline in house prices within the next 6-12 months.
So what causes house prices to fall? There’s actually only one basic economic condition that will cause house values to fall, when the supply of houses coming on the market for sale significantly out numbers the demand for homes. There could be a number of different factors that cause demand to decline or the supply of homes to increase but it’s the imbalance between the two that drives house prices down.
With that in mind, we’ll start off by taking a look at the balance between the supply and demand for houses in the resale market.
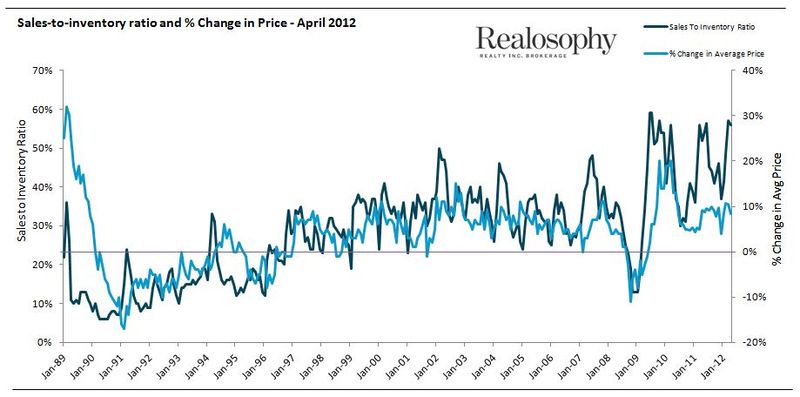
We can measure the balance between supply and demand by looking at the sales-to-inventory ratio for any given month. The sales-to-inventory ratio is simply the number of houses that sold in a month divided by the number of houses available for sale. In a balanced market we would expect to see roughly 2 houses selling for every 10 that are available for sale, or a 20% sales-to-inventory ratio. When the sales-to-inventory ratio is above 20% the demand for homes exceeds the supply which causes prices to rise and similarly when it’s below 20% the supply exceeds the demand which causes prices to fall.
The following chart shows the relationship between the sales-to-inventory ratio and changes in house prices from 1989 to April 2012.
You can see the close relationship between changes in the sales-to-inventory ratio and changes in house prices. With the sales-to-inventory level at 56% in April it's not surprising to see house values up by 8% over last year.
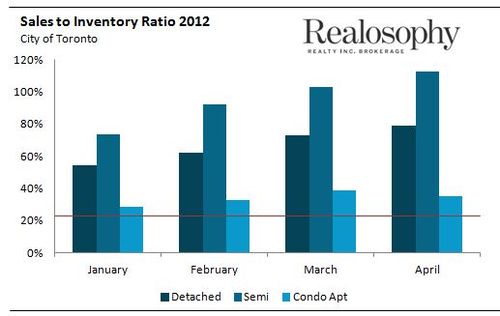
The following chart shows the sales-to-inventory ratio for detached, semi-detached and condominium apartments for the first four months of 2012.
The grey line represents the approximate equilibrium sales-to-inventory ratio above which prices are rising and below which prices are falling.
I decided to look at these types of houses separately because I wanted to compare the supply and demand for freehold houses (detached and semi-detached being the two most common types of freehold houses) versus condominiums to see if there are any differences between the two. The average sales-to-inventory ratio for the first four months of 2012 was 67% for detached houses, 95% for semi-detached houses and 34% for condominium apartments.
We can see that there is a significant difference between the supply and demand for homes in the freehold segment compared to the condominium segment. We are finding that there are not enough detached and semi-detached houses coming on the market to meet the demand from buyers. The condo market on the other hand is far more balanced with roughly 3 months of available inventory in any given month.
Detached and Semi-detached houses are on average selling in 15 days and for 103% of the original asking price compared to 31 days and 98% of asking for condos.
Now we’ll turn our attention to the supply of new houses and condos coming on the market.The following charts are from Realnet Canada, a company that analyzes statistics in the new construction market.
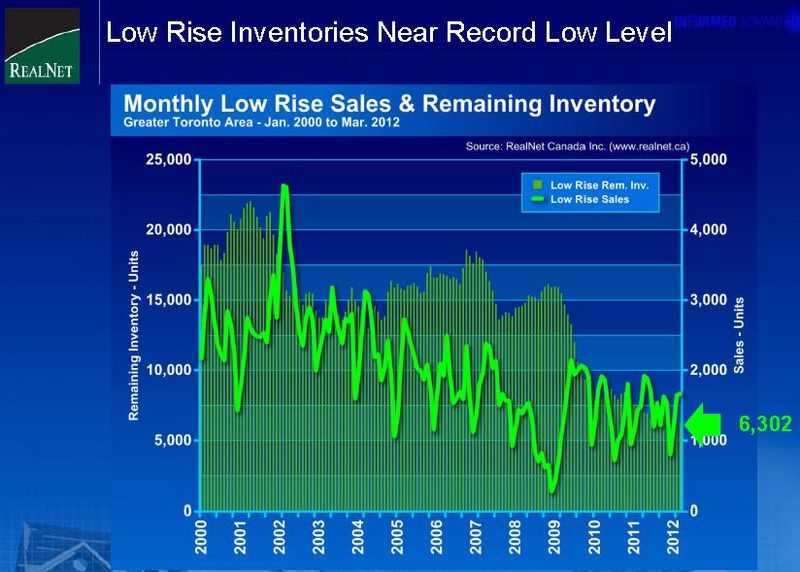
The first chart shows both the inventory and sales of low rise (freehold) homes in the Greater Toronto Area.
The bar chart shows the new construction inventory levels for freehold houses which we can see have been declining since 2009 and are now near record low levels at just 6,302 in March.
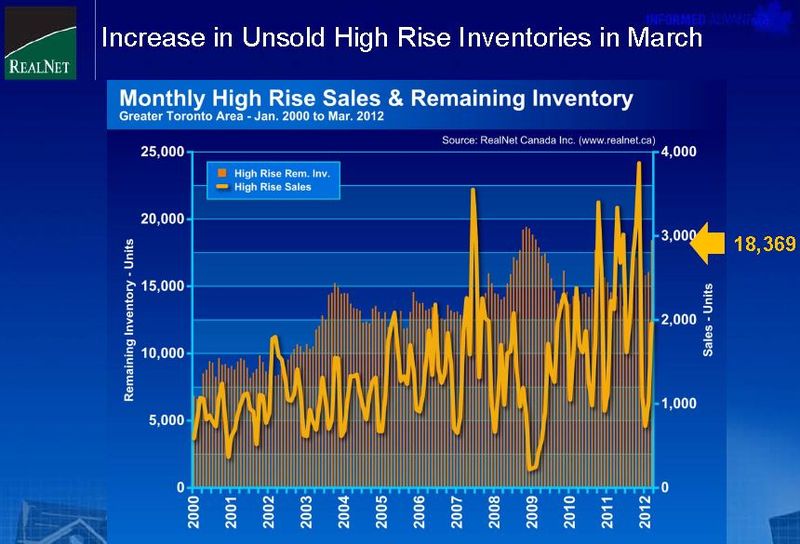
The next chart shows the high-rise inventory and sales in the GTA.
We can see from the bar chart that inventory levels have been on the rise since 2009 in the condominium segment reaching 18,369 in March.
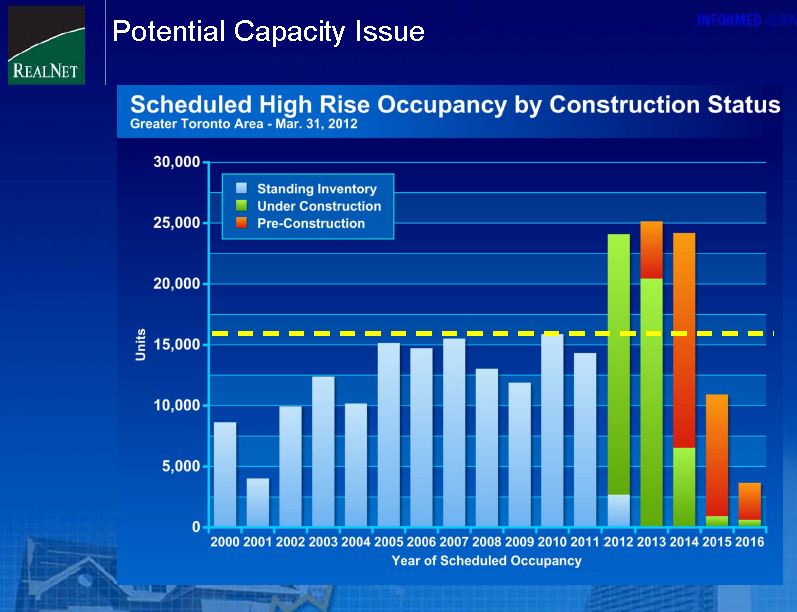
Now if we look a bit deeper into the pipeline of new condominiums that are scheduled to be completed over the next three years we see that the inventory is going to increase significantly.
There are roughly 75,000 condominiums scheduled to be completed by the end of 2014 in the Greater Toronto Area. Condominium completions have hovered around the 12,500- 15,000 unit level annually for the past eight years, so an increase to just under 25,000 completions per year is a significant change to our market.
Returning to our original question, have we hit the peak and are Toronto real estate prices going to fall within the next year?
We can see above that the statistics tell very different stories for the freehold and condominium segments.
The imbalance between the supply and demand for freehold houses is so great and the inventory of new houses coming on the market is so low that there’s very little risk of house values dropping any time in the near future.
The condo market on the other hand is definitely more vulnerable to a decline in values. The resale condo market is still in seller's market territory but remains relatively balanced with the sales-to-inventory ratio at around the 34% level. With 75,000 condos scheduled to be completed by 2014 many industry watchers are wondering if this flood of new inventory will be enough to push prices down. Some are arguing that 25,000 completions per year is sustainable and that the strong demand for rentals will save us from any slowdown in the condo market. I have my doubts.
John Pasalis is the President and Broker-Owner of Realosophy Realty Inc. Brokerage in Toronto. A leader in real estate analytics and pro-consumer advice, Realosophy helps clients buy or sell a home the right way. Email John
May 11, 2012
Market |


