John Pasalis in Toronto Real Estate News
A Globe and Mail article published this week questioning the accuracy of Canada’s housing data published by the Canadian Real Estate Association prompted me to write this long overdue post about sales statistics published by the Toronto Real Estate Board (TREB).
The Toronto Real Estate Board publishes a monthly report called Market Watch which is typically released during the first week of the month reporting on sales in the previous month. As part of their Market Watch report TREB also publishes a press release summarizing the sales statistics for the month.
The percentage change in the number of homes sold is calculated by comparing the current month’s sales to the number of sales in the same month in the previous year. For example, the percentage change in sales in September 2013 would show the increase or decrease from September 2012.
Up until June 2011, this was a pretty basic calculation. One could open the current month’s Market Watch along with last year’s Market Watch report to get the sales numbers required to calculate the percentage change which would of course be the same percentage change published by TREB in their press release.
In July 2011 TREB changed how they report the percent change in sales they publish in their press releases. TREB now compares the current month’s sales as published in their Market Watch report to an “adjusted” sales figure for the same month in the previous year. According to TREB the adjustment takes into account the fact that a number of the properties that were reported as sales a year ago fell through.
TREB has indicated that they are taking this approach because they want to use the most current and up to date data they have available.
On the surface, this all seems pretty reasonable. After all, who doesn’t want to use current data?
But when we look at what’s really happening in a bit more detail, we see that TREB’s approach is not only flawed but it misrepresents the sales statistics they publish every month.
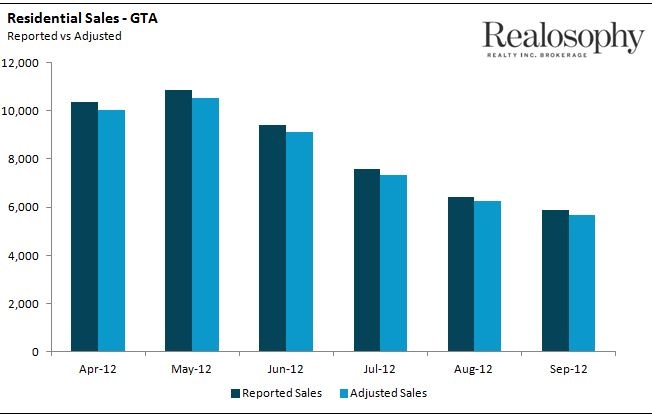
Let’s take a look at how this change impacted the sales statistics released in September 2013. According to the September 2013 Market Watch report there were 7,411 sales that month which was a 26% increase over the 5,879 sales reported in the September 2012 Market Watch report. But in TREB’s September 2013 press release they compared the 7,411 sales last month to an adjusted figure of 5,687 for September 2012. While on the surface this seems like a minor difference, the result is that TREB was able to report that sales were up 30% in September rather than 26%.
Comparing sales this month (unadjusted) to adjusted sales in a previous month doesn’t make any sense. The major problem with this approach is that the adjusted sales figure in the previous year is always going to be lower than what was originally reported for that month.
The following chart shows the actual sales reported by TREB from April-September 2012 along with the adjusted sales figure they used to calculate the percentage change statistics released in their press releases this year.
Now you might be thinking, who really cares? The differences above appear to be relatively minor.
The problem is that any increase in sales will always appear higher when we are comparing to last year’s adjusted sales figure vs the unadjusted sales figure. Similarly, any decline in sales won’t look quite as bad when compared to the lower adjusted sales figure.
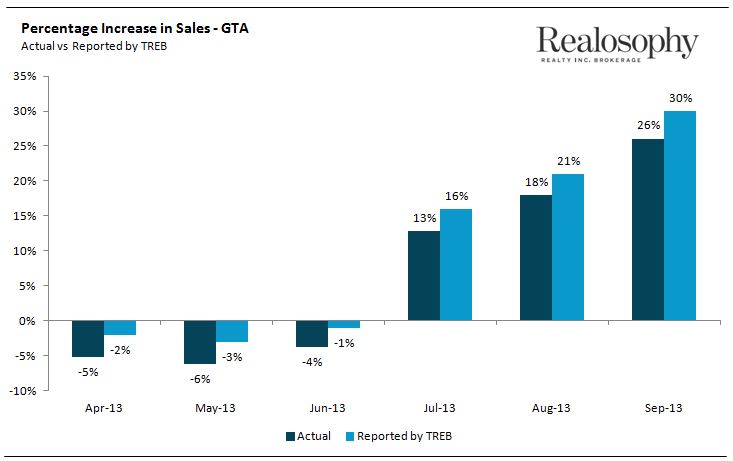
To see what this looks like in real life, the following chart shows the actual percentage change in sales over the past six months (using sales statistics published in TREB’s Market Watch reports) compared to the percentage change reported by TREB in their press release using a lower adjusted sales figure for the previous year.
You can see that by comparing sales to a lower adjusted sales figure in the previous year, a 5% drop in sales in April was reported to the media by TREB as a 2% decline in sales. Similarly a 4% decline in June was reported as a 1% decline.
In July an increase of 13% was reported as a 16% increase and most recently the 26% increase in September was reported by TREB as a 30% increase.
TREB’s argument that they are calculating statistics this way because they want to use the most current data is not a genuine one because they also know that the sales data for the current month is overstated yet they make no effort to disclose this nor do they adjust it down to take into account the fact that many of the sales reported in September 2013 will eventually fall through.
An institution that cared about the quality and accuracy of the statistics they publish would not be comparing unadjusted numbers this year to adjusted figures in a previous year.
John Pasalis is the President and Broker of Realosophy Realty Inc. Brokerage in Toronto. A leader in real estate analytics and pro-consumer advice, Realosophy helps clients buy or sell a home the right way. Email John
October 30, 2013
Market |


