John Pasalis in Toronto Real Estate News, Home Buying
In my last blog post (The GTA Neighbourhoods Home Buyers Should Avoid), I walked through a metric we use at Realosophy to analyze housing markets called Months of Inventory (MOI). The MOI is an important metric because it is highly correlated with changes in house prices. As MOI declines, prices usually go up and as MOI increases, the rate of appreciation - and eventually prices - might fall.
In that post, I reviewed 450+ neighbourhoods in the Greater Toronto Area (GTA) against their current MOI and found that 72 neighbourhoods already have 7+ months of inventory. Areas with seven or more months of inventory typically see prices begin to fall.
Today I’m going to walk you through why some neighbourhoods are wildly oversupplied and why others are still in a seller’s market.
I’ll be comparing the Toronto neighbourhood of Roncesvalles and a neighbourhood in the GTA which I’ll refer to as Anyville (to avoid influencing sales in that area given that my comments and outlook for it are not particularly favourable).
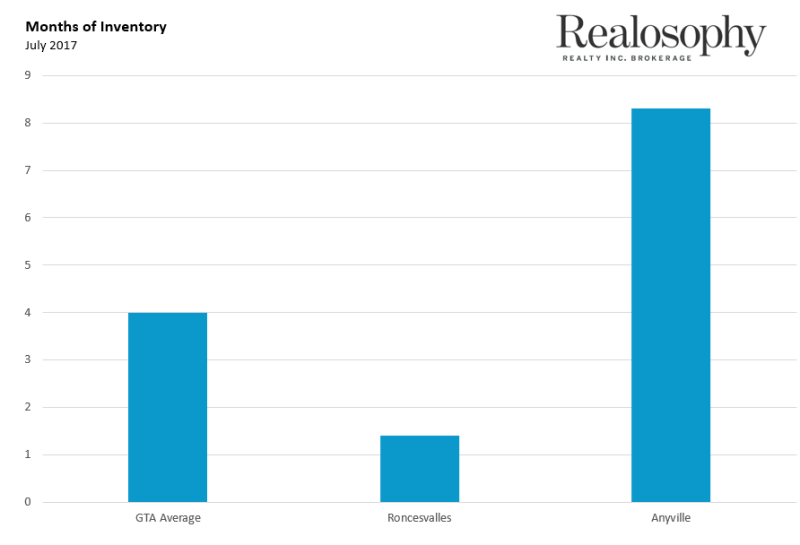
All data for each neighbourhood are real figures. At the time of writing this blog post, Roncesvalles had 15 freehold houses (detached, semi or row houses that are not condos) available for sale and over the past 30 days, 11 homes had sold. Therefore, Roncesvalles had an MOI of 1.4 (15/11). Anyville, on the other hand, had 50 freehold houses available for sale and only 6 homes had sold over the past 30 days, giving it a MOI of 8.3 (50/6). The average MOI for freehold houses in the GTA was 4.1.
It’s also worth mentioning that at the end of March this year, Anyville’s market was very competitive with just one month of inventory, so there has been a rapid change in their market over the past three months.
But let’s look at a couple more metrics to get a better feel for the differences between these two neighbourhoods and how the right data can tell us a lot about them.
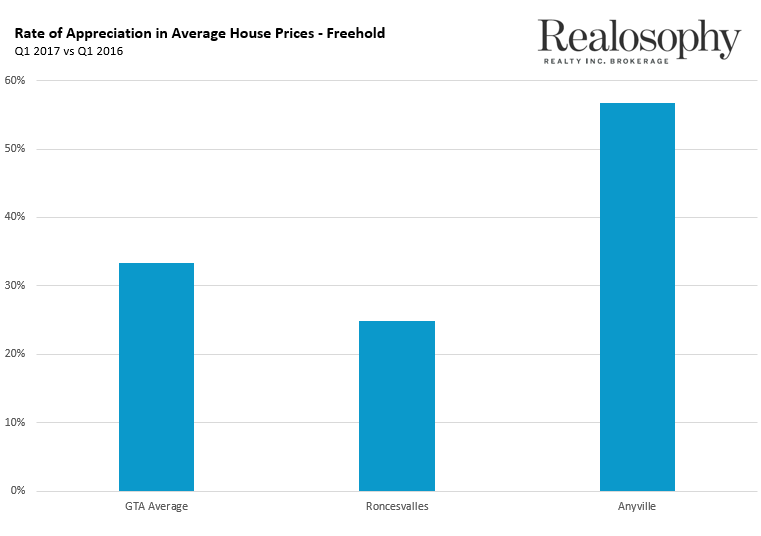
The average house price for a freehold house in Roncesvalles climbed from $970K during the first quarter of 2016 to $1,210,000 during the first quarter of 2017, a 25% increase. The average price in Anyville in the first quarter of 2016 was $806,000 climbing to $1,263,000 in the first quarter of 2017 – a 57% increase. The GTA on average saw prices appreciate 33% during the same period.
While we normally like to see house prices rising, when they climb too high and too fast it’s usually cause for concern, not excitement. Both neighbourhoods (and the GTA as a whole) experienced a rapid growth in prices that is not typical of real estate markets. That being said, at 57%, the rate of growth in house prices in Anyville is significantly more irrational than what Roncesvalles experienced. It’s this rapid growth in prices in a short period of time that makes neighbourhoods like Anyville far more vulnerable to bigger price declines relative to neighbourhoods like Roncesvalles whose growth was actually below the average for the GTA.
Now your next question might be why did prices in Anyville appreciate at such a fast rate when compared to Roncesvalles. Unfortunately there’s no one answer to this question but I’ll share with you one factor that may have had an impact.
In March of this year, Realosophy published a report that calculated the percentage of single family homes being purchased by investors across the GTA. Because we based our analysis on MLS sale and rental data we were able to calculate that 95% of these investors were losing money each month because their rent wasn’t high enough to cover the monthly carrying costs of the home (assuming buyers made a 35% down payment).
Our report (recently cited by the Bank of Canada in their Financial System Review) suggested that investors (really, speculators) were willing to lose money each month because they had the irrational expectation that house prices would keep going up by 10-20% per year indefinitely - a hallmark of the type of speculative mindset that fuels real estate bubbles.
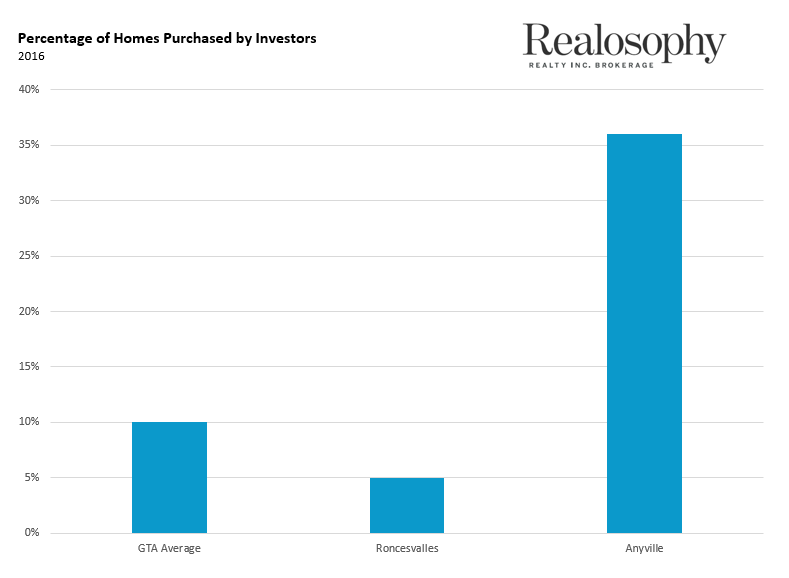
In 2016, 5% of homes sold in Roncesvalles in 2016 were purchased by these investors compared to 36% for Anyville; the average number for the Greater Toronto Area was 10%.
Why does the percentage of speculators matter? U.S. cities like Phoenix, Miami and Las Vegas that saw the highest rates of real estate speculation also experienced the steepest and most sustained price declines following the subprime crisis in 2008. The same can hold true for neighbourhoods within a city – the higher the rate of speculation in a neighbourhood, the more vulnerable that neighbourhood is to price declines in the future, especially when those neighbourhoods also saw the steepest increases in house prices the way Anyville did.
In a slowing market, some buyers wonder if any of this matters as they snag houses for lower prices, but MOI should matter to you if you want to make a safe investment - you don’t want to find your home drop in value by 20% six months after you move in.
While we can never predict if prices are going to drop or by how much – we can say with a lot of confidence that if prices across the GTA fall, they are going to fall a lot more in Anyville than in Roncesvalles. If prices in the GTA fall by 10%, Roncesvalles might see prices fall in the 0-10% range while Anyville is more likely to see prices fall by 20-30%.
Knowing your numbers when you buy has never been more important.
Want more info? Sign up (below) for my upcoming talk where I'll walk through the numbers behind the 72 GTA neighbourhoods all home buyers should avoid right now.
John Pasalis is the President and Broker of Realosophy Realty Inc. Brokerage in Toronto. Buying a house or condo this spring? A leader in real estate analytics and pro-consumer advice, Realosophy helps clients buy or sell a home the right way. Email John


