A closer look at the data reveals that the market for low-rise houses and condos is performing unevenly across the Greater Toronto Area’s (GTA) five regions.
In much the same way we know that housing markets across Canada can perform very differently (something I discussed in a recent interview with BMO’s Robert Kavcic), the same holds for different regions and house types within a metropolitan area.
This month’s data dive from my November Move Smartly report will examine how the market for low-rise houses and condos is performing across the Greater Toronto Area’s (GTA) five regions.
The chart below shows the year-over-year change in sales for the month of October 2023.

Condos in Peel have seen the biggest decline in sales at just under 20%, followed by houses in Halton region with a decline of 11%. Condos in York are the only house type that has seen sales increase over last year.
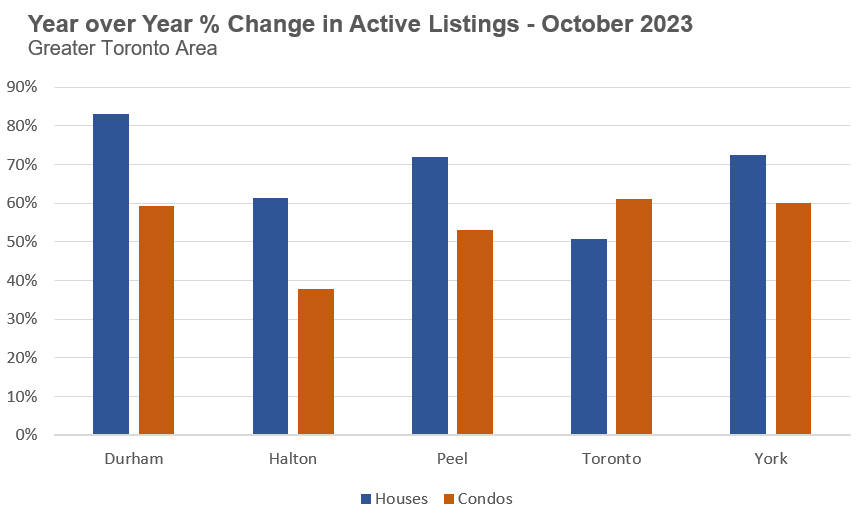
One noteworthy trend is that most regions and house types saw sales volumes change within 5% of last year’s levels. Sales were relatively soft in the GTA last year, but the big difference between this year and last is the change in the number of homes available for sale, or active listings.
The number of homes available for sale across the GTA is up by over 50% across all house types and regions, excluding Halton condos which is down 38%. Suburban houses have seen the steepest increase in the number of active listings followed by condos in the City of Toronto.
But to better understand the balance in each market, we need to look at the months of inventory (MOI).
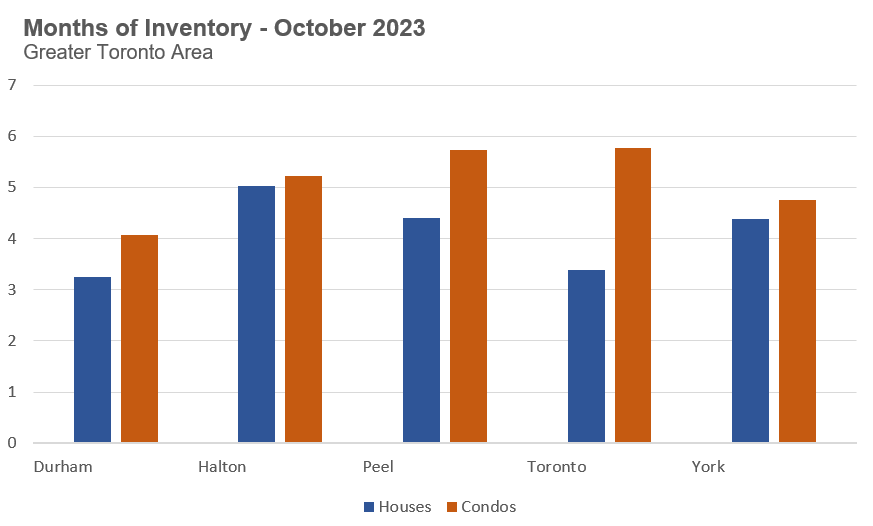
Even though houses in Durham saw the biggest increase in active listings out of all regions and house types, it also has the lowest MOI, which suggests that the market is more balanced and competitive than all the other regions and house types.
Across all five regions, the market for condos has a higher MOI than the market for houses, with the City of Toronto seeing the biggest difference between house types, with houses at 3.4 MOI compared to 5.8 MOI for condos, indicating a slower market for condos.
There is a significant amount of variability in the MOI for houses across municipalities in the GTA. The chart below shows the MOI for houses in October for each municipality.
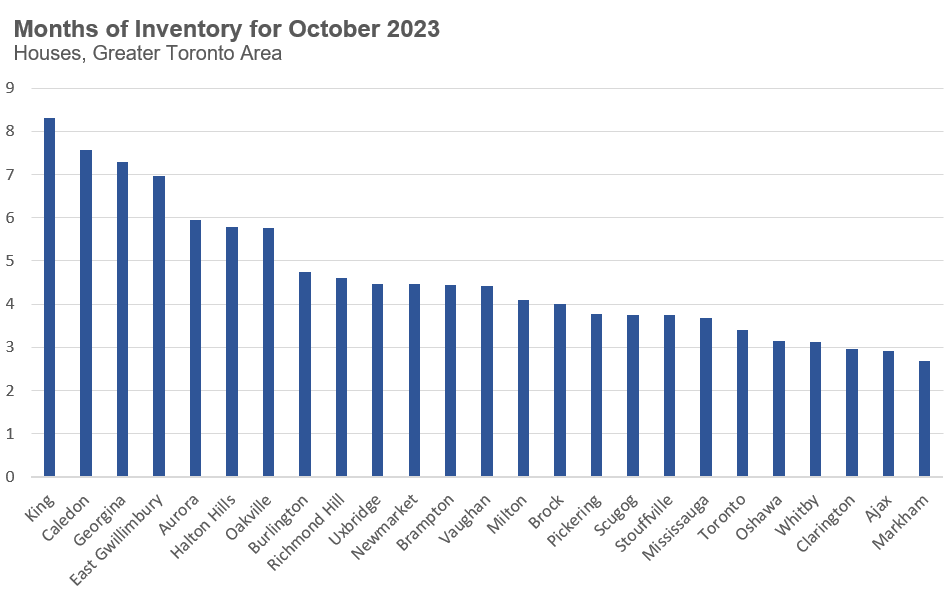
Far outlying areas of the GTA with a high MOI of 7 to 8 MOI, include King, Caledon, Georgina and East Gwillimbury. On the other end are areas around 3 MOI, including Oshawa, Whitby, Clarington, Ajax and Markham, which nearer to Toronto suburbs in the east-end region of Durham.
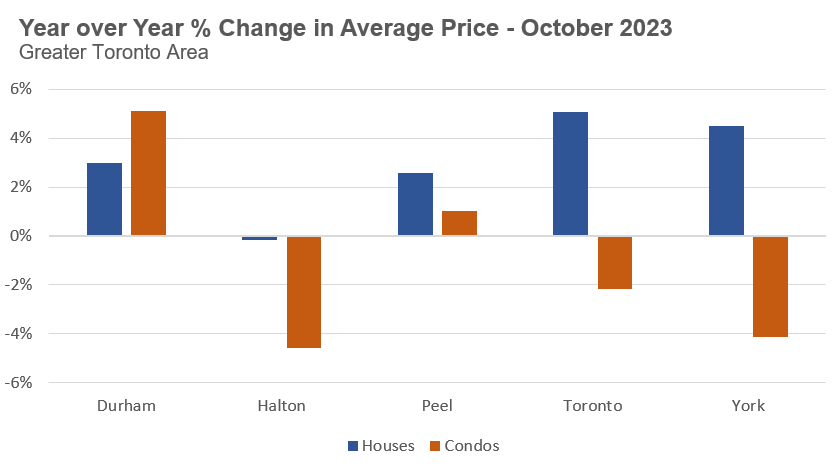
When considering how prices have changed over last year, it’s important to remember that prices across the GTA have been trending down over the past four months. This means that regions and house types where prices are up year-over-year are not an indication that prices are currently trending up in those areas. A more appropriate way to interpret this positive price growth is that despite declining prices since the spring, prices are still up over last year.
Interestingly, despite the surge in active listings and the record low demand for houses, average prices are still up year-over-year in four of the five regions.
The important takeaway for buyers and sellers is that the market dynamics for the property they are looking at buying or selling are very local. You cannot lean on aggregate trends for the Greater Toronto Area to inform your real estate decisions.
You can visit Realosophy.com to keep on top of all data trends in the GTA by area.
John Pasalis is President of Realosophy Realty. A specialist in real estate data analysis, John’s research focuses on unlocking micro trends in the Greater Toronto Area real estate market. His research has been utilized by the Bank of Canada, the Canadian Mortgage and Housing Corporation (CMHC) and the International Monetary Fund (IMF).
Published: November 22, 2023