John Pasalis in Toronto Real Estate News
If you’re considering buying a home in the Greater Toronto Area, it’s really tough to make sense of what is really happening in the real estate market. Headlines reporting that sales are down 35% over last year can lead one to believe that the real estate market is in a state of free fall, but things aren’t quite what they seem.
Before I talk about what is happening in the market today I thought it would be helpful to clarify a couple of misconceptions I’ve been hearing from buyers and even some industry commentators.
We normally see a major increase in sales in the fall but this year we didn’t
One misconception that I’ve heard relatively often from buyers and even some industry commentators is that we normally see a big increase in the number of sales in September compared to August and because this didn’t happen this year it’s a sign that the market is getting worse.
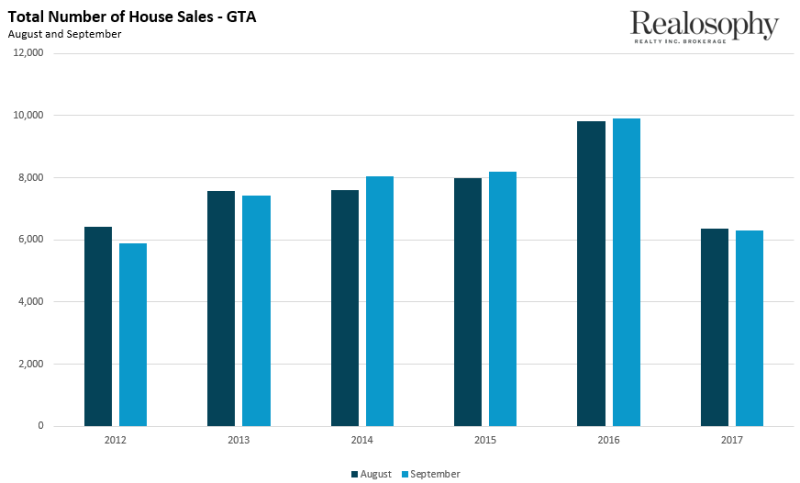
Most agents simply assume this is true because they anecdotally see more interest from buyers in the fall, but that doesn’t mean there are more sales. The chart below shows the number of sales in August and September over a 6 year period. Half of the time sales actually fell from August to September and in the years when sales did increase the average increase was a modest 3% over August.
In short, the change in sales from August to September this year is consistent with previous years.
With sales down 36% price declines are sure to follow
A decline in sales does not always result in a decline in prices. What matters is the balance between supply and demand.
Imagine a market where there are 200 buyers competing for 100 homes. Because there are twice as buyers as homes available, prices are going to increase quite rapidly as the 200 buyers compete aggressively for the 100 homes that are on the market.
Suppose the following month there are still 100 homes on the market but 40% of buyers decided not to buy – leaving 120 buyers competing for 100 homes. Even though demand is down, the market is still relatively competitive.
As a whole, this is roughly where we find Toronto’s market today. Sales are down but Toronto’s market is moving from what was approaching a bubble last year to a more balanced seller’s market this year.
Demand exceeded supply by such a big margin last September that it resulted in prices rising 20% year over year. We actually needed demand to fall to move to a more balance market.
Where does the Toronto’s real estate market stand today?
Before tackling what is happening today let’s start with a bit of a refresher on what happened this spring.
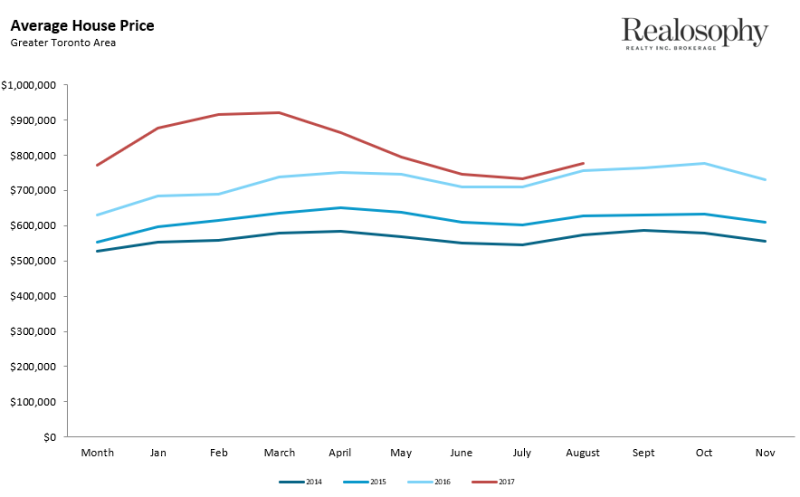
Just as average house prices in Ontario reached $920K in April – an all-time high - the Ontario government announced measures to cool the housing market in the GTA. In the following months Toronto’s real estate market quickly changed course with new listings surging and sales falling which put immediate downward pressure on house prices. The average price for a home in September was $775K a 16% decline from the peak and just a 3% increase over last year.
Is the rapid decline we saw in house values this spring and summer spilling over to the fall market? Not exactly.
As a whole Toronto’s real estate market has actually hit a bit of a plateau over the past three months with prices remaining steady in the $730-$770K and tracking last year's numbers quite closely.
But more important than what is happening in the GTA overall, it’s important to remember that we shouldn’t be thinking about GTA’s real estate market as a whole. Things are moving in very different directions depending on the type of property and the location you’re considering.
Condos are the strongest performing house type and detached homes are the worst performing house type in the Greater Toronto Area.
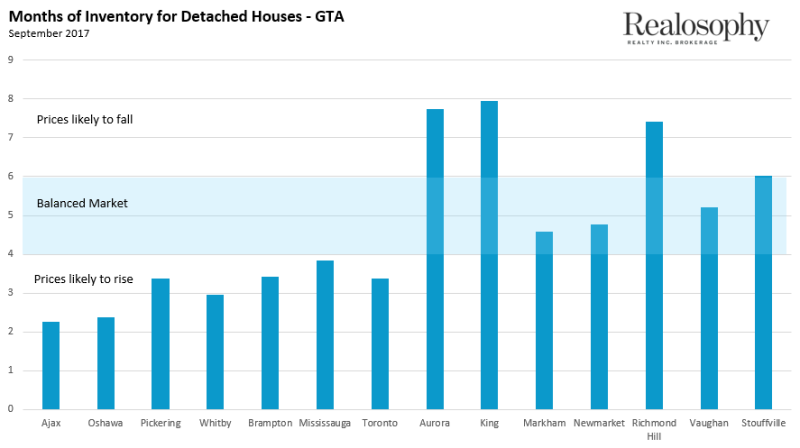
The chart below shows the months of inventory for detached houses across the GTA. The months of inventory is a metric we use to measure how balanced the market is. The market is generally considered to be balanced (meaning prices neither rise or fall too much) when there is roughly 4-6 months of inventory. Anything less than that typically leads to rising prices and more than 6 months typically means a slight oversupply of homes leading to potential price declines.
With anywhere from 6-8 months of inventory Aurora, King, Richmond Hill and Stouffville are more vulnerable to further price declines than the municipalities in Durham region (Ajax, Oshawa, Pickering and Whitby) which have between 2-3.4 months of inventory.
As I wrote several months ago, where you buy and what kind of property you’re buying makes a difference. It’s important to understand the balance between supply and demand for the type of home you’re buying and in the particular area you’re buying in.
House prices can move in very different directions across neighbourhoods within the same city.
John Pasalis is the President and Broker of Realosophy Realty Inc. Brokerage in Toronto. Buying a house or condo this spring? A leader in real estate analytics and pro-consumer advice, Realosophy helps clients buy or sell a home the right way. Email John
October 4, 2017
Market |


