Housing markets are notoriously difficult to predict - but data can help home buyers and sellers answer some critical questions.
Earlier this month, I spoke at a real estate conference about a topic that I have spent a considerable amount of time researching – how we spot turning points in the housing market.
When I talk about turning points, I mean any significant shift in the housing market – like when we go from a boom period where house prices are rising rapidly to a market where prices begin falling.
While we can’t predict the precise moment when the market will begin to cool down, we are able to make some quick inferences once the market has started to apply the brakes. Did the market gently hit the brakes resulting in a gradual cool down or did it slam on the brakes resulting in a rapid deceleration in the market?
From there, we can ask more important questions. Out of all the neighbourhoods and house types (condos vs houses) which neighbourhoods and types of homes are the most vulnerable should prices fall?
One mistake buyers make is that they assume that if the average price for a house in the GTA fell by 10% then all houses saw their values drop by 10%. Nothing could be further from the truth. We could see the average price for all homes fall by 10% while homes in some neighbourhoods are actually up 10% and homes in other neighbourhoods are down 30%. Neighbourhoods within the same city can see house prices change in very different directions.
Figuring out which neighbourhood is vulnerable to a big correction vs which one is less vulnerable is not a matter of chance – the answer is typically hidden in the underlying trends for each neighbourhood.
When house prices started to cool rapidly in May 2017, we analyzed all the data we had and came up with a list of approximately 80 neighbourhoods that we were telling our clients to either not buy in – or if they wanted to buy to pay 20% less than what homes were selling for a month earlier because we were very confident that prices would decline in those neighbourhoods. Most of those neighbourhoods had high rates of investor activity leading up to the peak.
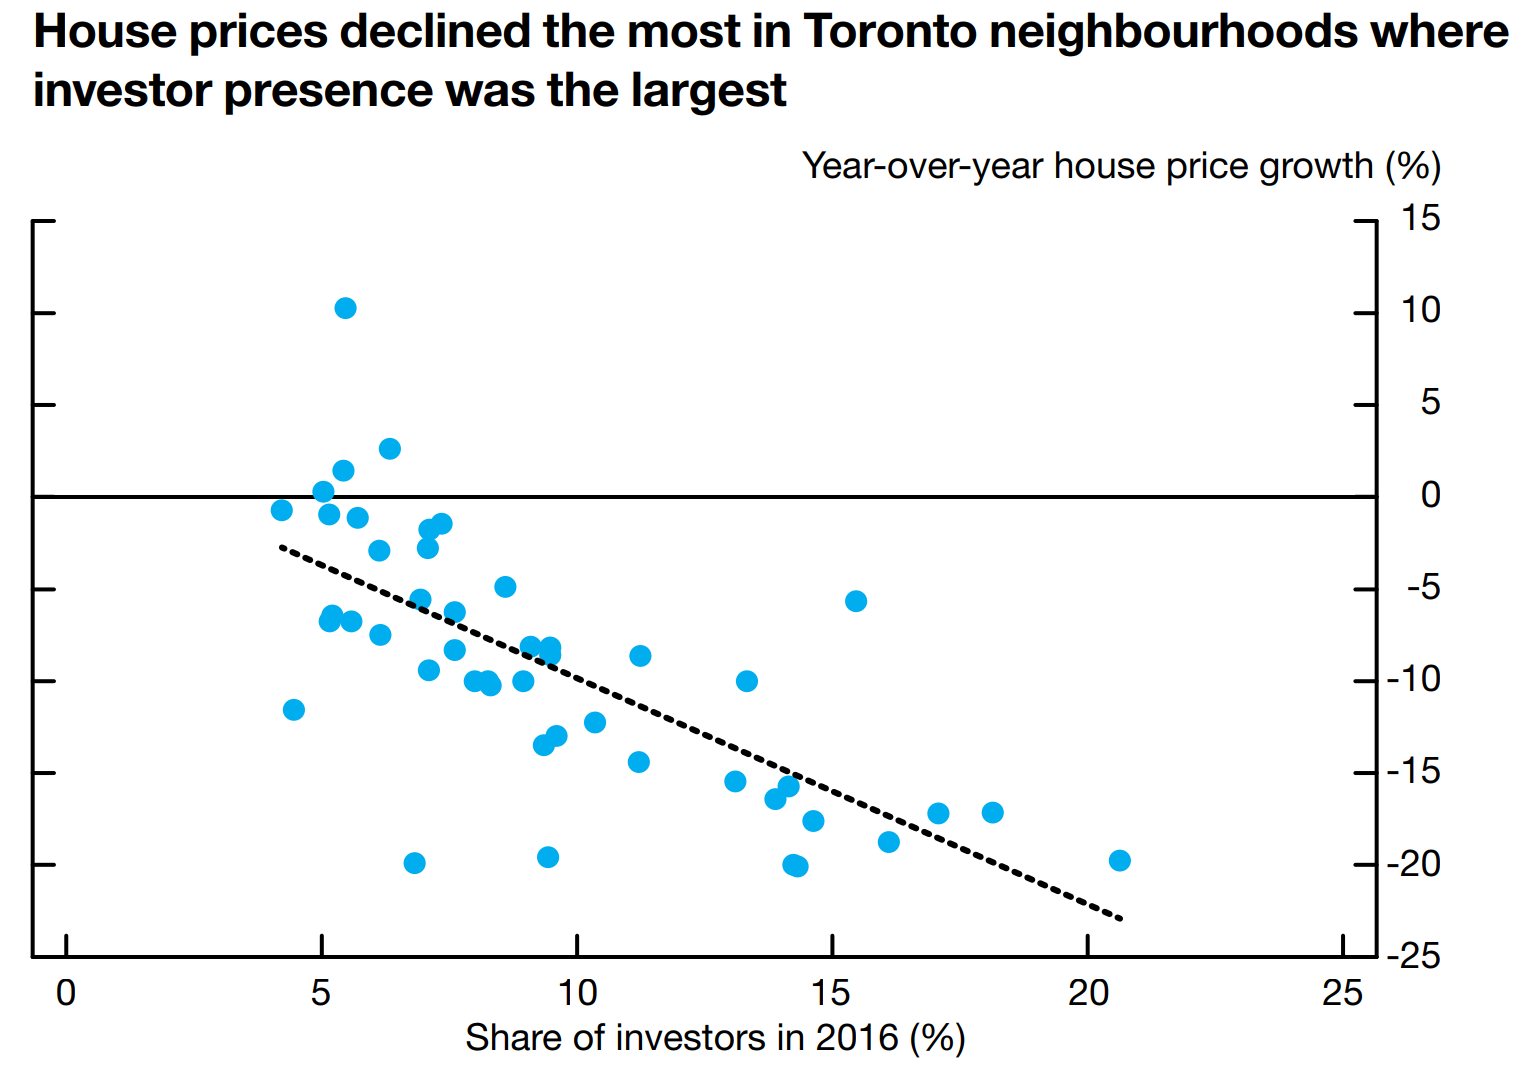
In June of this year, the Bank of Canada used our data showing investor demand by neighbourhood and found that the neighbourhoods with the highest rate of investor demand in 2016 showed the biggest decline in house prices a year later.
While we can’t predict the exact timing of a house price decline, we are able to use data and statistics to measure the risk that house prices might fall in one neighbourhood vs another. In a volatile market, this can be the different between making a safe real estate purchase vs seeing the value of your home fall by over $200,000 in a matter of months. And it’s for this reason that we’ll keep investing in research and technology at Realosophy, to give our clients a data driven edge when making real estate decisions.
Image Credit: filo
John Pasalis is the President and Broker of Realosophy Realty Inc. Brokerage in Toronto. A leader in real estate analytics and pro-consumer advice, Realosophy helps clients buy or sell a home the right way.
Follow John on Twitter @johnpasalis
Published: October 16, 2018