
The latest stats are in for March 2024.
Watch John market update via video player above or on Move Smartly YouTube channel here
Read full story below
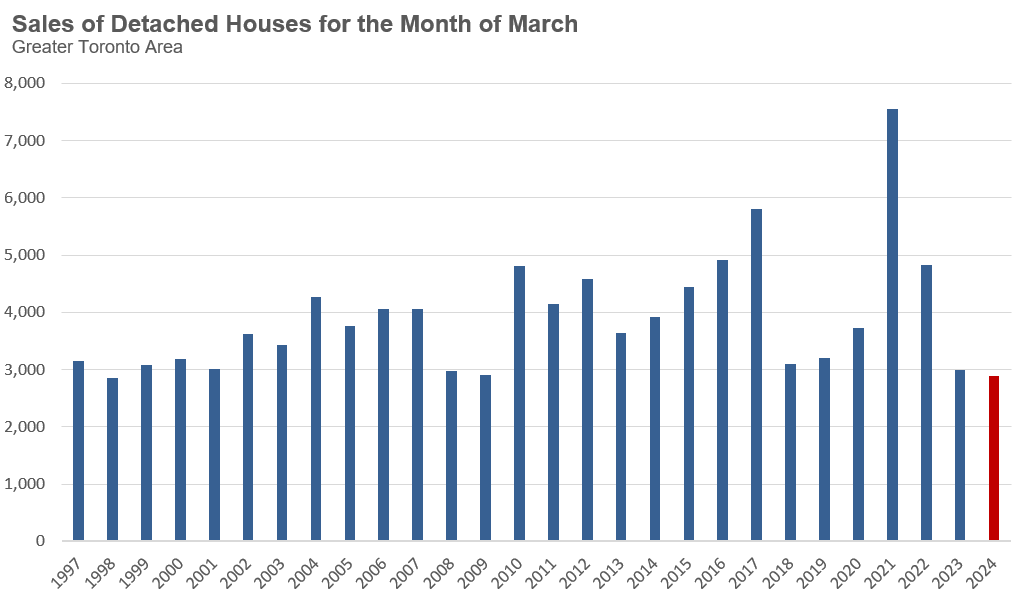
High home prices and high interest rates have kept many home buyers on the sidelines, resulting in a record low volume of sales for detached homes in the month of March.
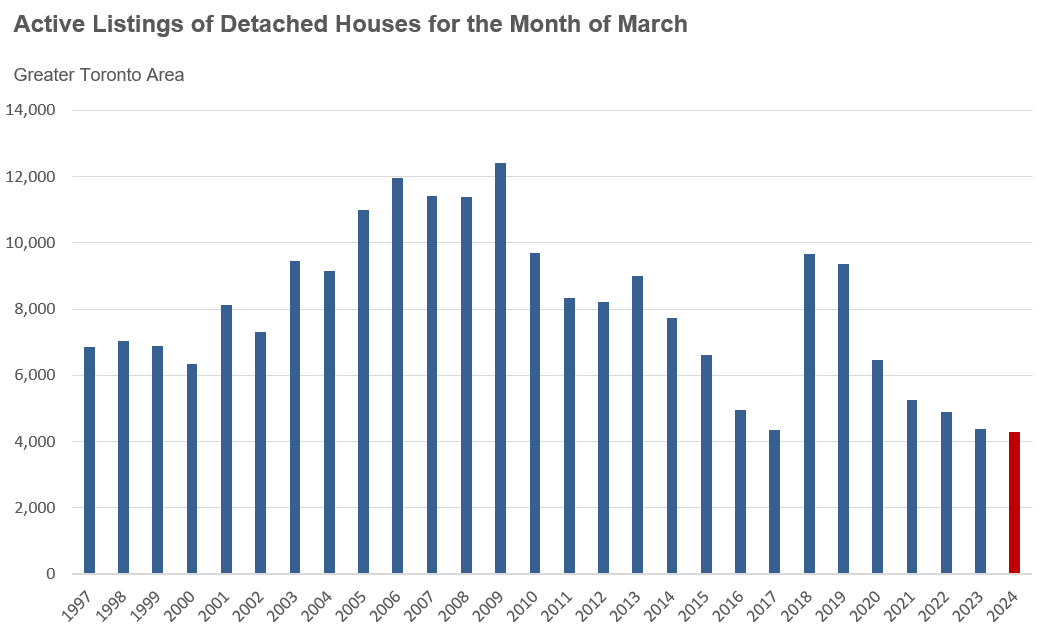
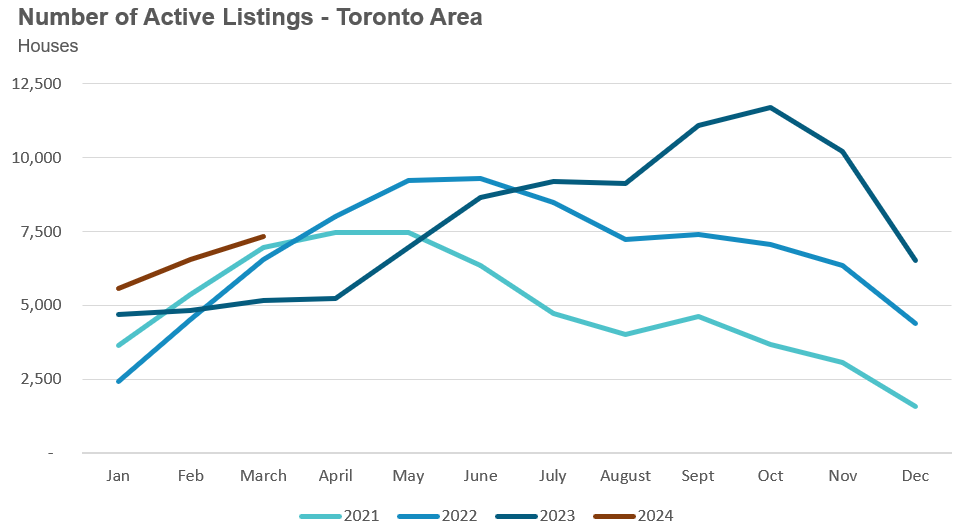
However, despite the low sales volume, the market for detached homes remained competitive because the number of detached homes available for sale also reached a record low in March.
The low inventory levels can, at least in part, be explained by the low sales volumes. Far fewer people are upsizing in today's higher interest rate environment, which means they are not buying a home and are not selling their existing home, leading to a decline in sales and active listings.
However, the other structural change we are seeing in the housing market is that more people are moving out of their existing homes, either due to upsizing or relocation, and not selling their existing homes. They are holding their existing homes as investment properties.
Over time, this has reduced the stock of homes that can be purchased by people who intend to use them as their principal residence. This means that the declining number of resale homes available for sale every year isn't a symptom of a lack of supply but the result of the increasing share of homes bought by investors who convert the homes to rental properties.
Politicians and housing experts often dismiss the role that real estate investors play in our housing market. In doing so, they ignore their impact on housing affordability in Canada and the significant change in the role that houses play in Canada's society and political economy.
Owning a home provided families with certainty and security in their housing needs and an investment that could help fund their future retirement. As Canada sees more homes bought by investors, a generation of Canadians is being shut out of owning a home, which means they are losing the housing security previous generations had and that long-term investment to help fund their retirement.

WATCH LIVE: The Market Now with John Pasalis - Thurs April 11th 2024 12PM ET
Join John Pasalis, report author, for key highlights of this month's report and responses to your questions. Sign Up Now >
By the Numbers: March 2024
The average price for a house in the Toronto area was $1,373,316 in March, unchanged over the same month last year. Last month's median house price was $1,218,500, also unchanged over last year.
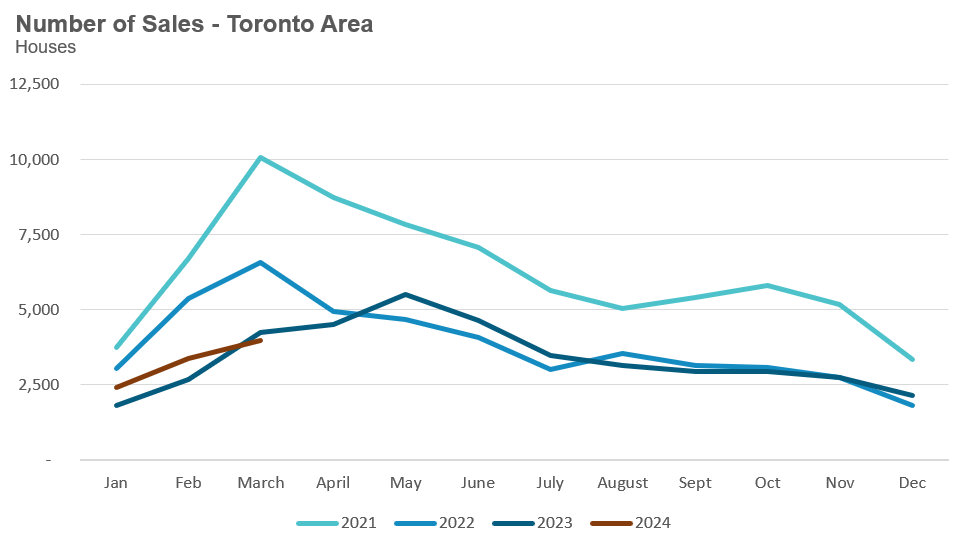
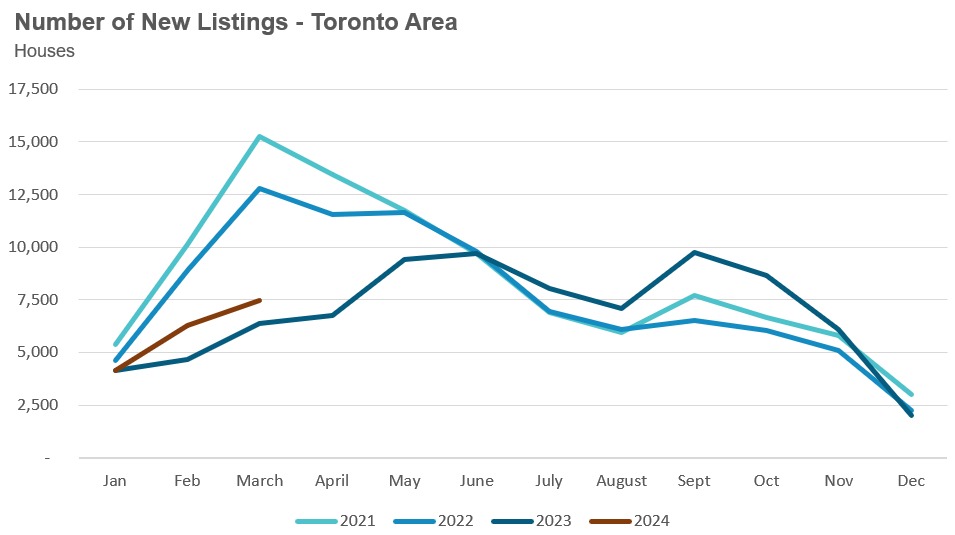
House sales in March were down 6% over last year, while new house listings were up 17%.
The number of houses available for sale at the end of the month, or active listings, was up 42% over last year.
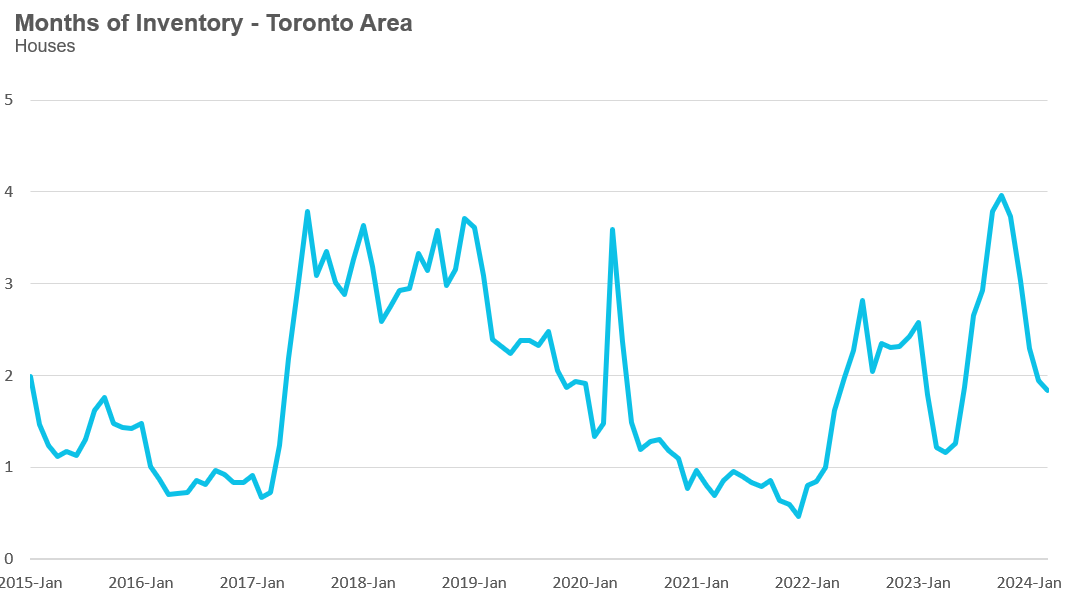
The current balance between supply and demand is reflected in the MOI, which is a measure of inventory relative to the number of sales each month.
In March, the MOI for houses fell slightly to 1.8.
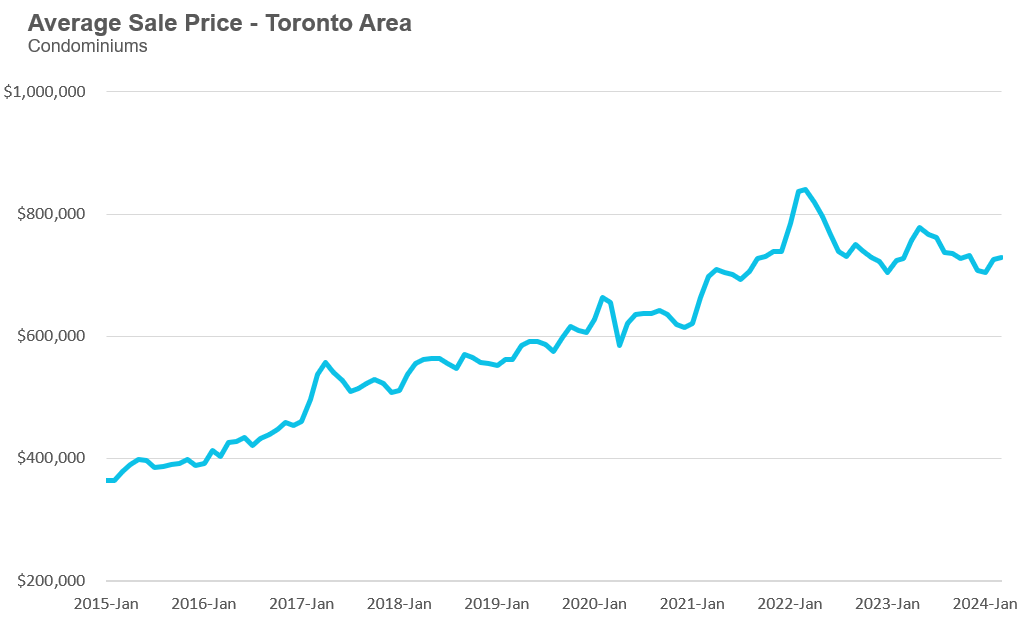
The average price for a condo in the Toronto Area was $728,585 in March, which is unchanged over last year. The median price for a condo in March was $670,000, up 1% over last year.
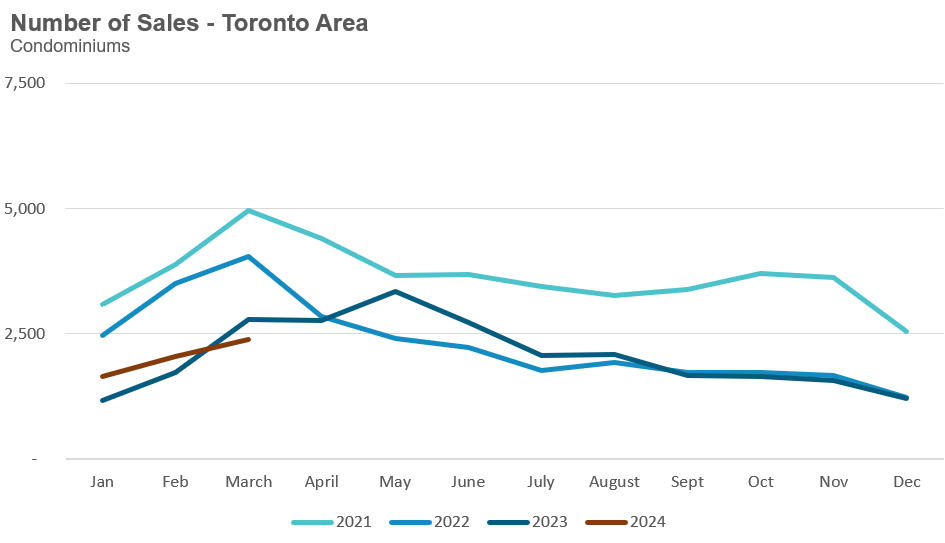
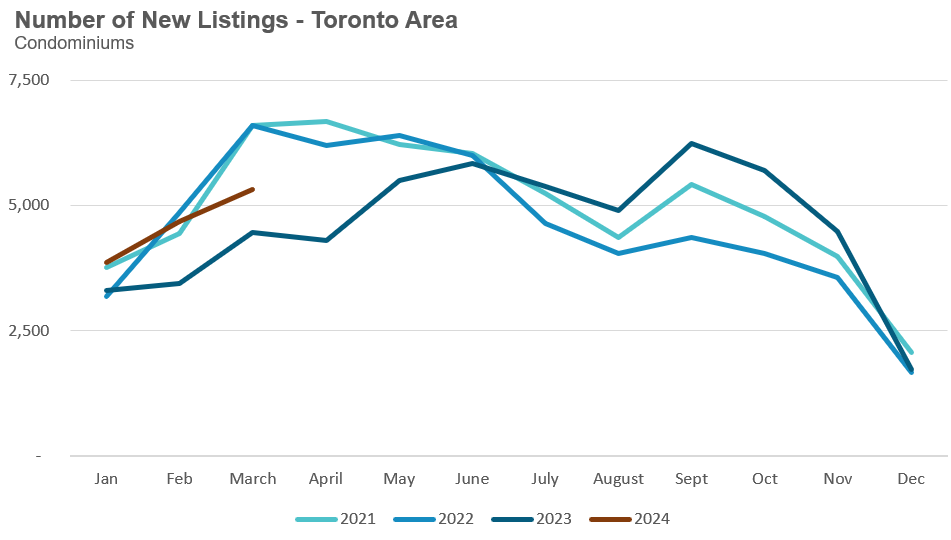
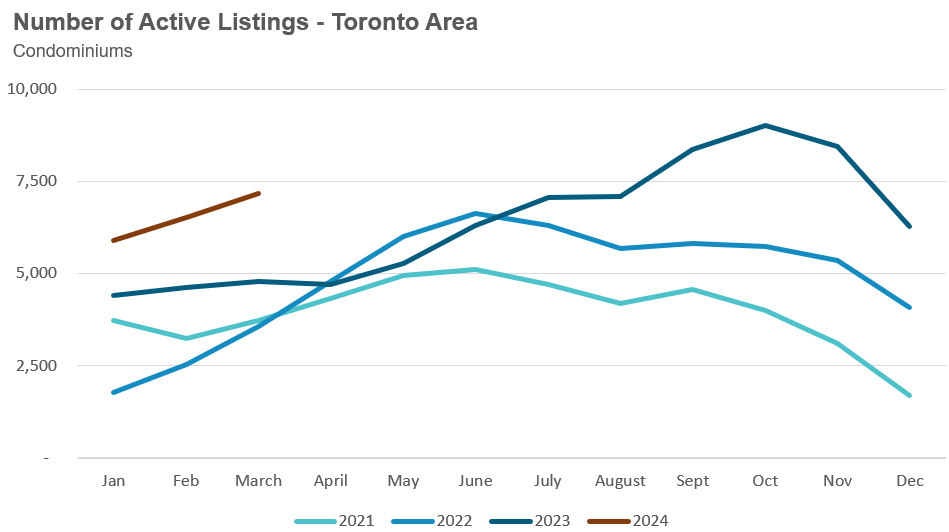
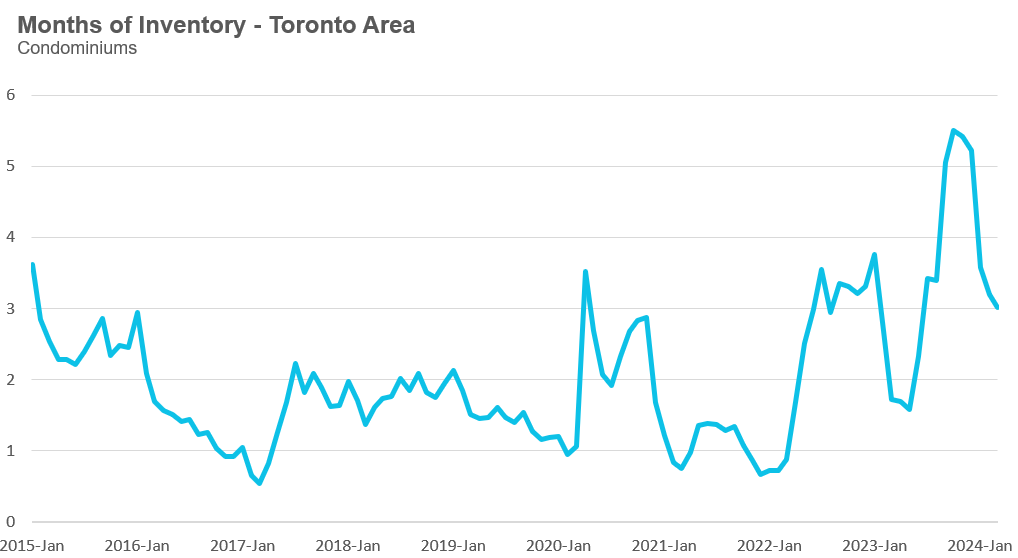
Condo sales in March were down 15% over last year, and new condo listings were up 19% over last year. The number of active condo listings was up 49% over last year. The MOI decreased slightly to 3.
Browse detailed monthly statistics for March 2023 for the entire Toronto area market, including house, condo and regional breakdowns below.
House Statistics
House sales (low-rise freehold detached, semi-detached, townhouse, etc.) in the Greater Toronto Area (GTA) in March 2023 were down 6% compared to the same month last year.
New house listings in March were 17% compared to last year.
The number of houses available for sale (“active listings”) was up 42% in March compared to the same month last year.
The Months of Inventory ratio (MOI) looks at the number of homes available for sale in a given month divided by the number of homes sold in that month. It answers the following question: If no more homes came on the market for sale, how long would it take for all the existing homes on the market to sell, given the current level of demand? The higher the MOI, the cooler the market is. A balanced market (a market where prices are neither rising nor falling) is one where MOI is between four to six months. The lower the MOI, the more rapidly we would expect prices to rise.
While the current level of MOI gives us clues into how competitive the market is on-the-ground today, the direction it is moving in also gives us some clues into where the market may be heading.
The MOI for houses dipped to 1.8 in March, down from 4 MOI in October.
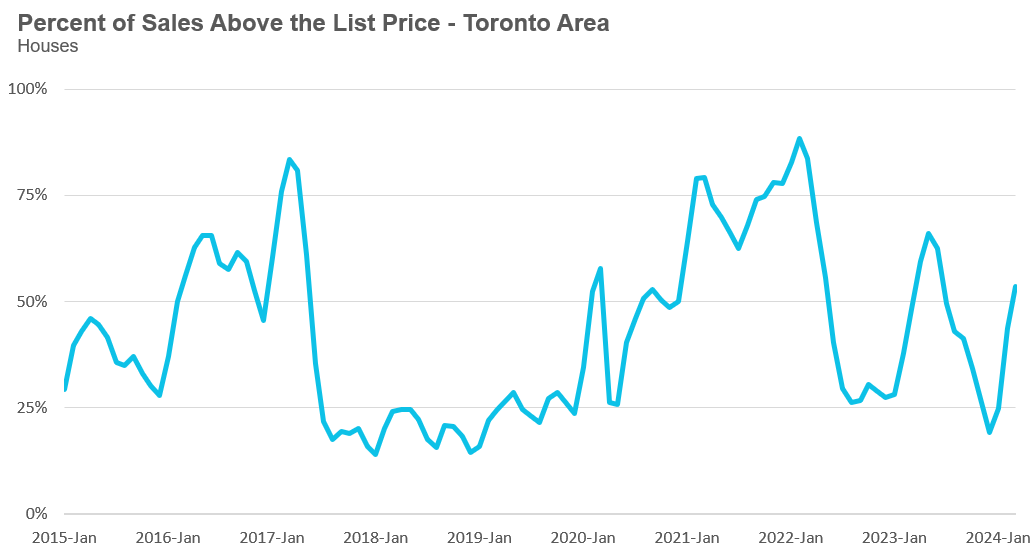
The share of houses selling for more than the owner’s list price increased to 54% in March.
The average price for a house in March was $1,373,316 in March 2024, unchanged compared to the same month last year.
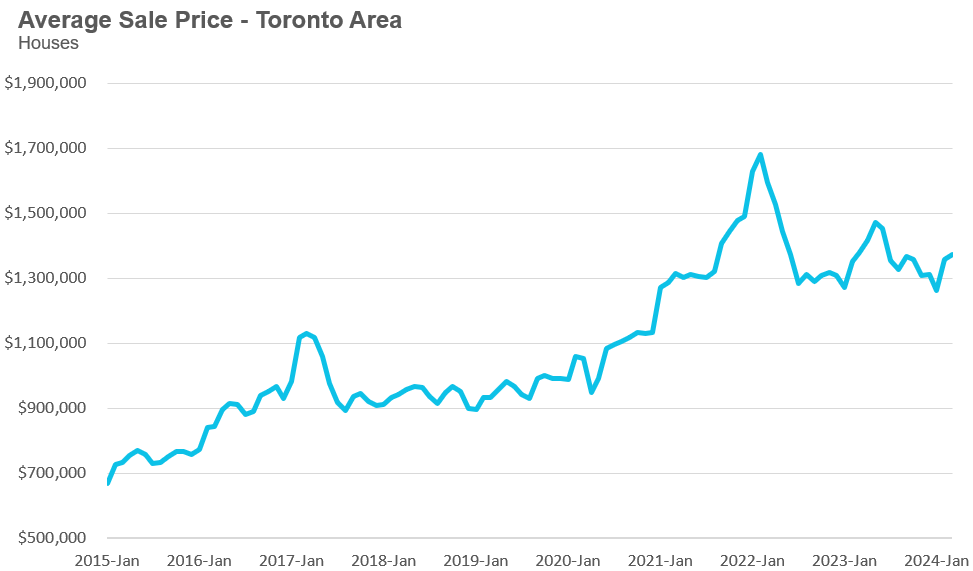
The median house price in March was $1,218,500, unchanged over last year.
The median is calculated by ordering all the sale prices in a given month and then selecting the price at the midpoint of that list such that half of all home sales are above that price and half are below that price. Economists often prefer the median price over the average because it is less sensitive to big increases in the sale of high-end or low-end homes in a given month, which can skew the average price.
Condo Statistics
Condo (condominiums, including condo apartments, condo townhouses, etc.) sales in the Toronto area in March 2023 were down 15% over the same month last year.
New condo listings were up 19% in March over last year.
The number of condos available for sale at the end of the month, or active listings, was up 49% over last year.
Condo months of inventory decreased slightly to 3 MOI in March.
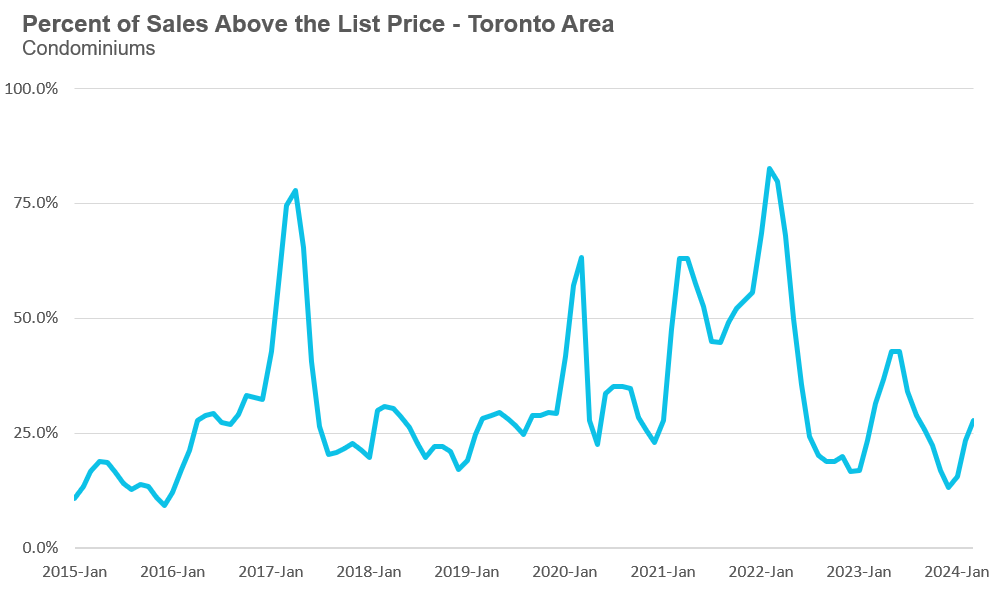
The share of condos selling for over the asking price increased to 27% in March.
The average price for a condo in March was $728,585, unchanged over last year. The median price for a condo in March was $670,000, up 1% over last year.
Regional Trends
Houses
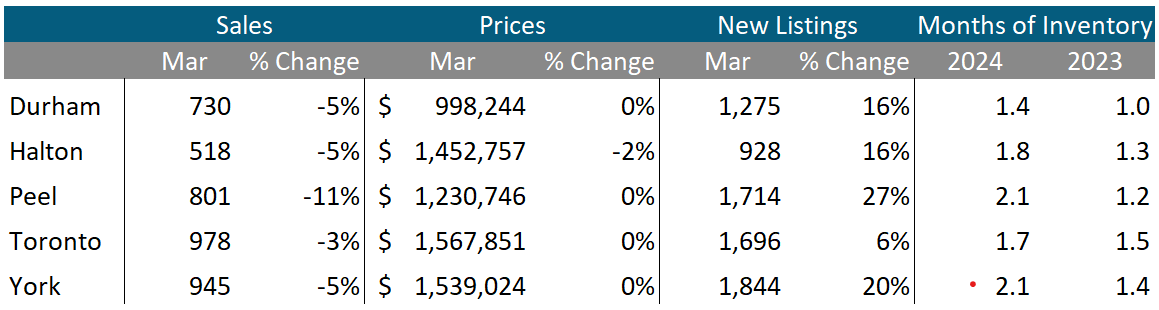
All five regions saw sales decline over last year. Halton saw average prices decrease by 2%, while all other regions saw no change in average prices. All five regions saw significant increases in new listings in March, while the MOI was above last year.
Condos
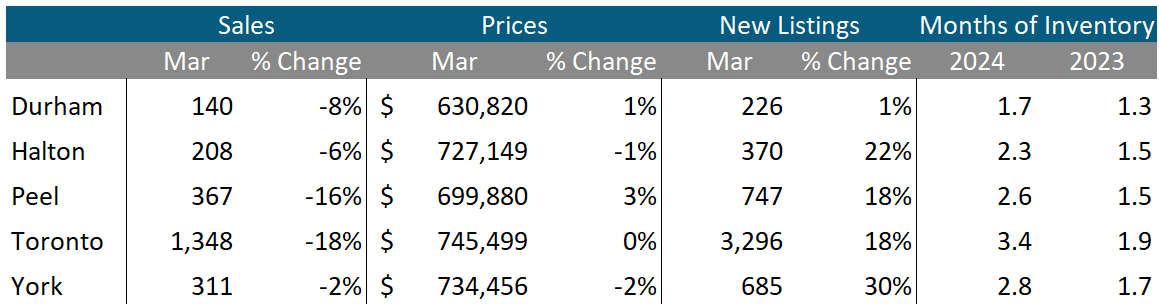
Condo sales were down in all five regions in March. Average prices were down in Halton and York, unchanged in Toronto and up slightly in Durham and Peel. The MOI is above last year’s level for all regions.
Browse Real-Time Market Trends on Movesmartly.com:
See Market Performance by Neighbourhood Map, All Toronto and the GTA
Greater Toronto Area Market Trends

John Pasalis is President of Realosophy Realty. A specialist in real estate data analysis, John’s research focuses on unlocking micro trends in the Greater Toronto Area real estate market. His research has been utilized by the Bank of Canada, the Canadian Mortgage and Housing Corporation (CMHC) and the International Monetary Fund (IMF).
Have questions about your own moves in the Toronto area as a buyer, seller, investor or renter? Book a no-obligation consult with John and his team at a Realosophy here: https://www.movesmartly.com/meetjohn
Published: April 09, 2024


