
GTA Housing Market Update – October 2025
Sentiment in the housing market remains cautious. Buyers who are active today are focused on value and can see that prices have been gradually trending down over the past 6–12 months. While a few of the most desirable homes in top neighbourhoods continue to attract multiple offers, these are the exceptions, not the rule. For most houses and condos, conditions remain firmly in buyer’s market territory.
Low-Rise Market: A Cooling After a Brief Rebound
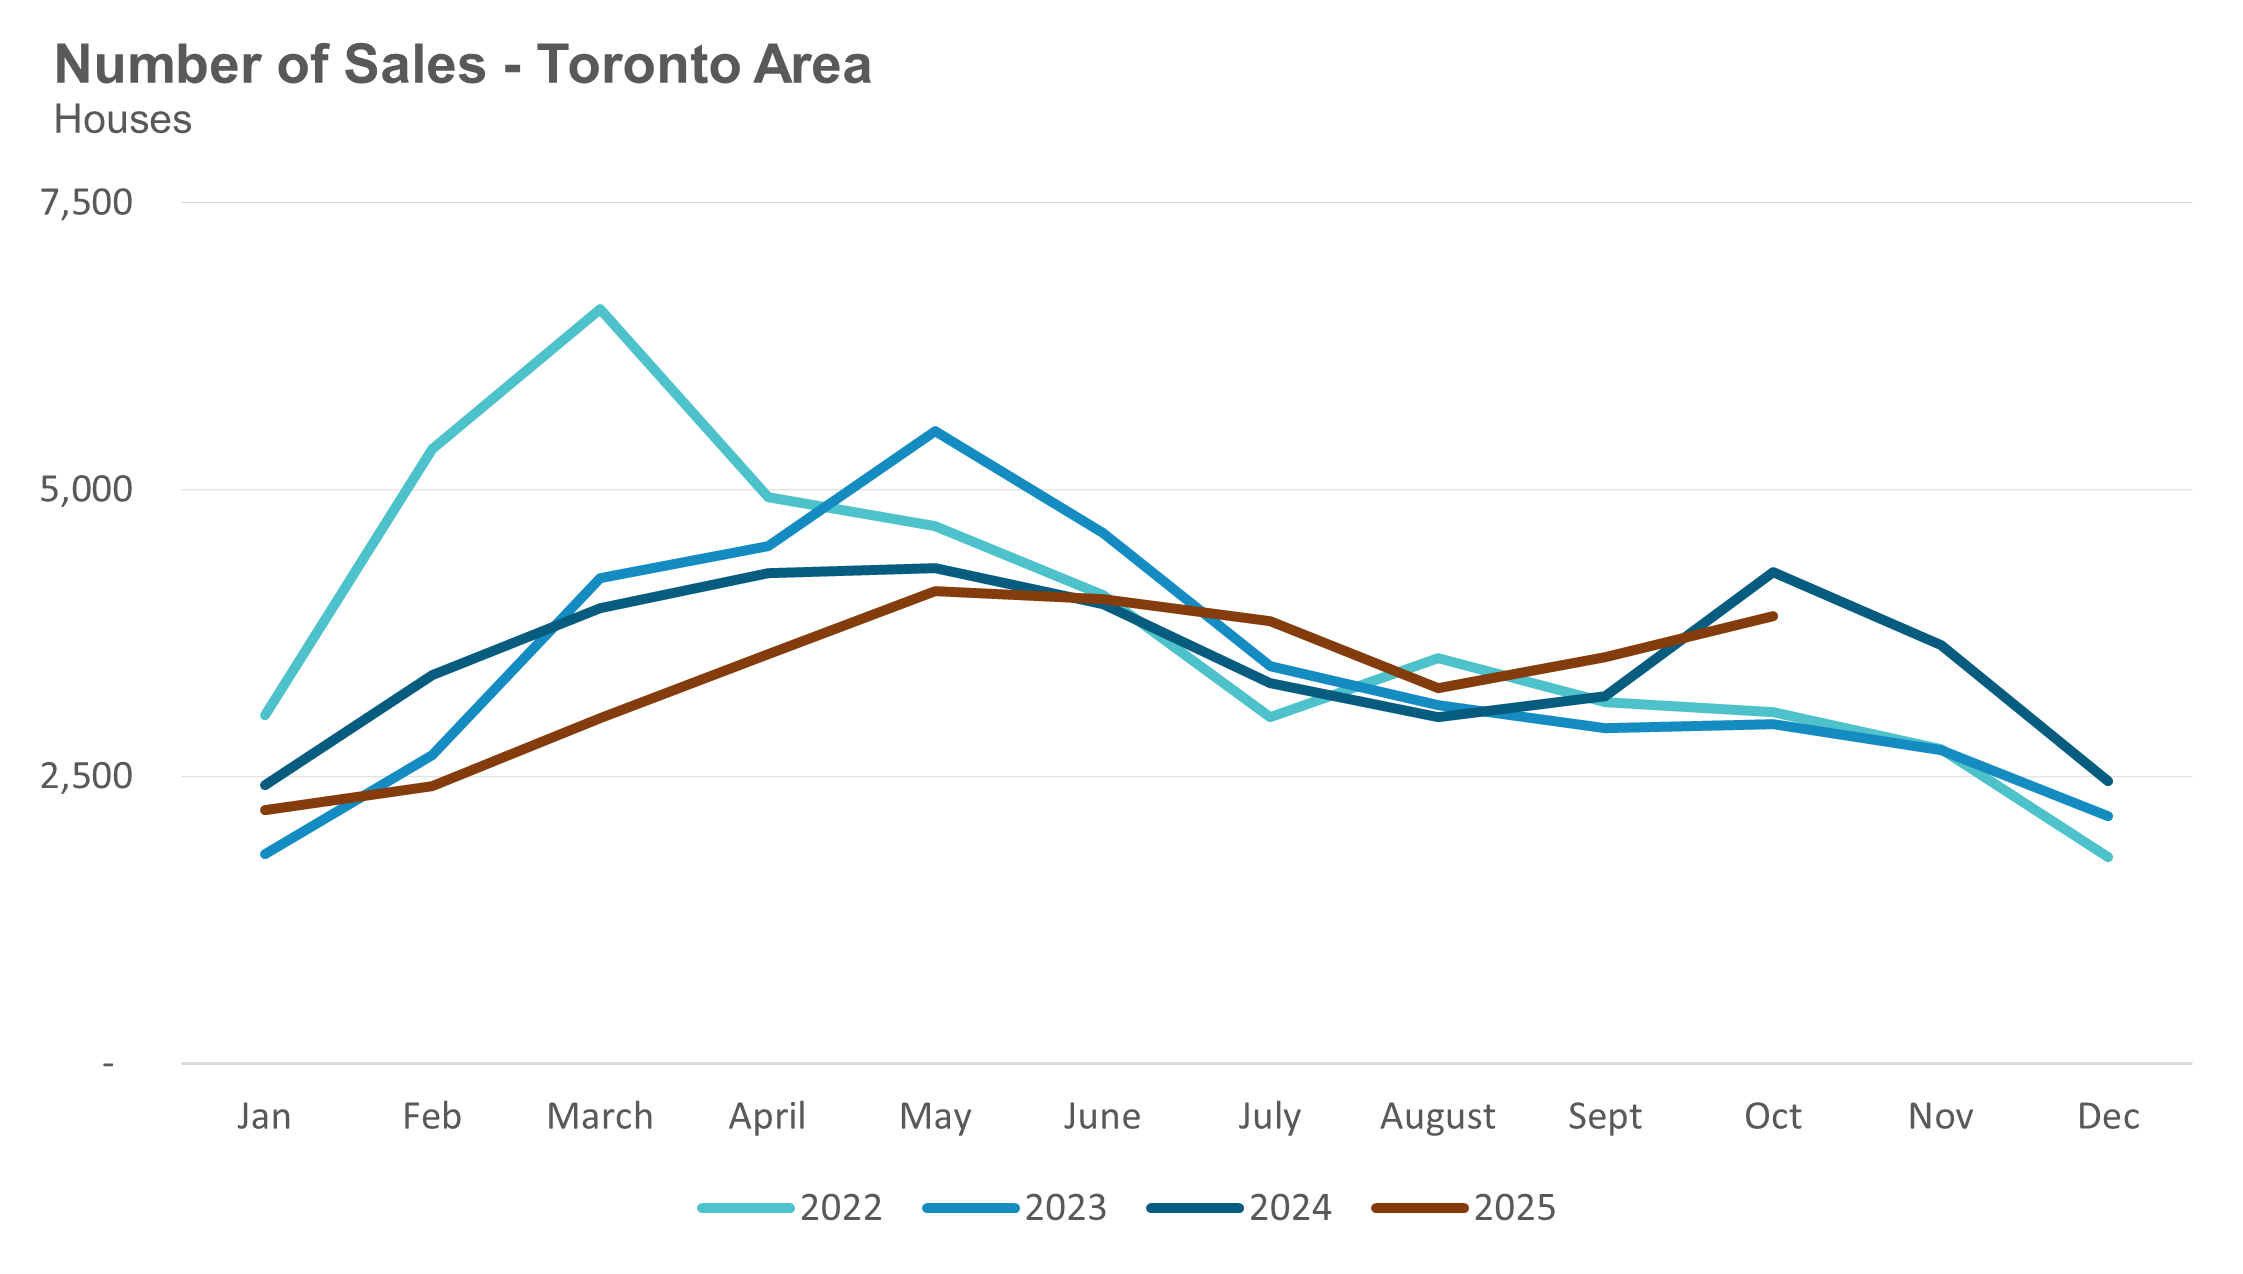
Sales of detached, semi-detached, and townhomes were down 9% year-over-year in October.
It’s worth remembering that for most of the past three years, sales volumes sat near 20-year lows. We saw a brief rebound in late 2024, when optimism around a potential price acceleration pushed October 2024 sales up 45% over 2023. That enthusiasm has since faded.
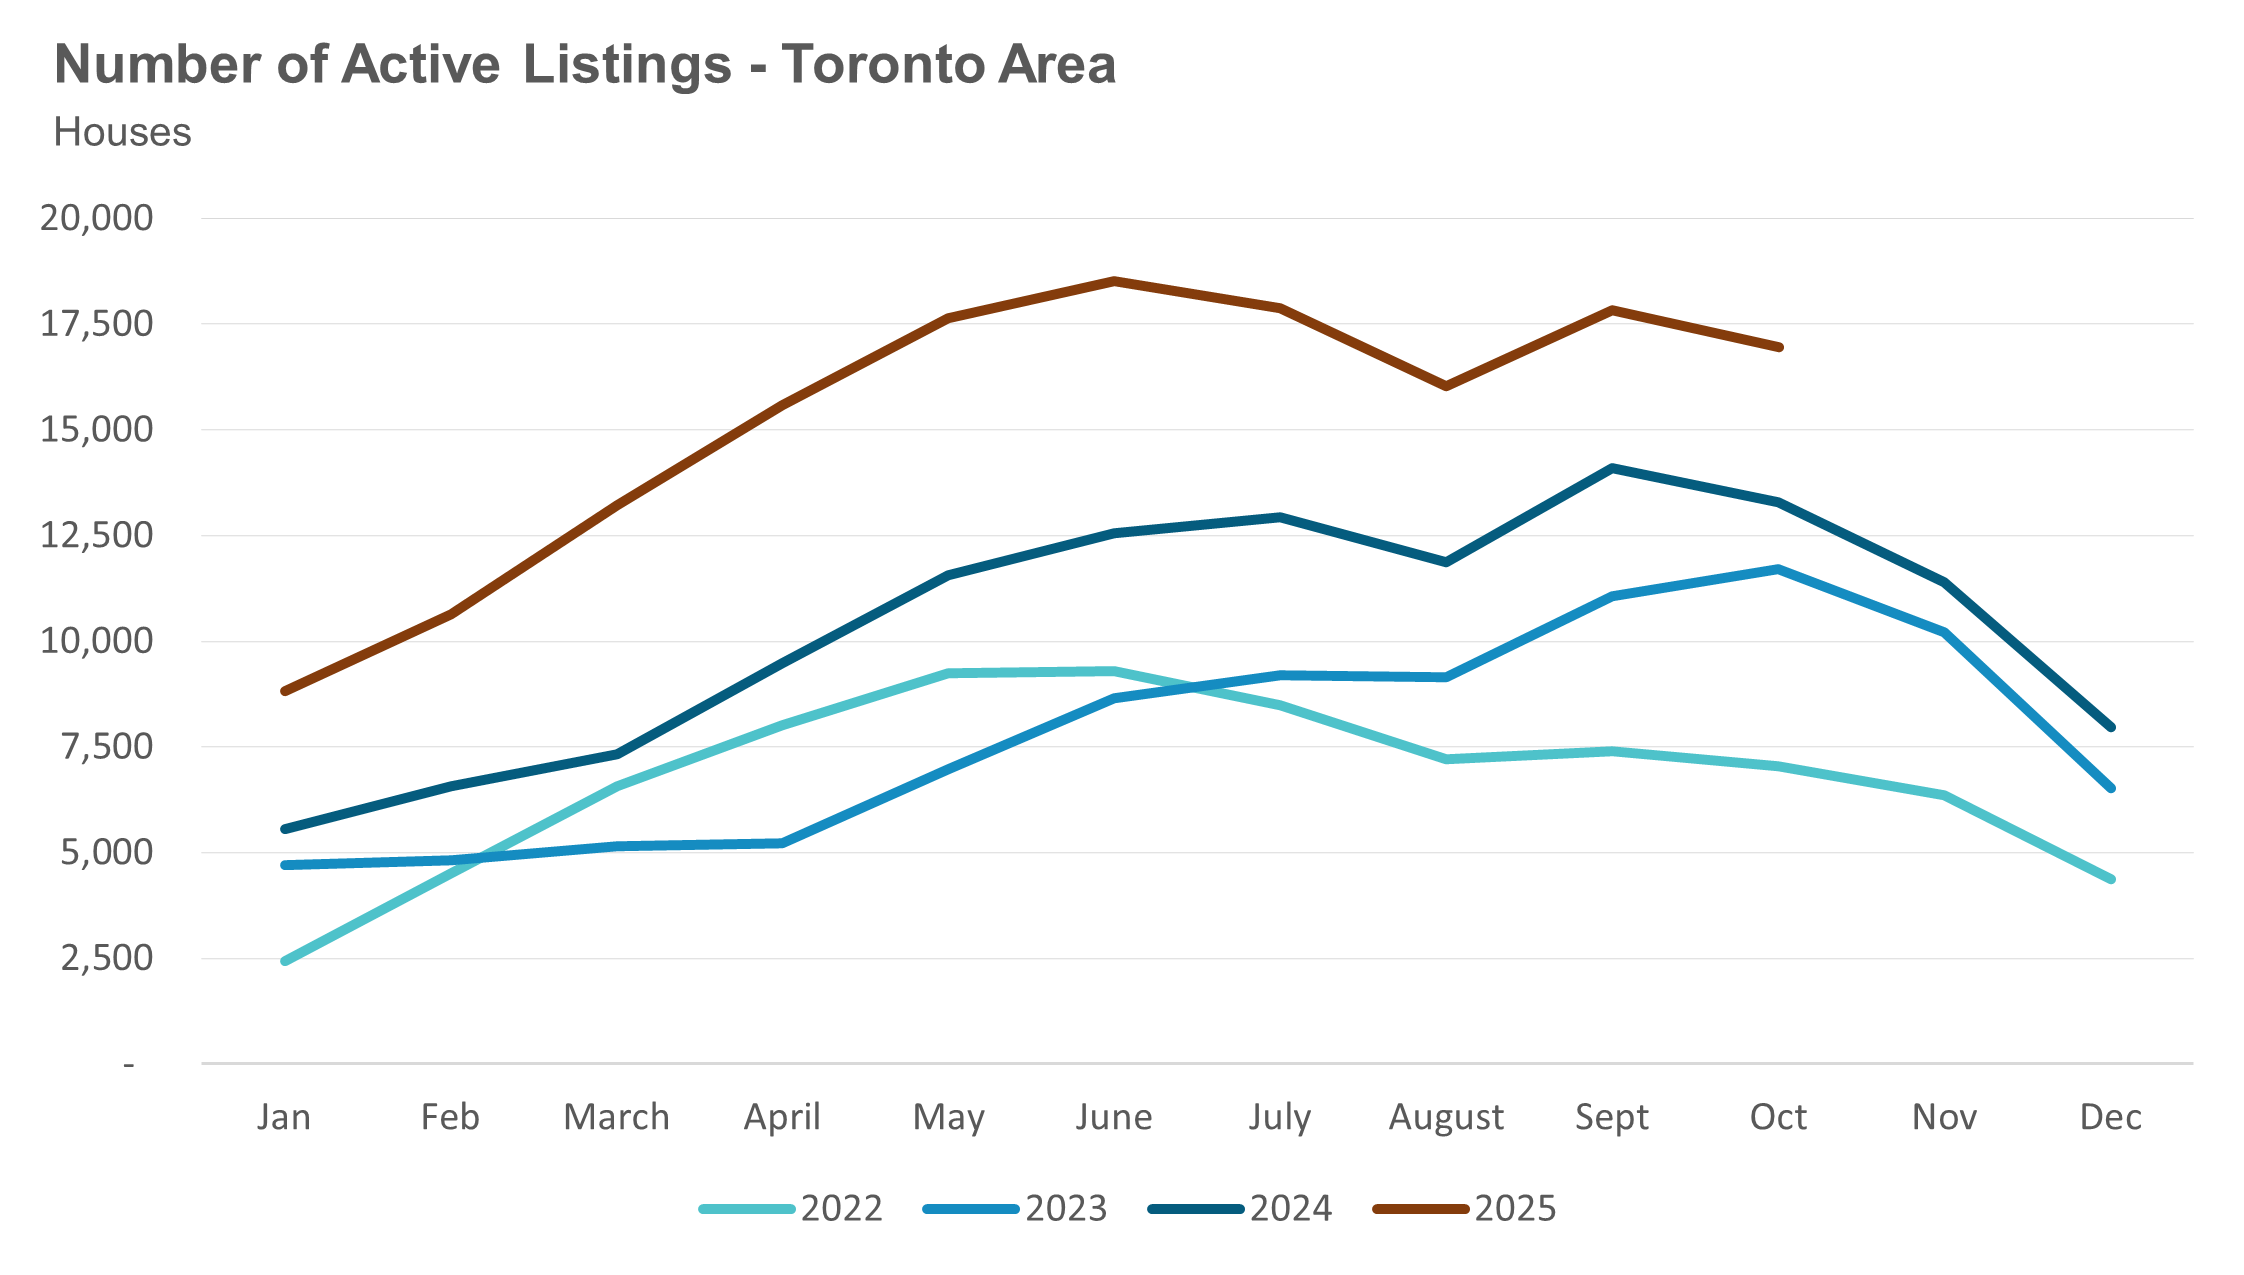
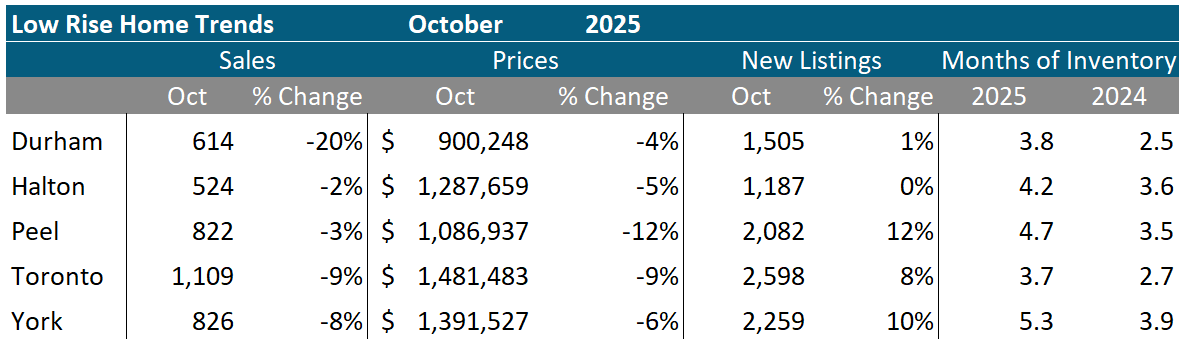
Active listings were up 28% from last year, as new listing volumes continue to run well ahead of 2024 levels. With softer demand and rising supply, average and median prices for low-rise homes fell roughly 7% year-over-year, with Peel Region down 12% and Durham down 4%.
Condo Market: Gradual Softening Continues
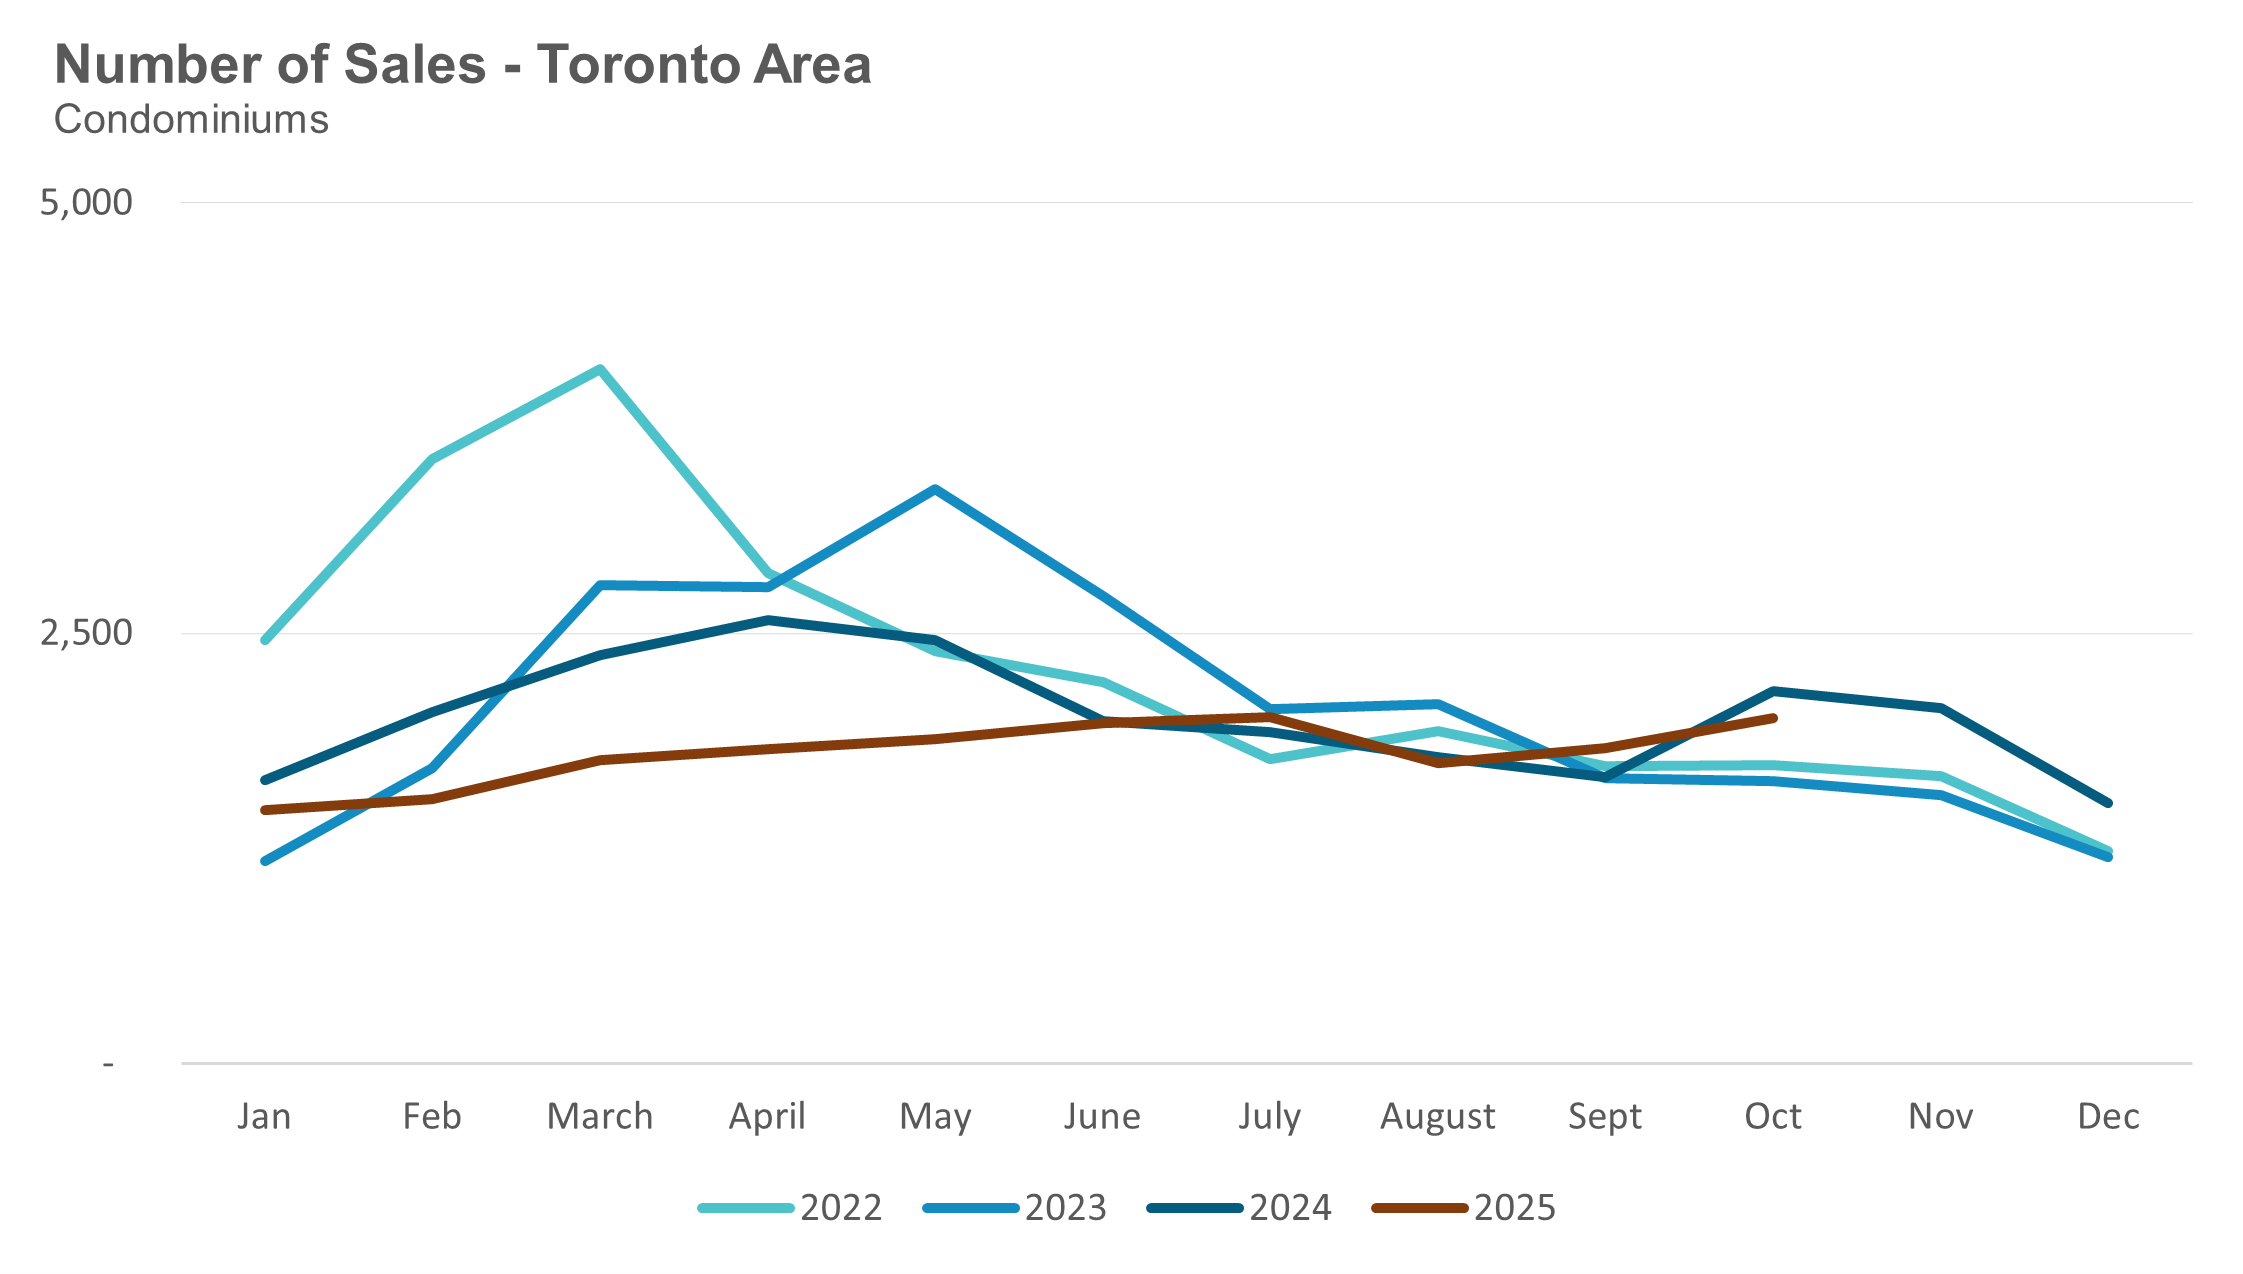
Condo sales saw a similar bump in 2024 but have since eased, down 7% year-over-year this October.
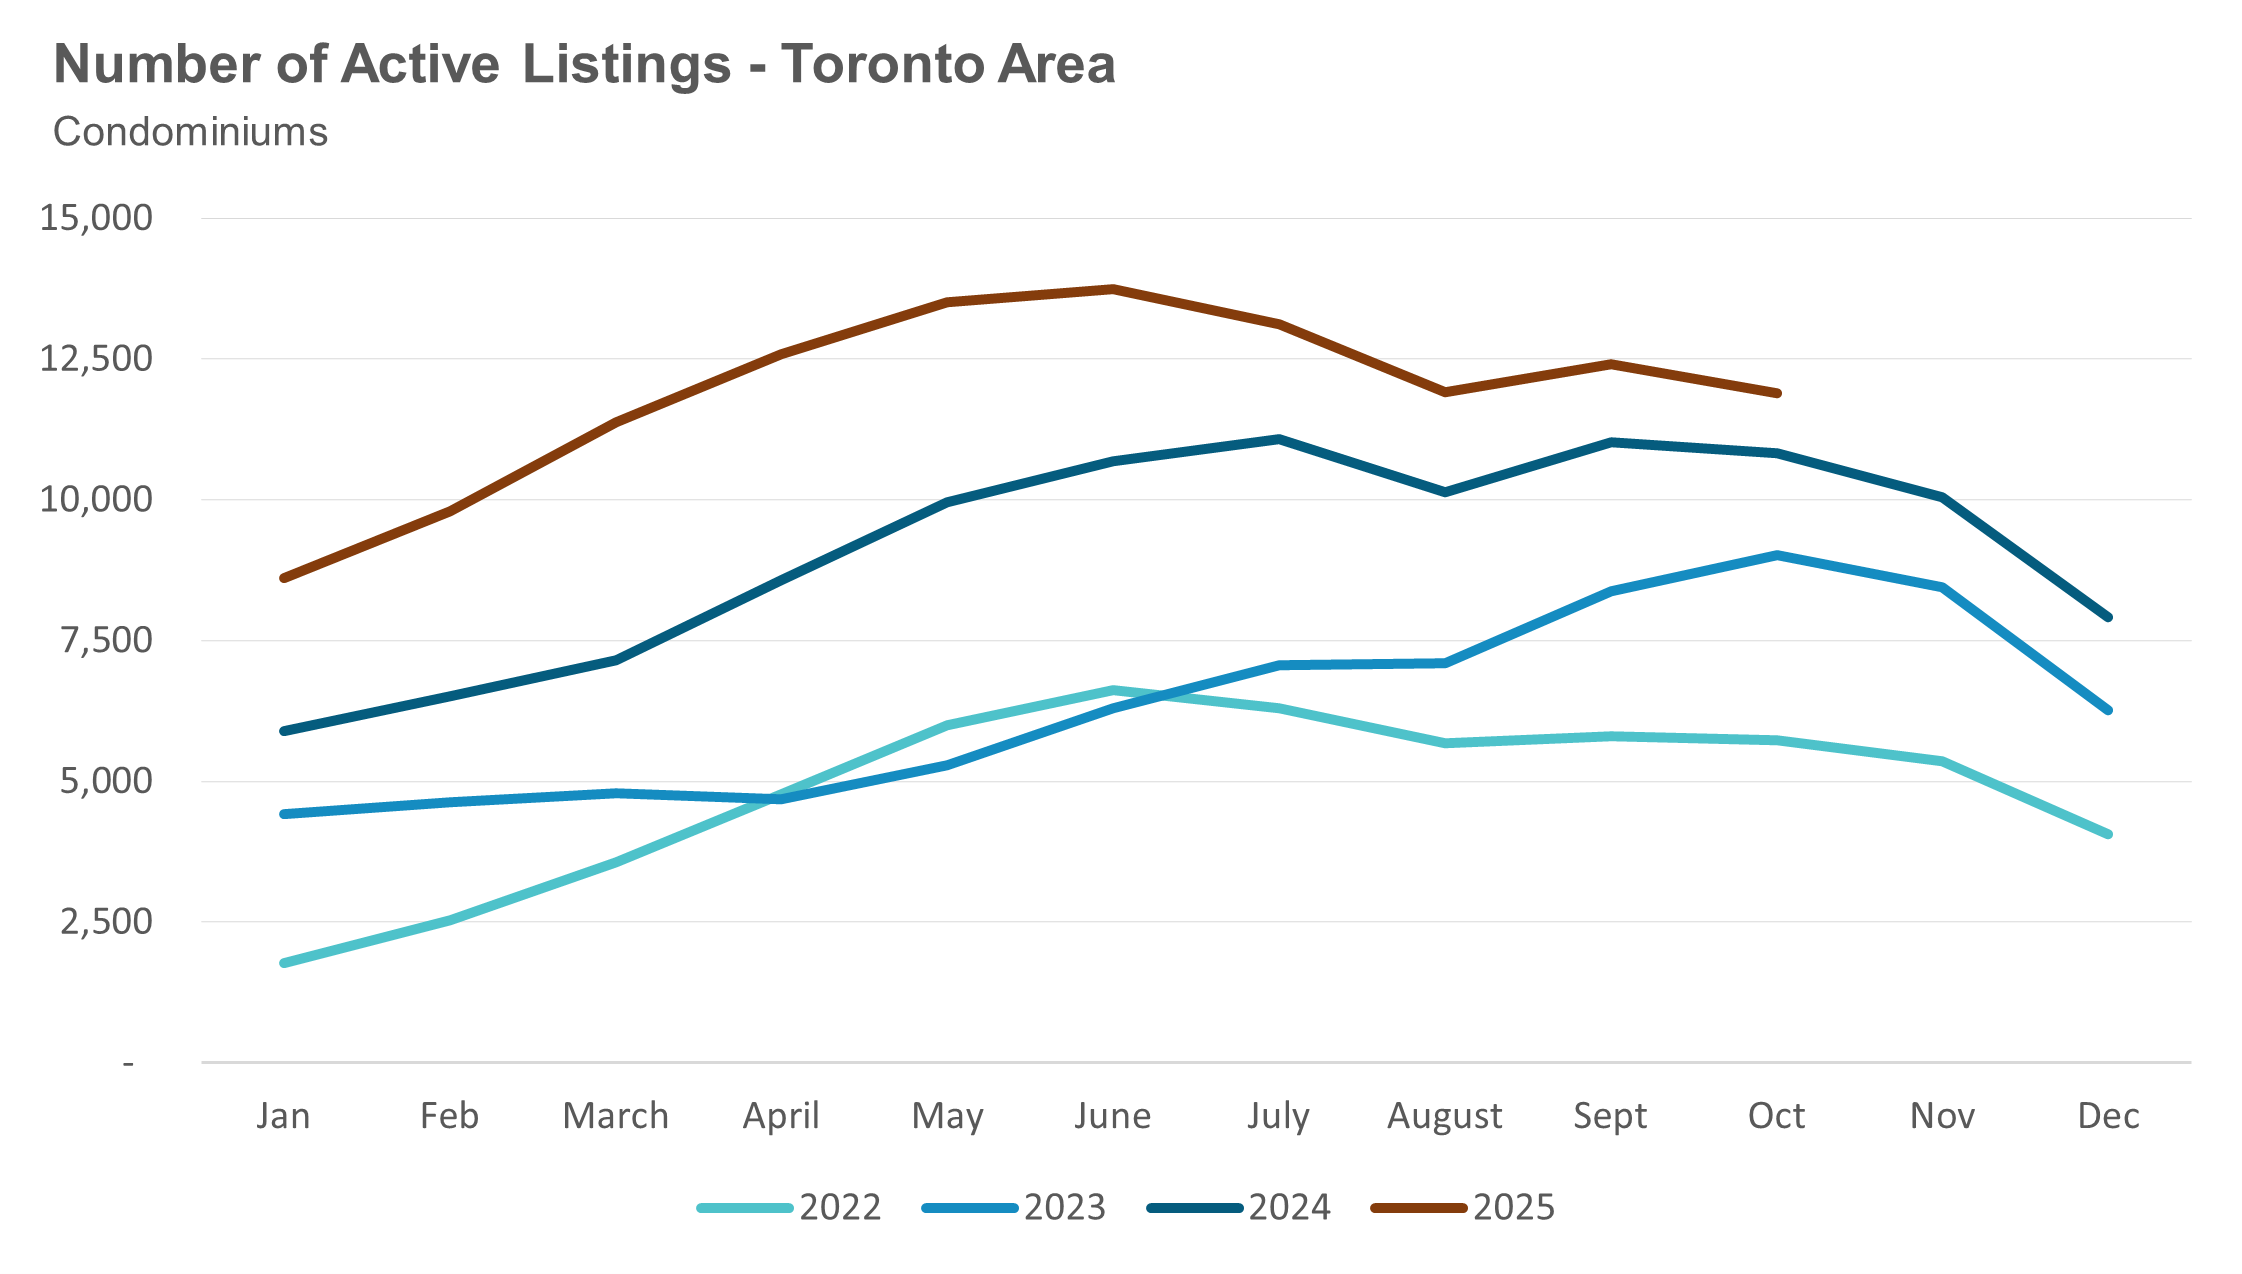
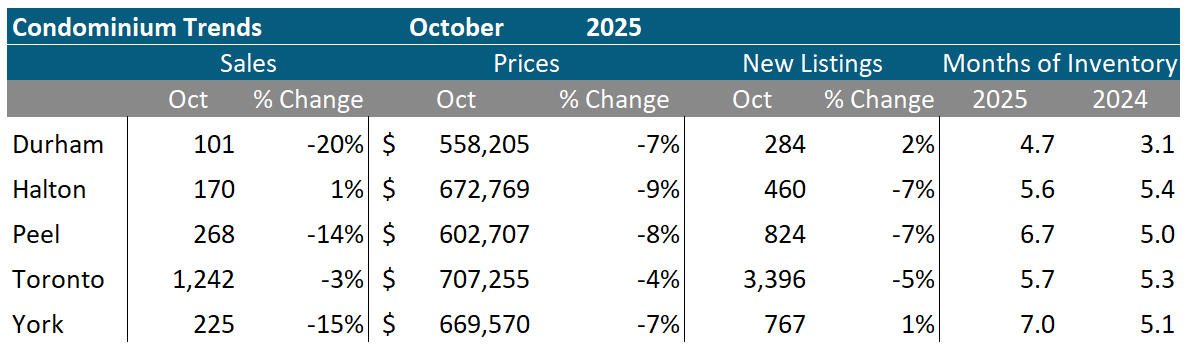
New listings were down 3%, but active listings were up 10%, suggesting that units are sitting longer on the market. Average condo prices were down 5% year-over-year, with the median down 7%, reflecting continued downward pressure across much of the GTA.
The Bottom Line
The GTA housing market continues to adjust to higher borrowing costs, a slower economy, and shifting buyer psychology. With inventory still rising and sentiment subdued, buyers remain in the driver’s seat.
Monthly Statistics
House Statistics
House sales (low-rise freehold detached, semi-detached, townhouse, etc.) in the Greater Toronto Area (GTA) in October 2025 were down 7% compared to the same month last year.
New house listings in October were up 9% compared to last year.

The number of houses available for sale (“active listings”) was up 28% in October compared to the same month last year.
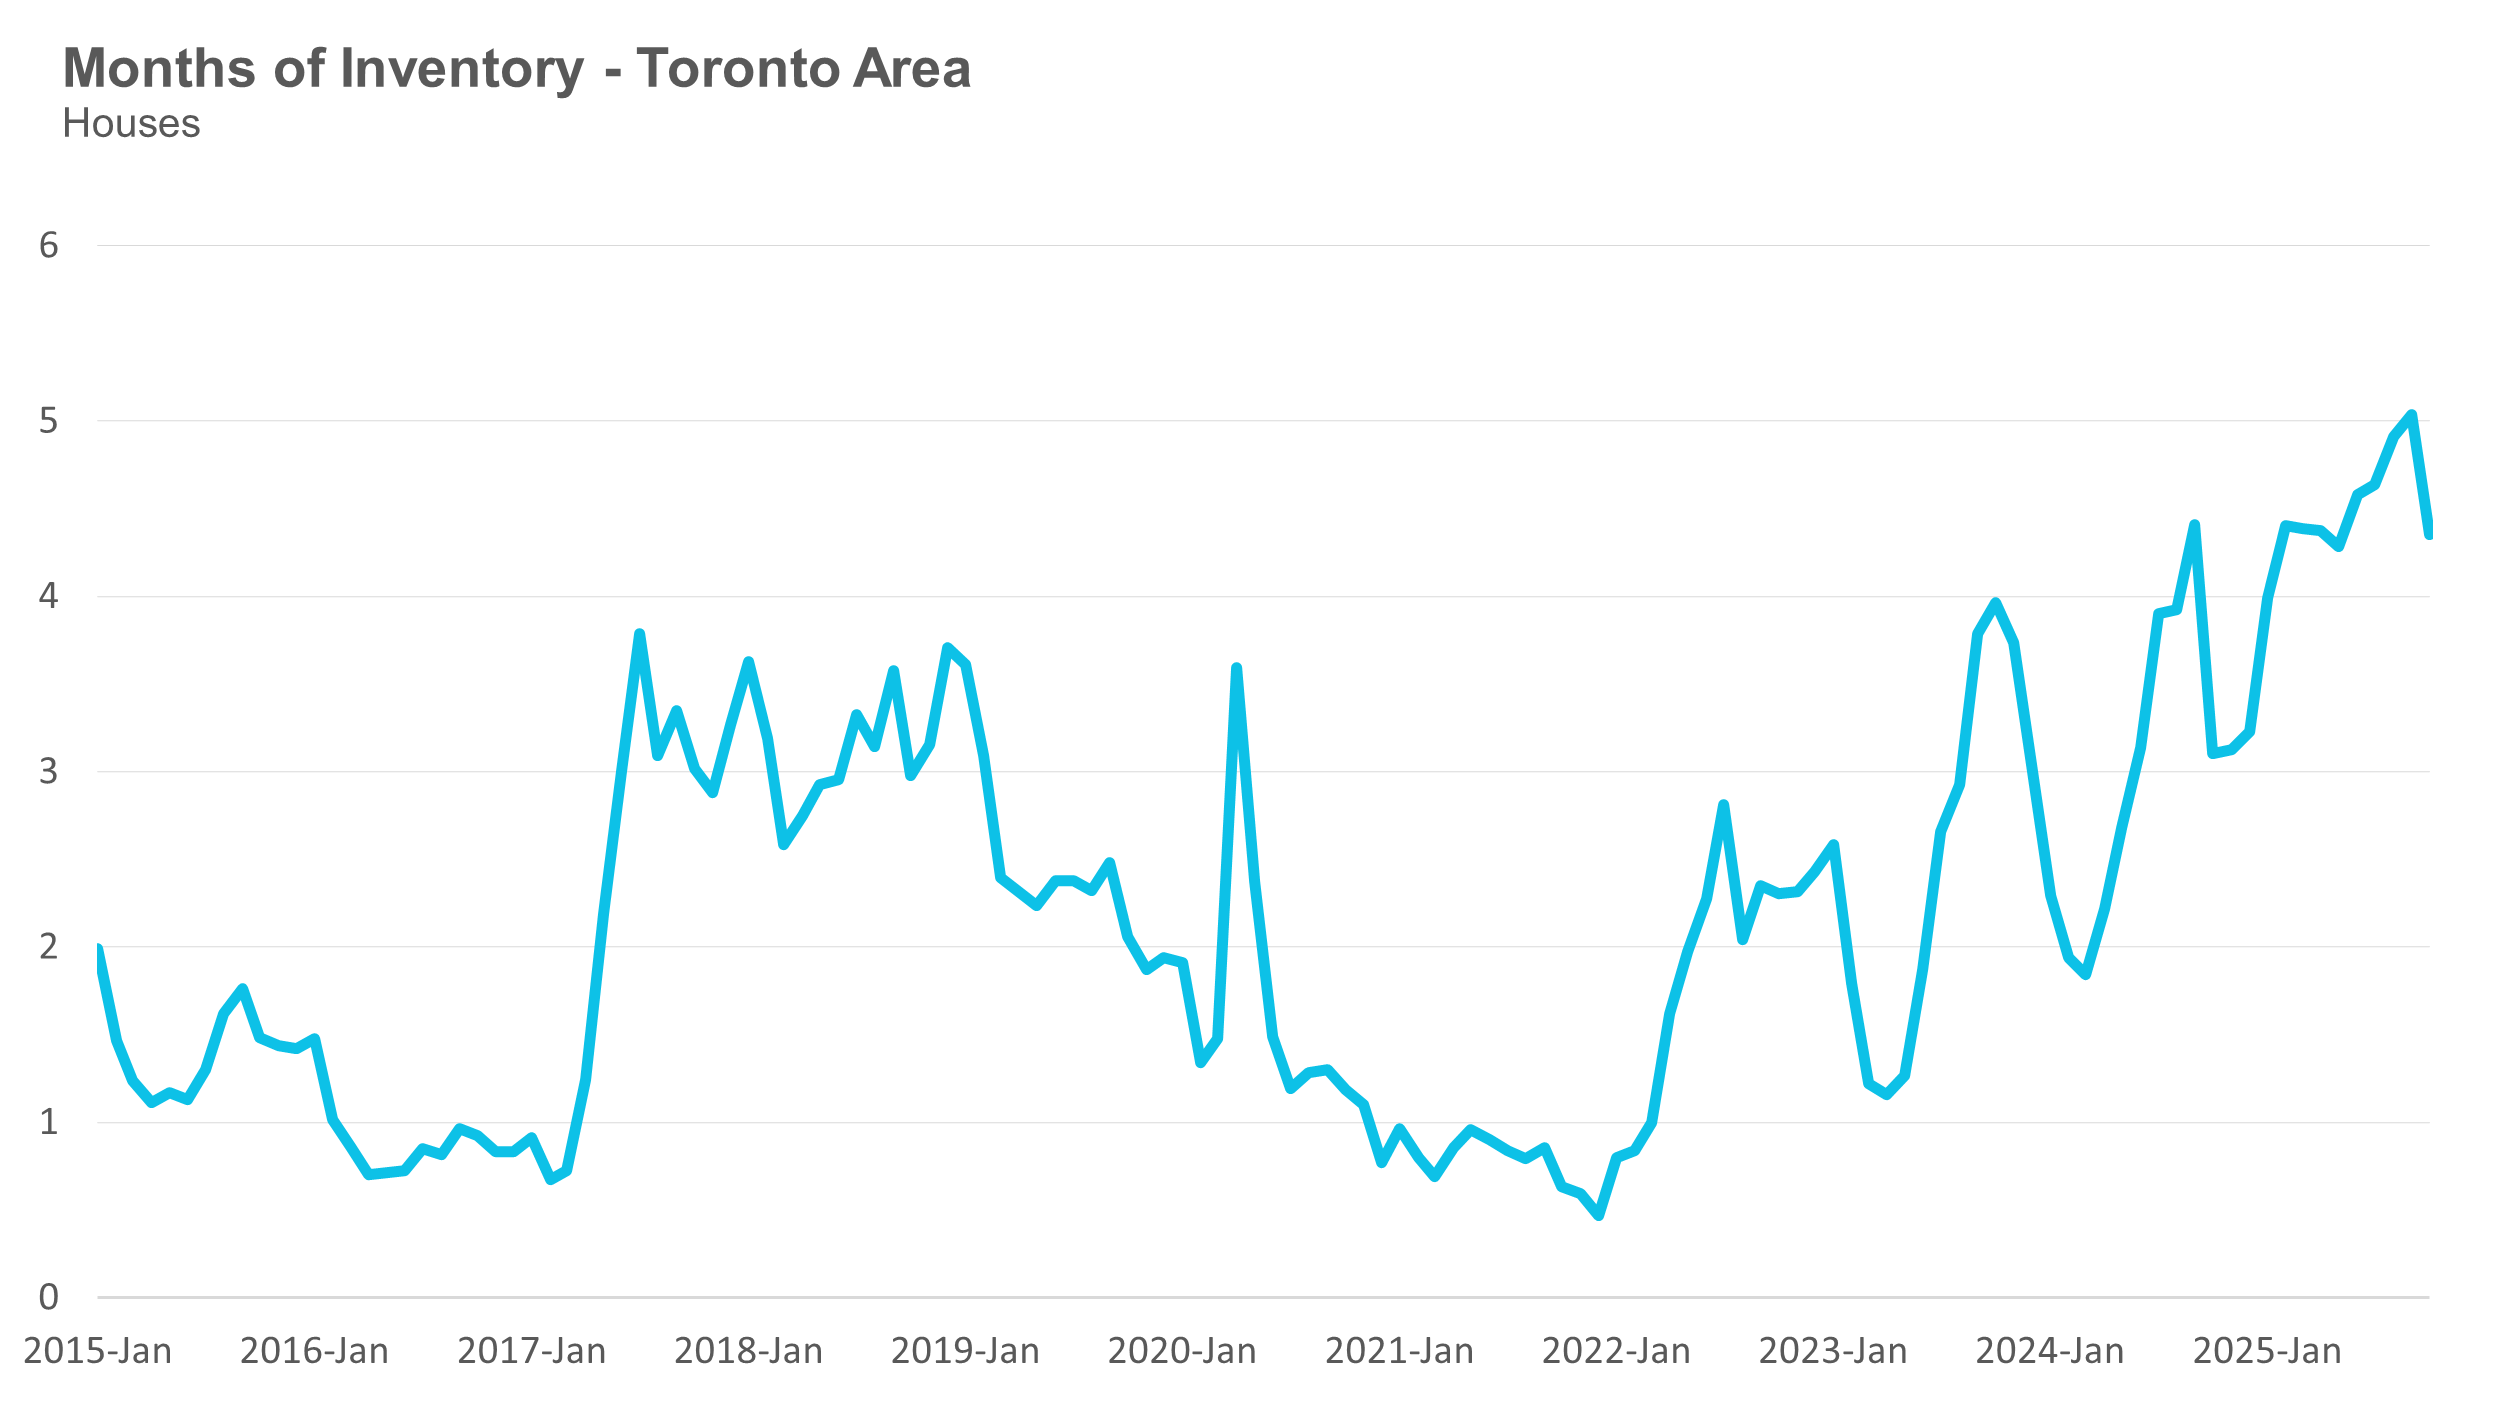
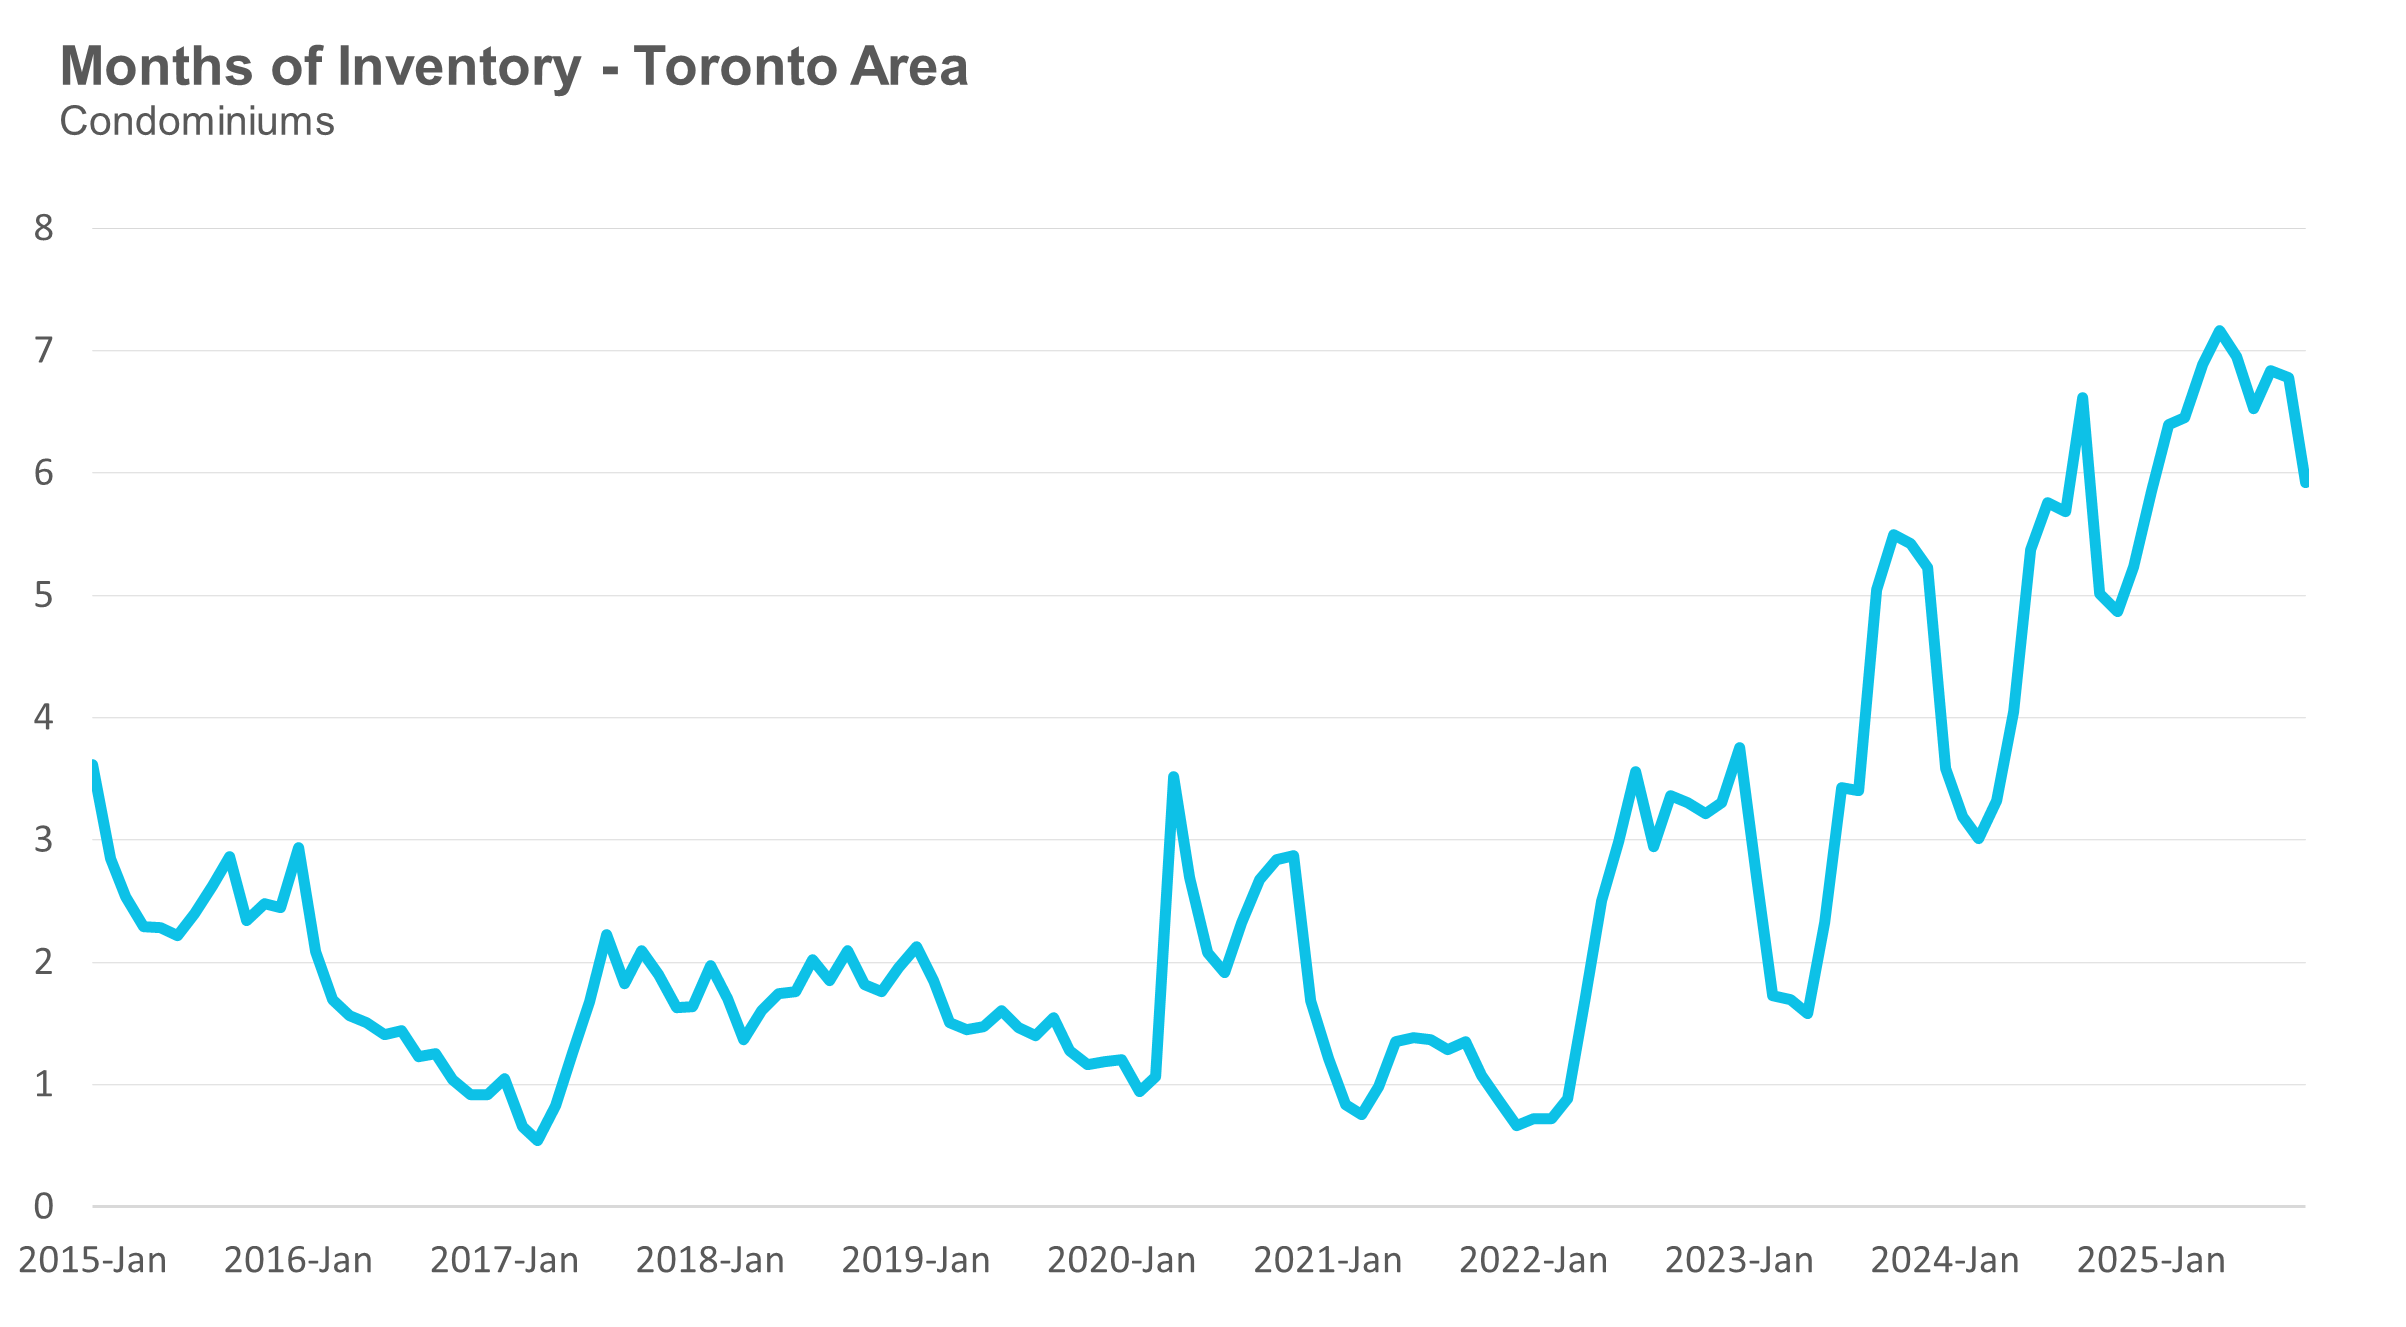
The Months of Inventory ratio (MOI) looks at the number of homes available for sale in a given month divided by the number of homes sold in that month. It answers the following question: If no more homes came on the market for sale, how long would it take for all the existing homes on the market to sell, given the current level of demand? The higher the MOI, the cooler the market is. A balanced market (a market where prices are neither rising nor falling) is one where MOI is between four to six months. The lower the MOI, the more rapidly we would expect prices to rise.
While the current level of MOI gives us clues into how competitive the market is on-the-ground today, the direction it is moving in also gives us some clues into where the market October is heading.
The MOI for houses fell to 4.4 in October.
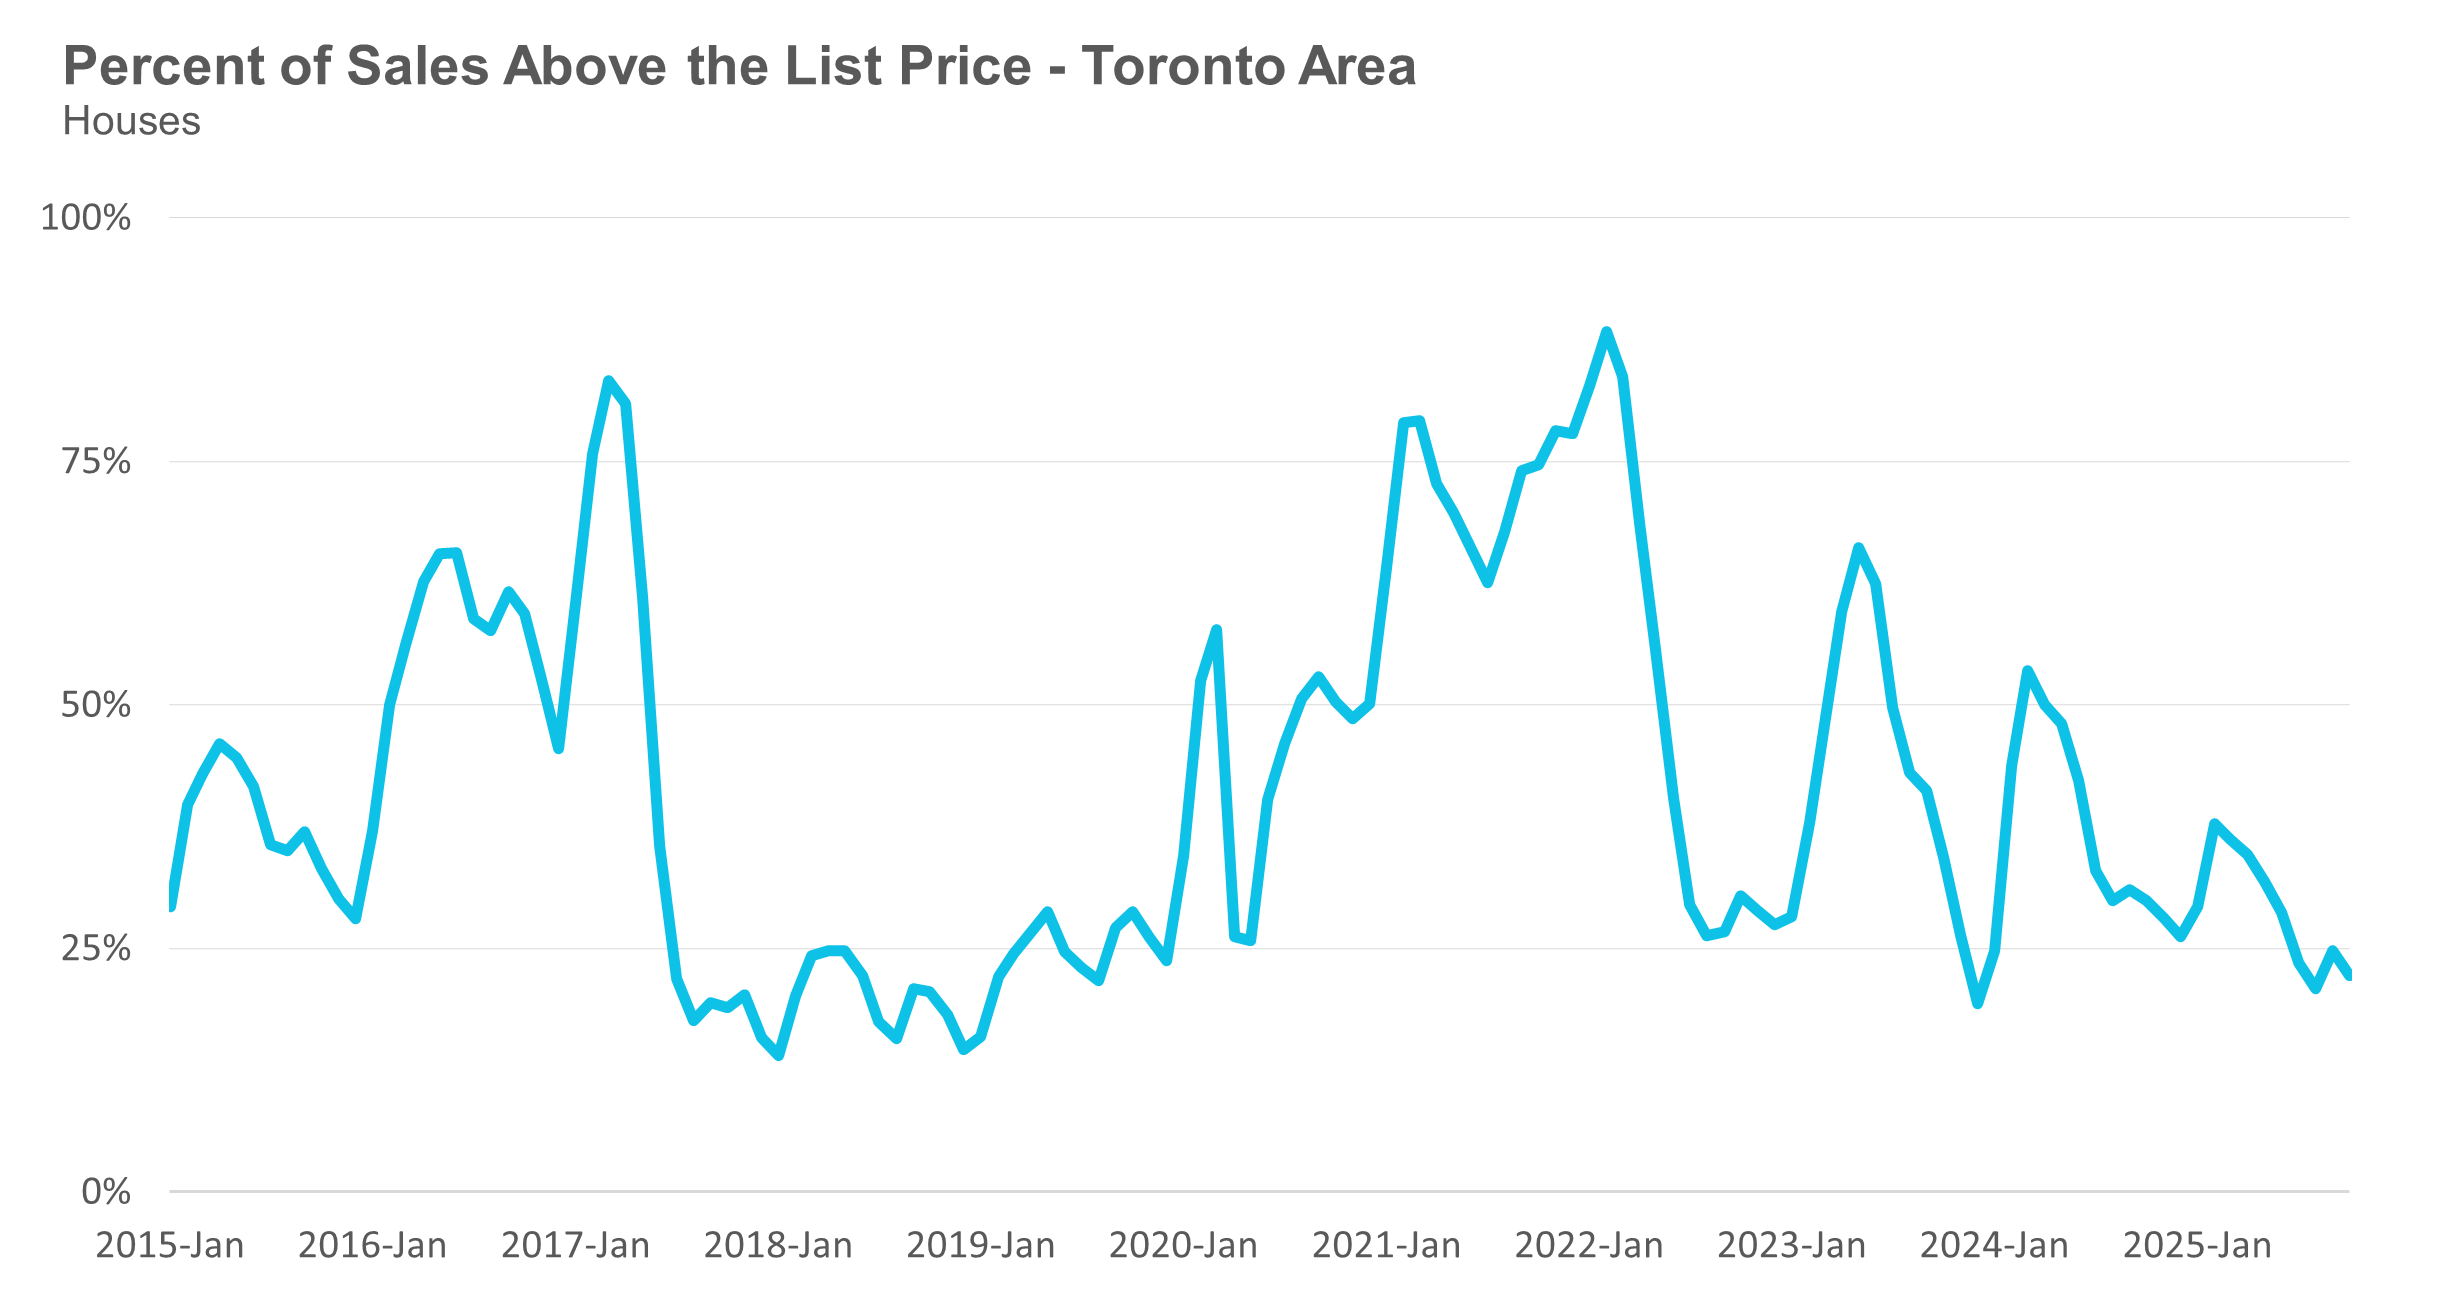
The share of houses selling for more than the owner’s list price fell to 22% in October.
The average price for a house in October 2025, $1,261,441, was down 7% from the same month last year.

The median house price in October was $1,069,990, down 7% over last year.
The median is calculated by ordering all the sale prices in a given month and then selecting the price at the midpoint of that list such that half of all home sales are above that price and half are below that price. Economists often prefer the median price over the average because it is less sensitive to big increases in the sale of high-end or low-end homes in a given month, which can skew the average price.
Condo Statistics
Condo (condominiums, including condo apartments, condo townhouses, etc.) sales in the Toronto area in October 2025 were down 7% compared to the same month last year.
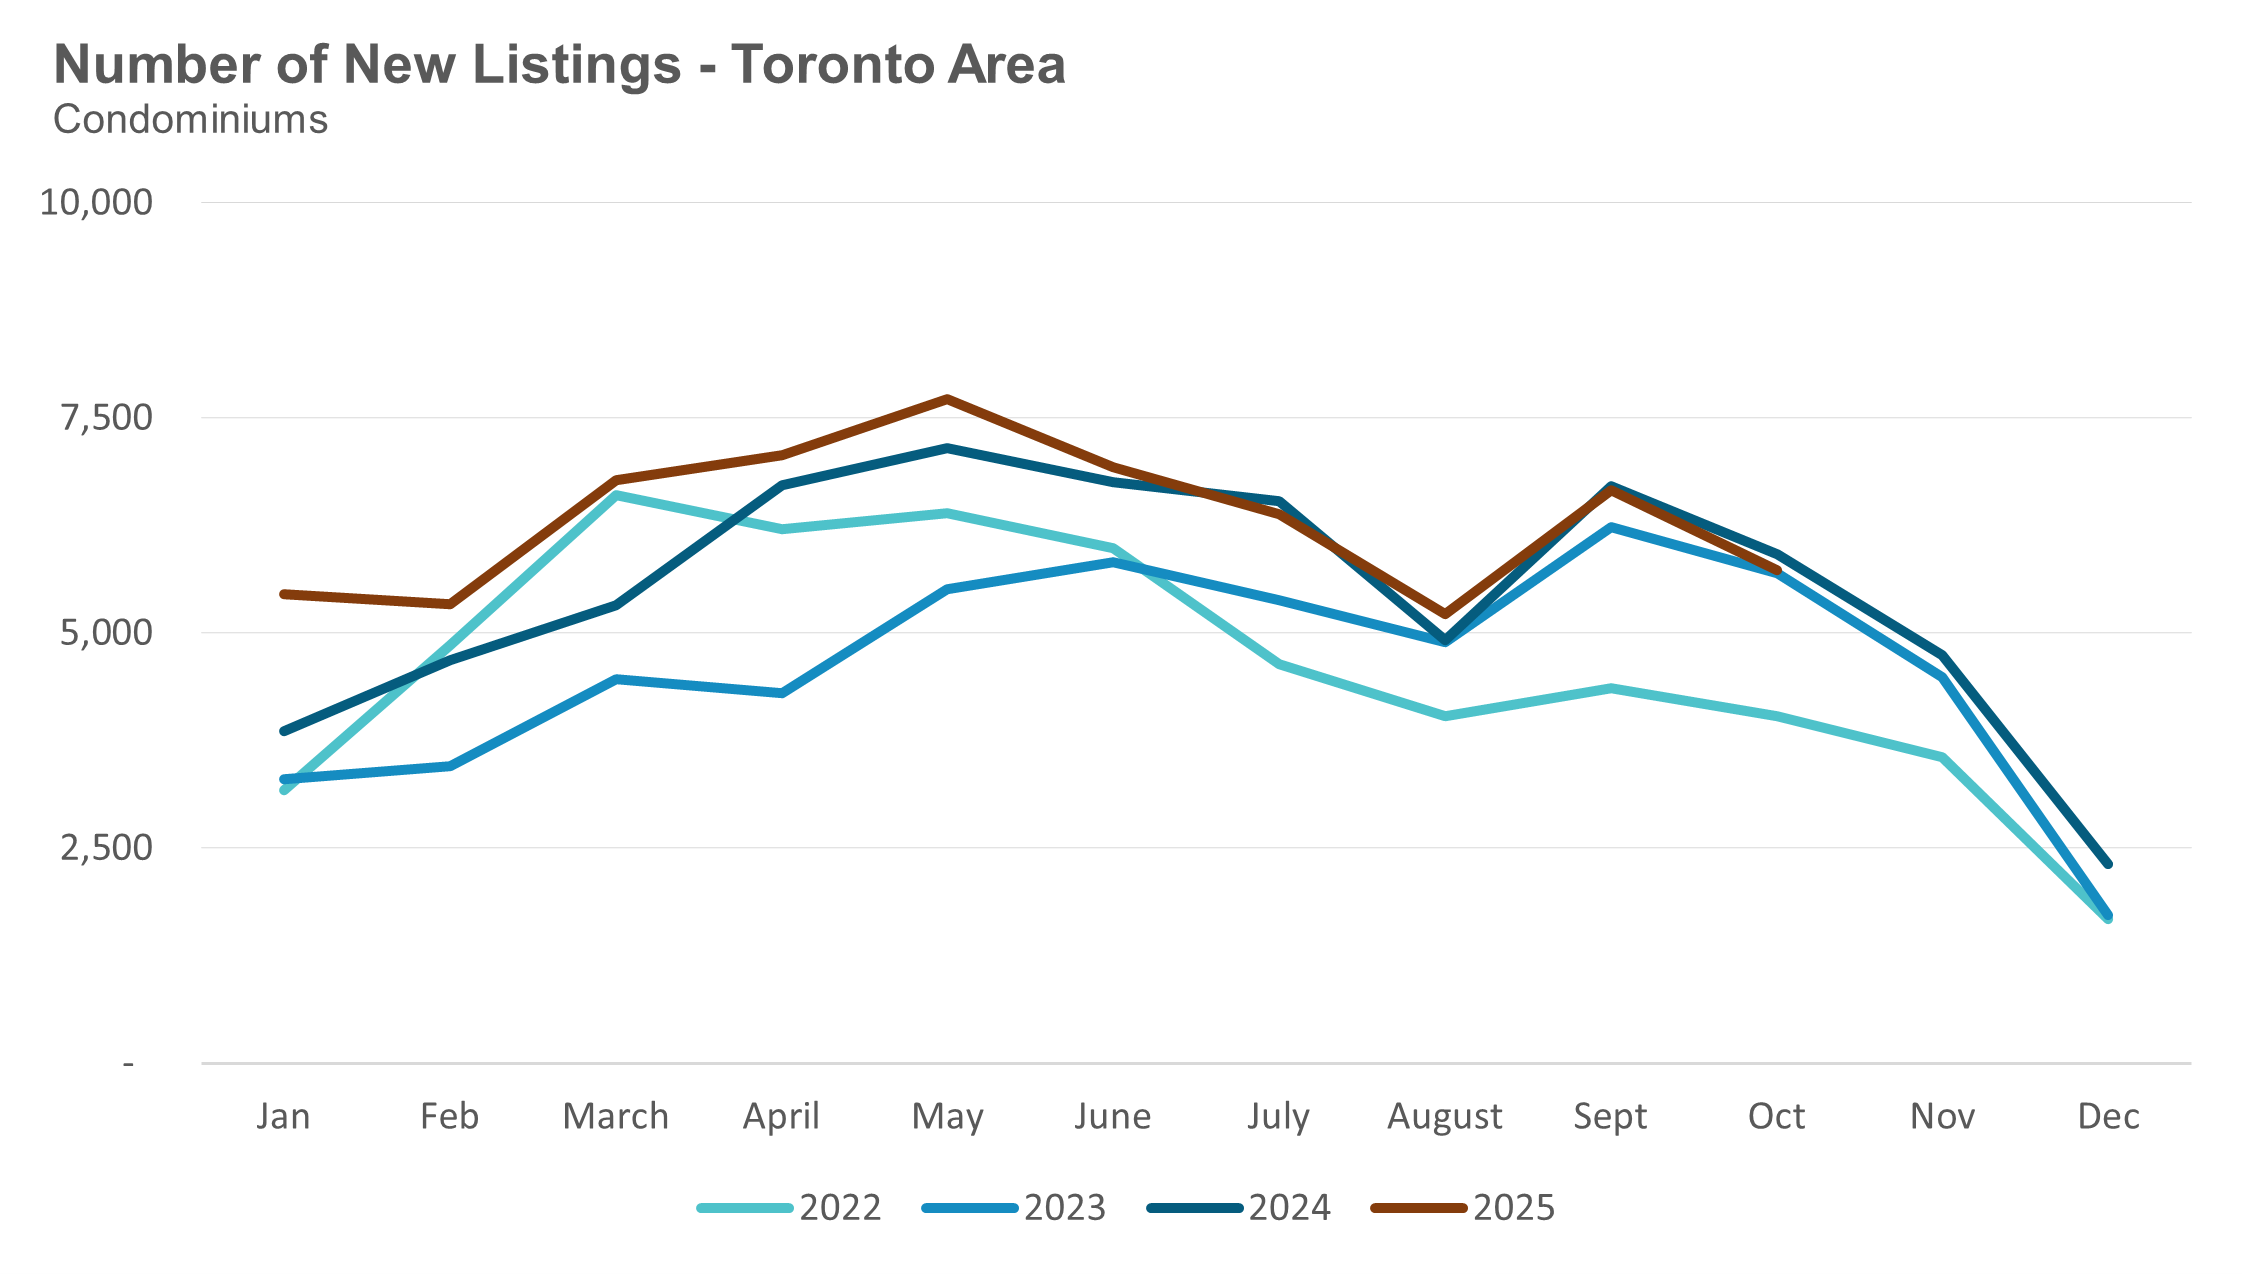
New condo listings were down 3% in October over last year.
The number of condos available for sale at the end of the month, or active listings, was up 10% over last year.
Condo months of inventory fell to 5.9 MOI in October.
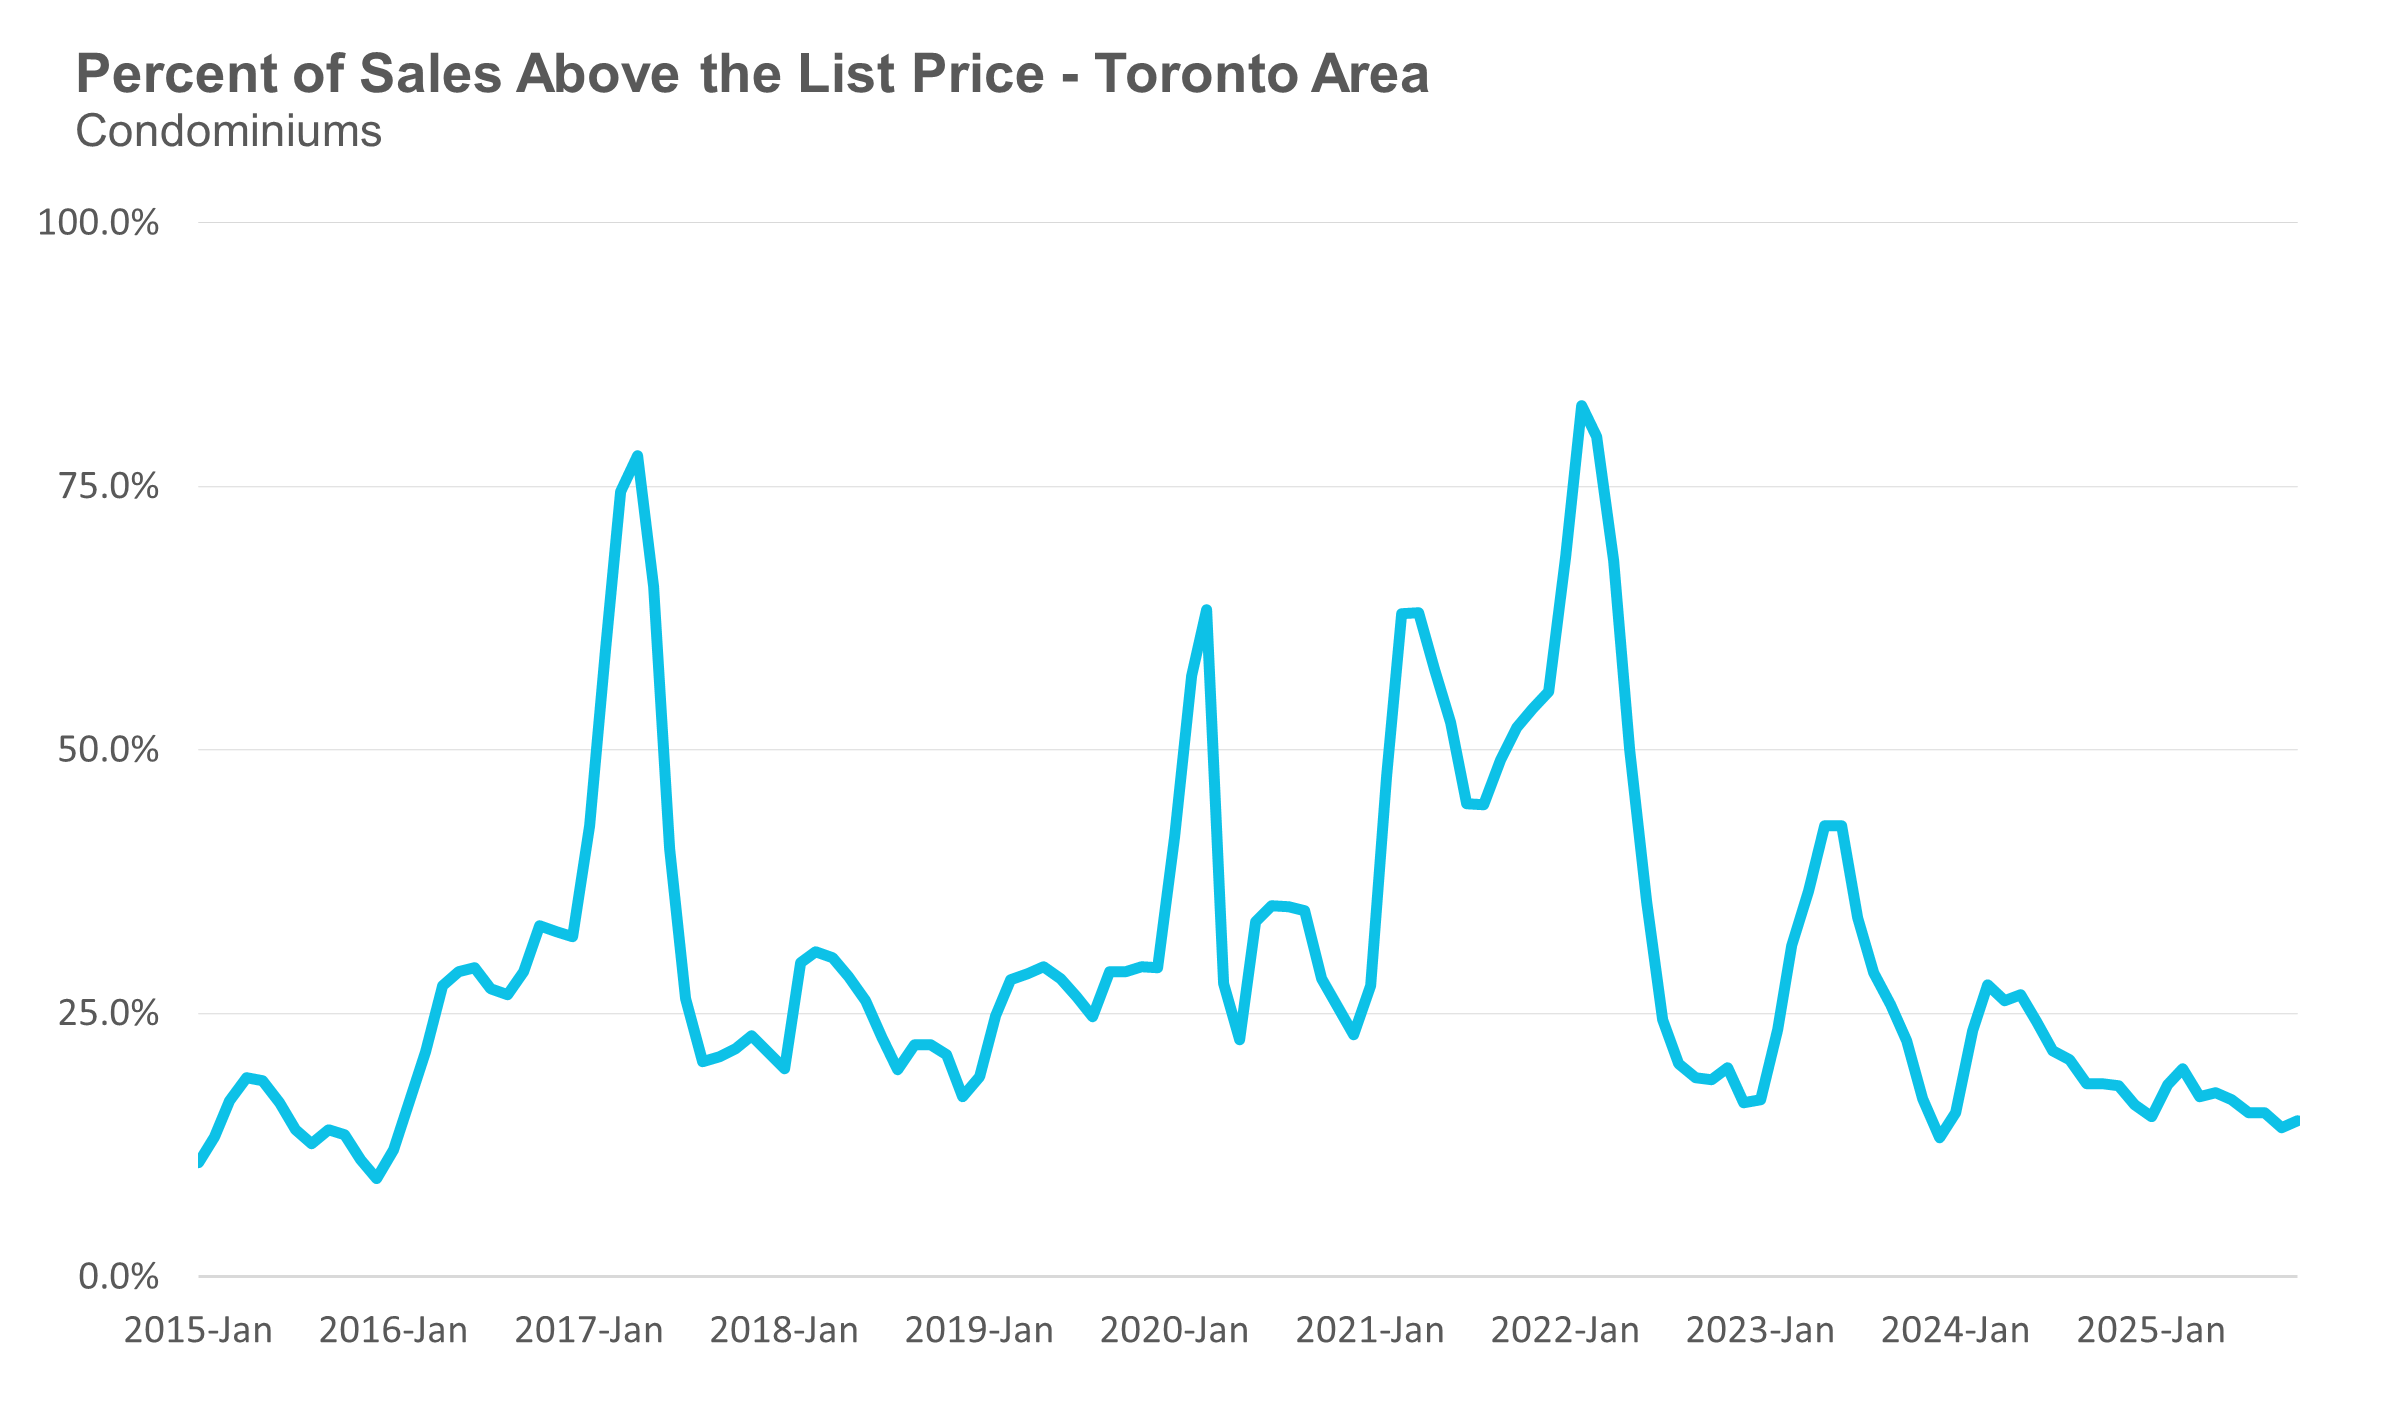
The share of condos selling for over the asking price increased to 15% in October.
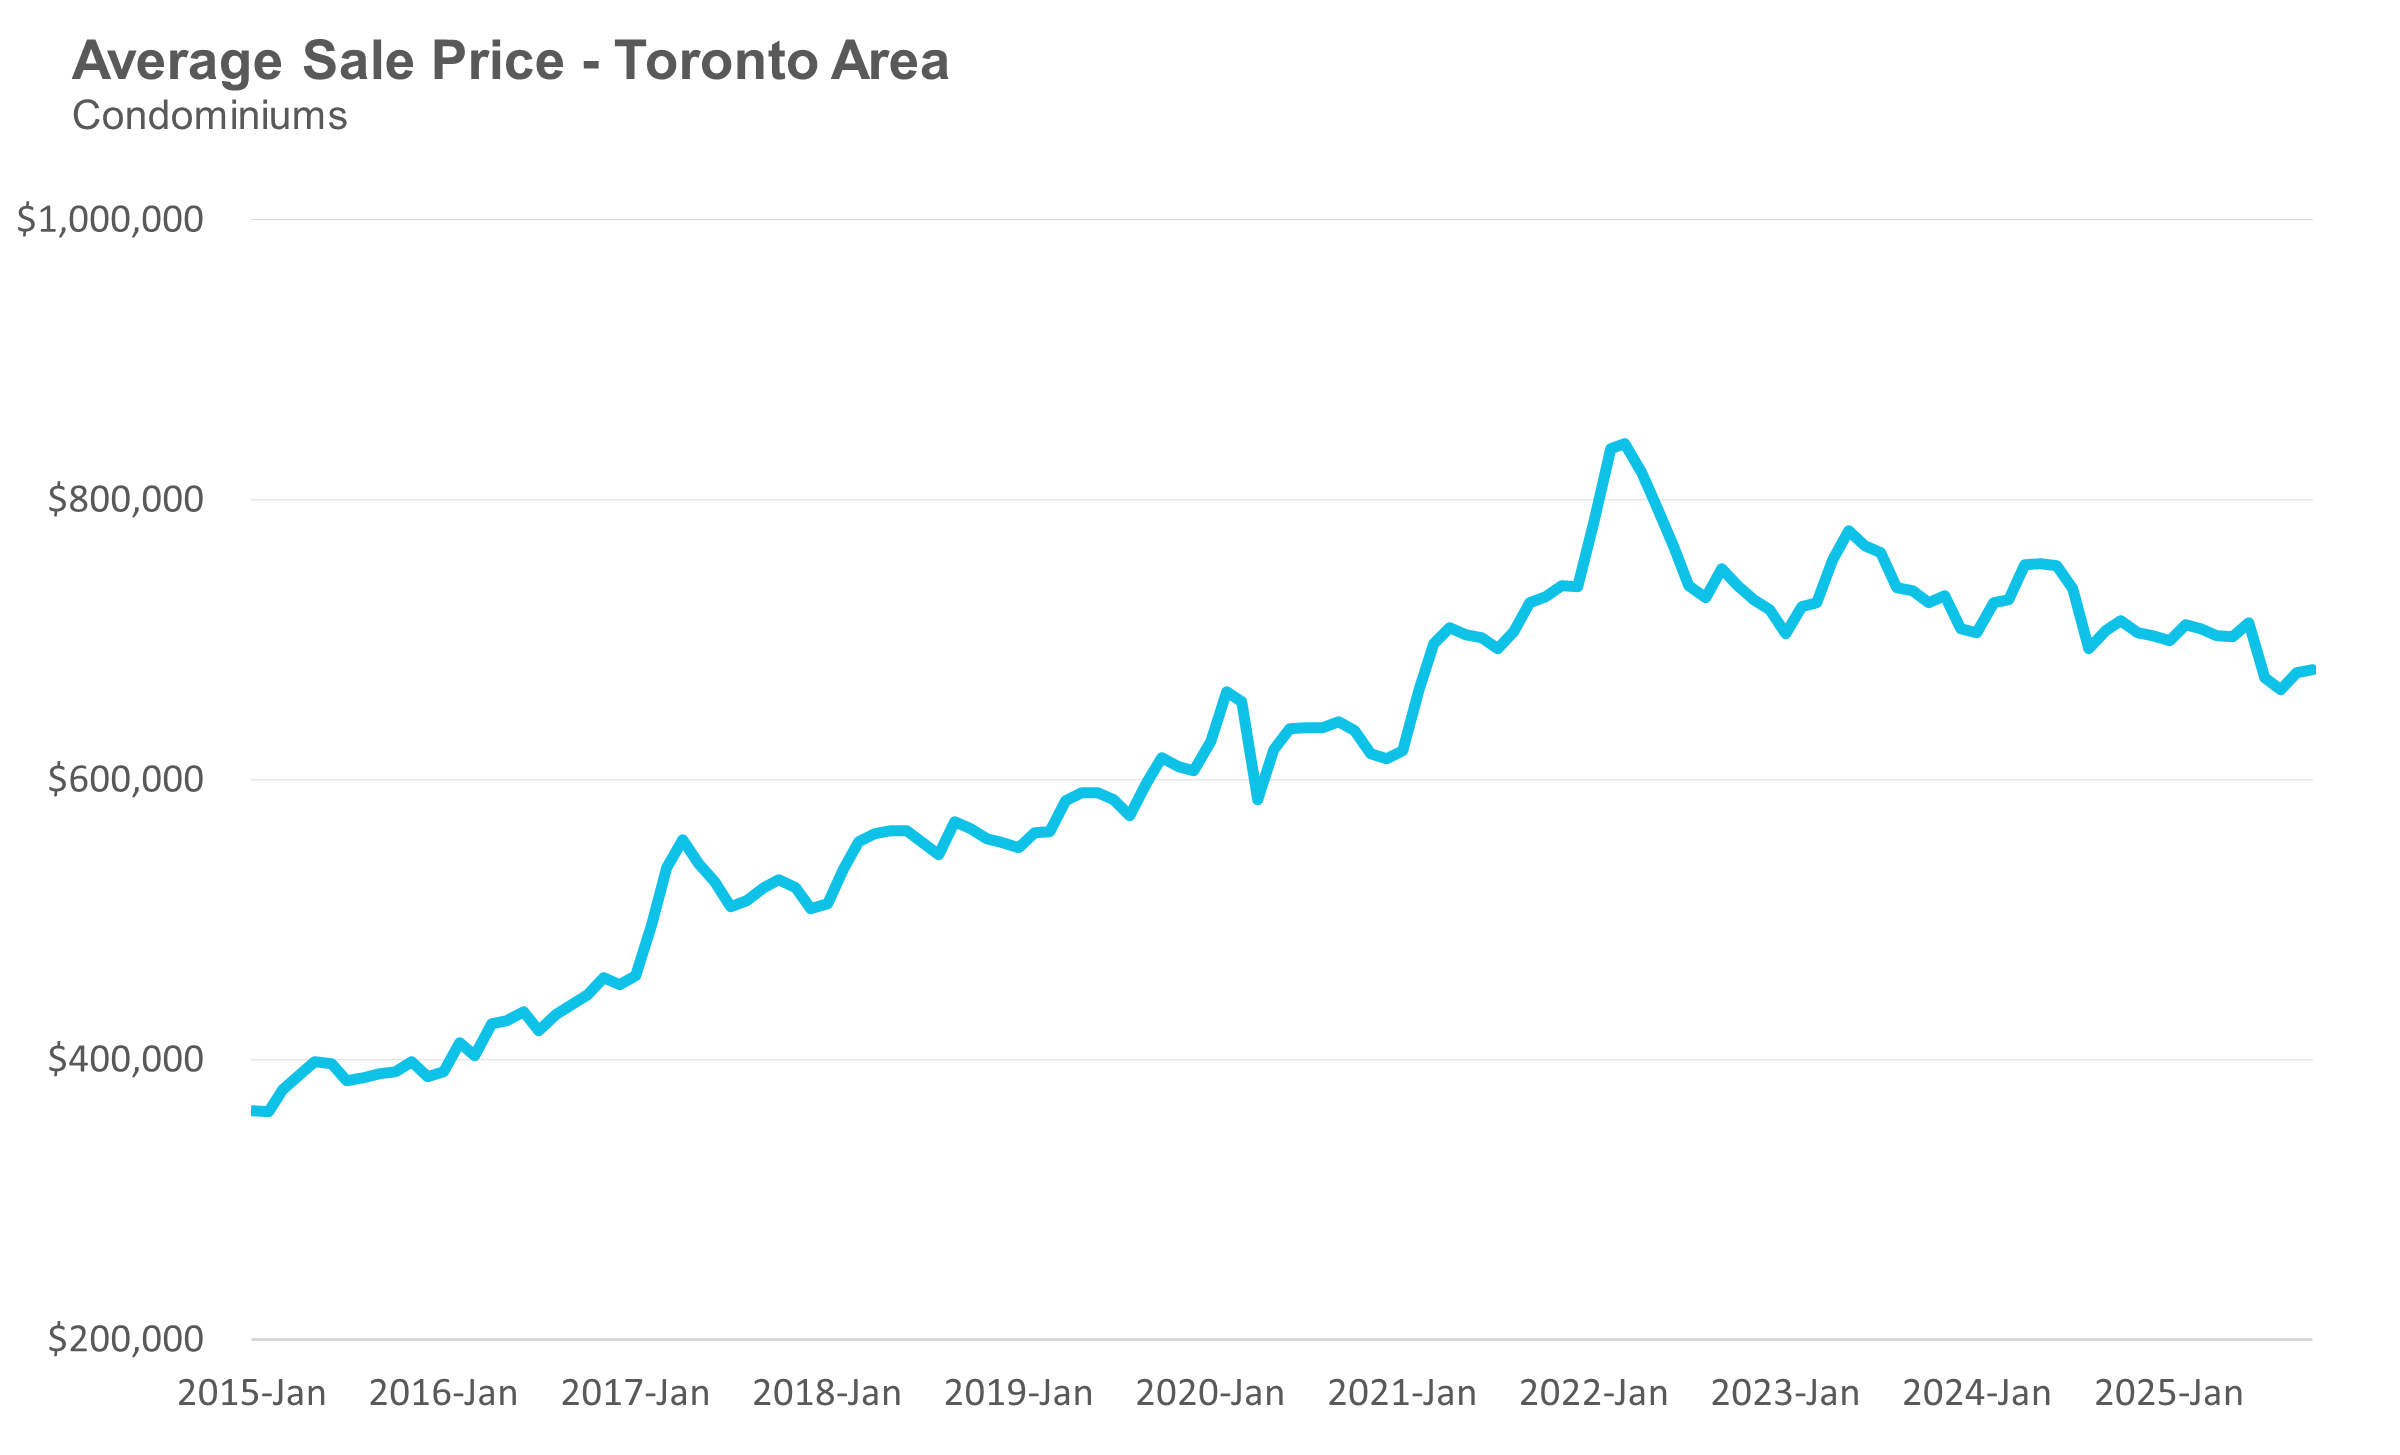
The average price of a condo in October was $678,633, down 5% from last year. The median price was $595,500, down 7% from last year.
Regional Trends
Houses
All five regions saw home sales decline in October compared to the same period last year, with Durham recording the largest decrease at 20%. Average house prices were down across all five regions, with Peel recording the sharpest decline of 12% over the past year.
Condos
Condo sales were down in four of the five regions with Halton showing a modest increase. Average prices were down across all five regions, with Halton recording the largest decline at 9%. The MOI is above last year’s level, indicating a cooler market for condos this year.
John Pasalis is President of Realosophy Realty. A specialist in real estate data analysis, John’s research focuses on unlocking micro trends in the Greater Toronto Area real estate market. His research has been utilized by the Bank of Canada, the Canadian Mortgage and Housing Corporation (CMHC) and the International Monetary Fund (IMF).
Have questions about your own moves in the Toronto area as a buyer, seller, investor or renter? Book a no-obligation consult with John and his team at a Realosophy here: https://www.movesmartly.com/meetjohn
Published: November 04, 2025


