The Greater Toronto Area saw a record low 2,942 home sales in April 2020.
Prior to last month, the lowest sales volume (5,386) on record for the month of April was in 1996, the oldest year for which monthly sales statistics are available from the Toronto Regional Real Estate Board.
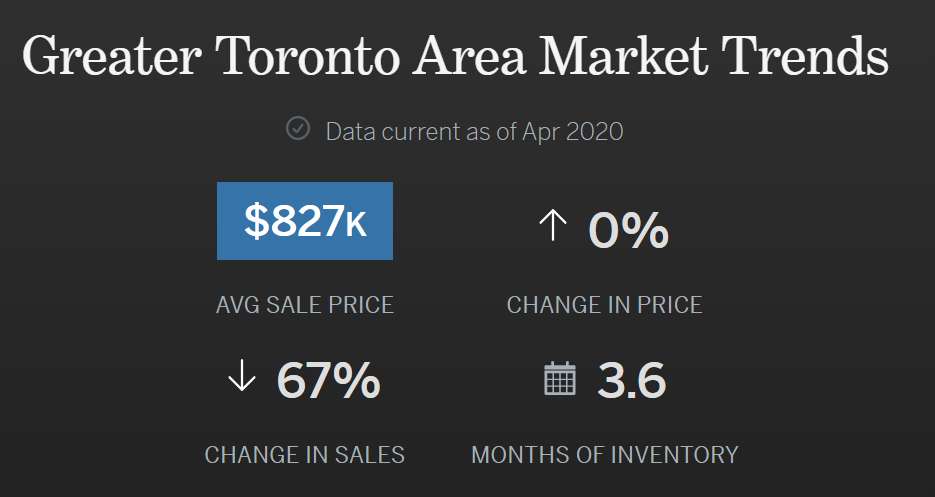
Here's a first-look breakdown of last month's Toronto area real estate market numbers via our website, Realosophy.com:
You can browse all the latest trends for the Toronto and GTA real estate market here. You can also see statistics for every neighbourhood and municipality by selecting the area you are interested in on our map below and clicking Market Trends button as shown in the image below.
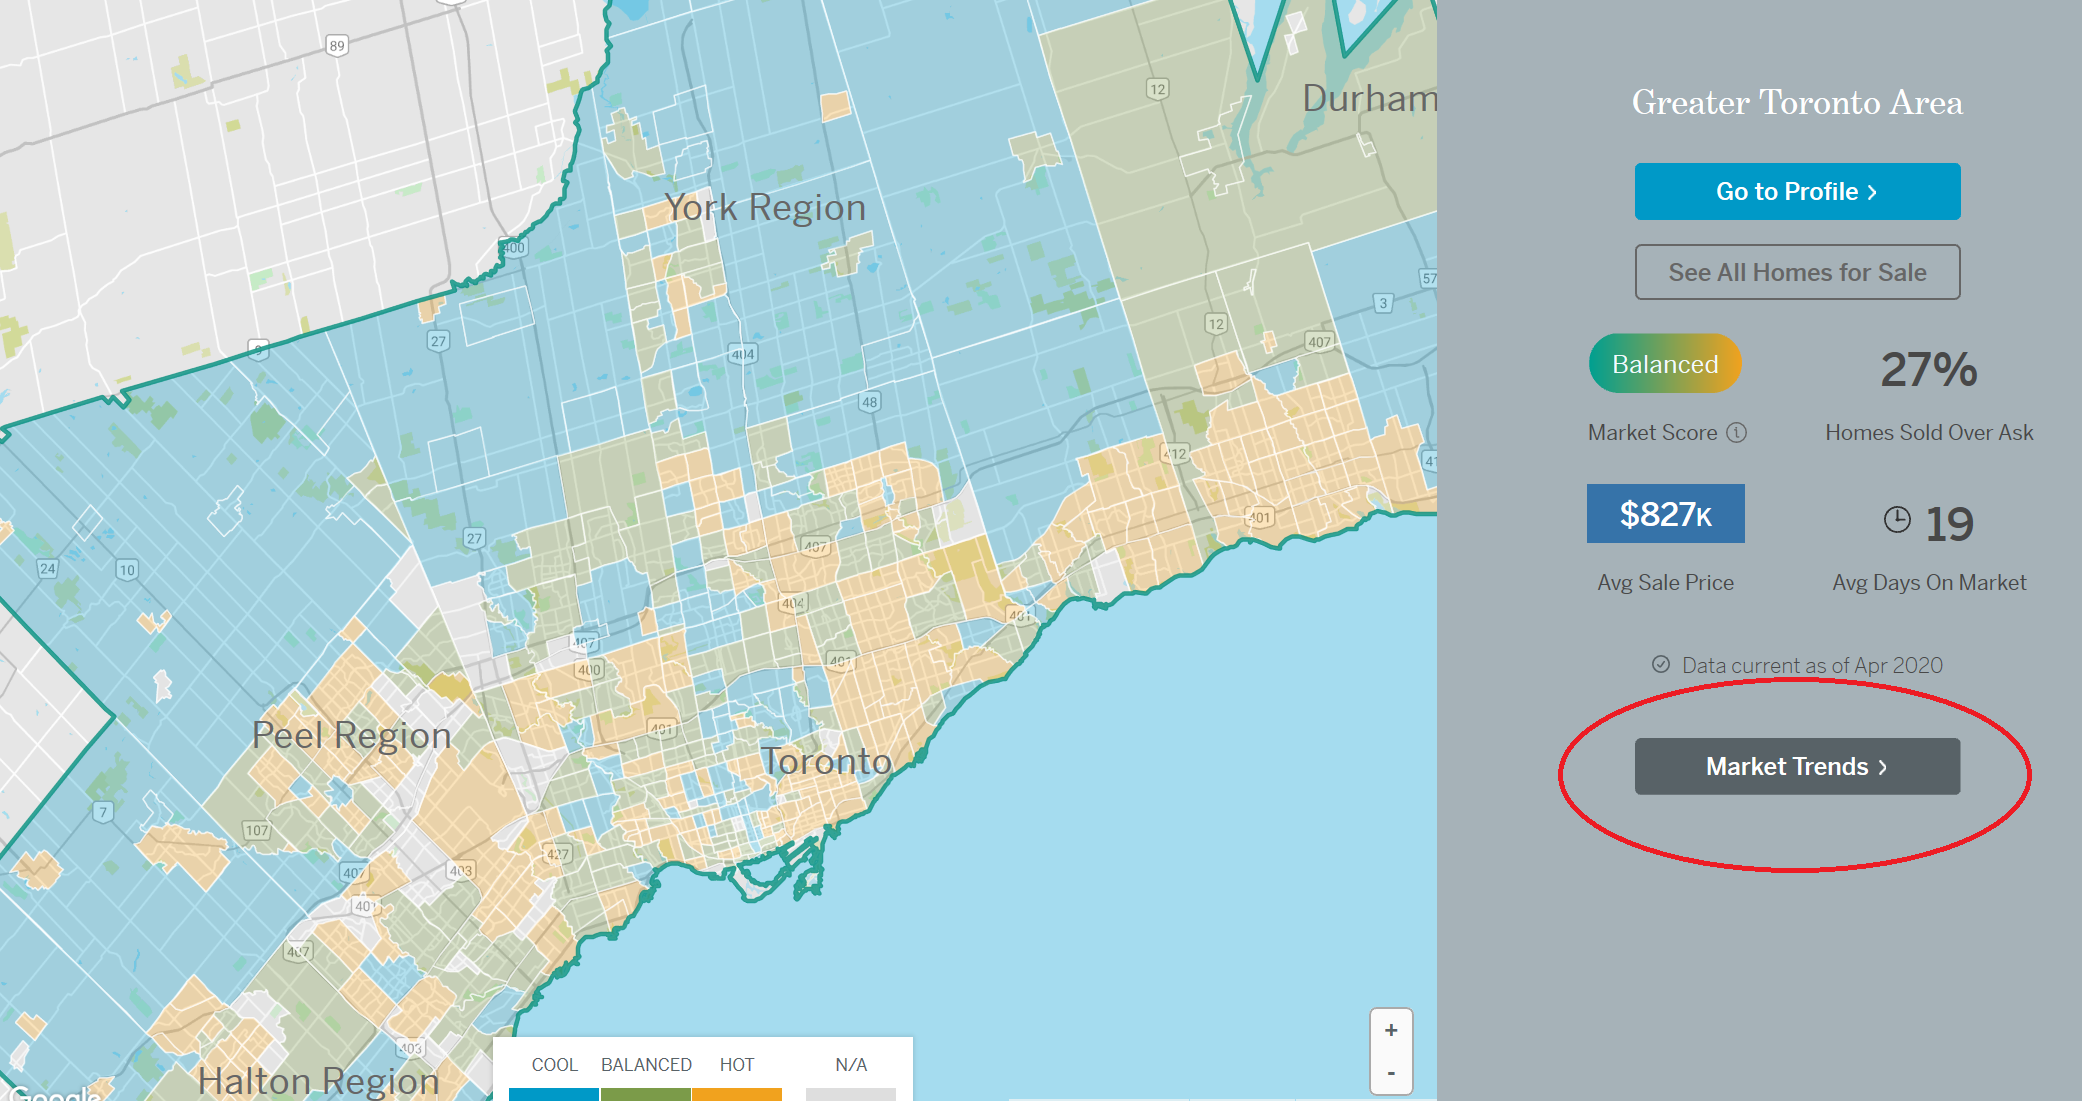
Source: Realosophy.com
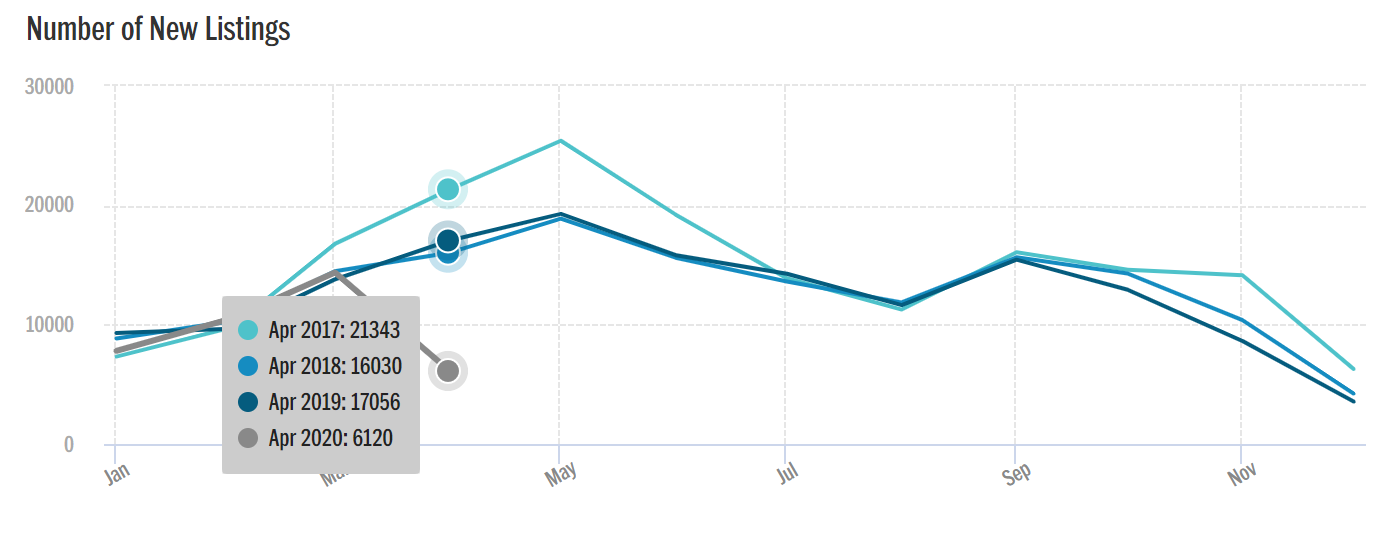
When compared to April of last year (2019), sales were down 67%, but with new listings falling at a similar rate as seen in the chart below, down 64% over last year (2019), prices have remained relatively stable over last year.
But when we compare average house prices within the current year, average prices are down from $914K reached in February 2020. Part of this decline is likely a softening in prices from the high levels reached in February, but it also is partly due to the fact that the homes selling today tend to be more affordable, with fewer luxury homes selling, which has pulled the average down.
But even with a sharp decline in new listings, the Months of Inventory (MOI) in the GTA has increased to 3.58 months as seen below.
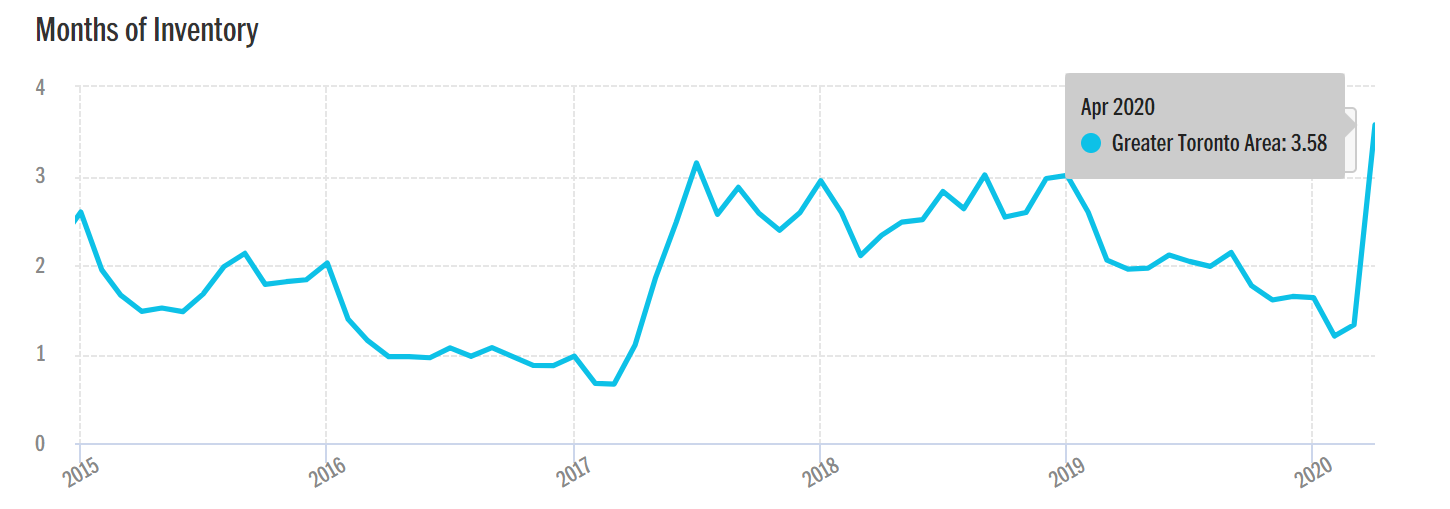
Realosophy.com
Now, the last time we reached this level of inventory in a spring market, the most active period in a yearly real estate cycle, was during the last financial crisis in early 2009.
As a reminder, the MOI compares the number of active listings on the market against the number of homes that sold over the past 30 days - which means it helps us understand the balance between supply and demand. A balanced market with little change in prices is typically when inventory levels are between 4-6 months; prices tend to rise when inventory levels are below 4 months and fall when above 6 months, but these of course are just rough rules of thumb.
How will the housing market perform this summer?
This is a difficult question to answer because it largely depends on when home buyers and sellers re-enter the market. Over the past few weeks, we have seen buyers gradually re-enter the market at a faster rate than sellers. If this trend continues, the market will become more competitive as we enter the summer months. But if sellers jump back into the market a lot faster than buyers then we’ll see inventory increase which will cool the Toronto area housing market even further.
In addition to this monthly review, I'm also reporting on market numbers weekly given the increased uncertainty in the housing market since the COVID-19 outbreak mid-March- you can follow these via YouTube, Facebook and Instagram. And if you are into stats, check out my Twitter.
Send me your questions or comments via any of the above channels or email me at askjohn@movesmartly.com
John Pasalis is President of Realosophy Realty, a Toronto real estate brokerage which uses data analysis to advise residential real estate buyers, sellers and investors.
A specialist in real estate data analysis, John’s research focuses on unlocking micro trends in the Greater Toronto Area real estate market. His research has been utilized by the Bank of Canada, the Canadian Mortgage and Housing Corporation (CMHC) and the International Monetary Fund (IMF).
Follow John on Twitter @johnpasalis
Published: May 04, 2020