At the end of May, the Toronto area had 9,951 condominiums available for sale, the highest number of units for sale for any month in recent history.
The chart below shows the number of active condominium listings for the month of May.

What’s behind the record number of condominium listings?
Investors are rushing for the exits. Higher interest rates are driving up mortgage payments, making condominium investing far more expensive. Rents are not high enough to cover the average investor’s mortgage, taxes, and maintenance fees.
Beyond high interest rates, declining rents and record condo completions scheduled in the year ahead combined with our federal government’s plan to reduce the number of non-permanent residents in Canada have left investors less optimistic about the future price growth for Toronto condos.
The Toronto area saw a 30% increase in new listings of condominiums in May but only an 18% increase in owner-occupied condos and a 56% increase in the number of vacant condominiums listed for sale. Investors typically list their condominiums for sale when they are vacant.

While condo prices are down slightly over last year, this decline has more to do with the slight surge in prices the Toronto market saw last year. Since the start of the year, Toronto condo prices have been trending up and have plateaued over the past two months.
The City of Toronto saw the highest Months of Inventory in May with Halton seeing the lowest level.

Over the next six months, it will be critical to keep an eye on the change in condominium inventory levels and how market prices respond. Time will tell if condo prices remain sticky or if we begin to seem some downward pressure on condo prices.
.png?width=600&height=300&name=Live%20Market%20Update%20-%20True%20Size%20HS%20600-300%20(1).png)
WATCH LIVE: The Market Now with John Pasalis - Thurs June 13th 2024 12PM ET
Join John Pasalis, report author, for key highlights of this month's report and responses to your questions. Sign Up Now >
By the Numbers: May 2024
The average price for a house in the Toronto area was $1,414,237 in May, down 4%over the same month last year. Last month's median house price was $1,230,000, down 5% over last year.
House sales in May were down 22% over last year, while new house listings were up 14%.
The number of houses available for sale at the end of the month, or active listings, was up 66% over last year.
The current balance between supply and demand is reflected in the MOI, which is a measure of inventory relative to the number of sales each month.
In May, the MOI for houses increased slightly to 2.7.
The average price for a condo in the Toronto Area was $754,526 in May, which down 3% over last year. The median price for a condo in May was $673,000, down 4% over last year.
Condo sales in May were down 26% over last year, and new condo listings were up 30% over last year. The number of active condo listings was up 89% over last year and reached a record 9,951 for any month. The MOI increased to 4.
Browse detailed monthly statistics for May 2024 for the entire Toronto area market, including house, condo and regional breakdowns below.
Monthly Statistics
House Statistics
House sales (low-rise freehold detached, semi-detached, townhouse, etc.) in the Greater Toronto Area (GTA) in May 2024 were down 22% compared to the same month last year.

New house listings in May were up 14% compared to last year.

The number of houses available for sale (“active listings”) was up 66% in May compared to the same month last year.

The Months of Inventory ratio (MOI) looks at the number of homes available for sale in a given month divided by the number of homes sold in that month. It answers the following question: If no more homes came on the market for sale, how long would it take for all the existing homes on the market to sell, given the current level of demand? The higher the MOI, the cooler the market is. A balanced market (a market where prices are neither rising nor falling) is one where MOI is between four to six months. The lower the MOI, the more rapidly we would expect prices to rise.
While the current level of MOI gives us clues into how competitive the market is on-the-ground today, the direction it is moving in also gives us some clues into where the market may be heading.
The MOI for houses increased slightly to 2.7 in May.

The share of houses selling for more than the owner’s list price decreased to 48% in May.

The average price for a house in May was $1,414,237 in May 2024, down 4% compared to the same month last year.

The median house price in May was $1,230,000, down 5% over last year.
The median is calculated by ordering all the sale prices in a given month and then selecting the price at the midpoint of that list such that half of all home sales are above that price and half are below that price. Economists often prefer the median price over the average because it is less sensitive to big increases in the sale of high-end or low-end homes in a given month, which can skew the average price.
Condo Statistics
Condo (condominiums, including condo apartments, condo townhouses, etc.) sales in the Toronto area in May 2024 were down 26% compared to the same month last year.

New condo listings were up 30% in May over last year.

The number of condos available for sale at the end of the month, or active listings, was up 89% over last year.

Condo months of inventory increased to 4 MOI in May.

The share of condos selling for over the asking price increased slightly to 27% in May.

The average price of a condo in May was $754,526, down 3% from last year. The median price was $673,000, down 4% from last year.

Regional Trends
Houses
All five regions saw sales decline by double digits over last year. Halton saw average prices remain unchanged, while all other regions saw average prices decline over last year. All five regions saw significant increases in new listings in May, while the MOI was well above last year.

Condos
Condo sales were down by over 20% in all regions in May. Average prices were also down across the GTA. New listings and MOI were well above last year’s level for all regions.

Browse Real-Time Market Trends on Movesmartly.com:
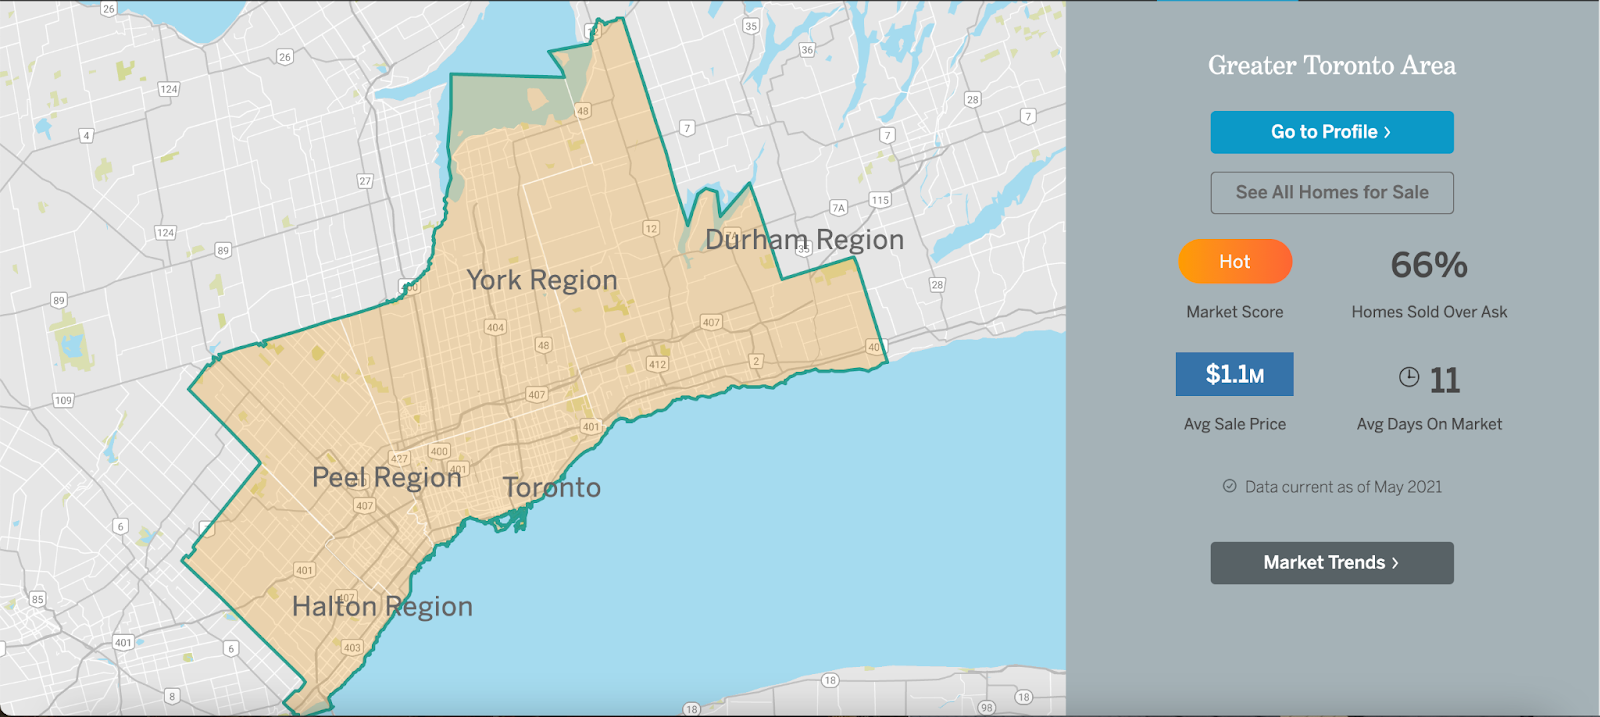
See Market Performance by Neighbourhood Map, All Toronto and the GTA
Greater Toronto Area Market Trends
John Pasalis is President of Realosophy Realty. A specialist in real estate data analysis, John’s research focuses on unlocking micro trends in the Greater Toronto Area real estate market. His research has been utilized by the Bank of Canada, the Canadian Mortgage and Housing Corporation (CMHC) and the International Monetary Fund (IMF).
Have questions about your own moves in the Toronto area as a buyer, seller, investor or renter? Book a no-obligation consult with John and his team at a Realosophy here: https://www.movesmartly.com/meetjohn
Published: June 04, 2024