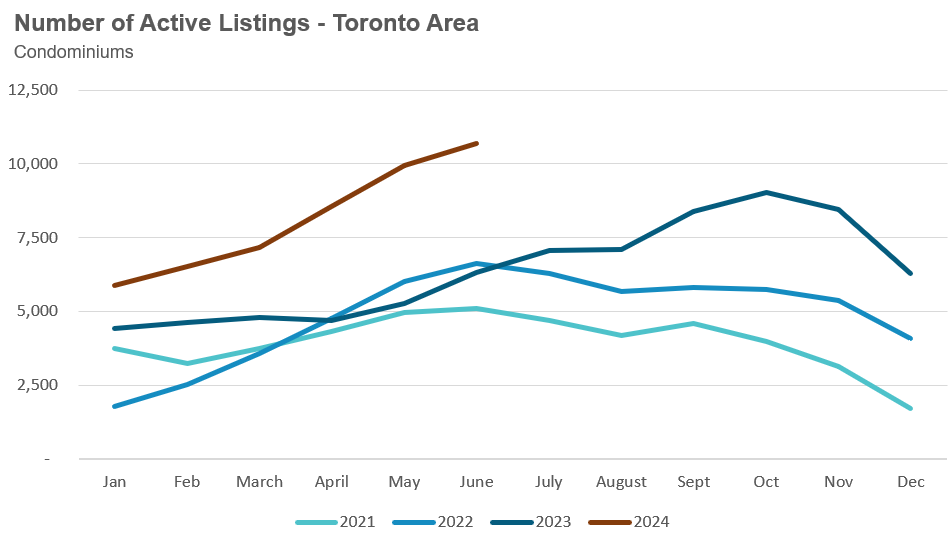
The number of condos available for sale in the Toronto area has reached another new record high — so will this surge ease our housing shortage?
The Toronto area condo market continues to cool, with the number of condos available for sale reaching a new record high, surpassing last month’s record — so will this surge ease the housing shortage in the Toronto area?
One way to help answer this question is to look at the year-over-year change in the number of new listings during the second-quarter by condo size. One common argument circulating in the media is that Toronto is seeing a spike in the number of small condos listed for sale, and the data largely supports that narrative.
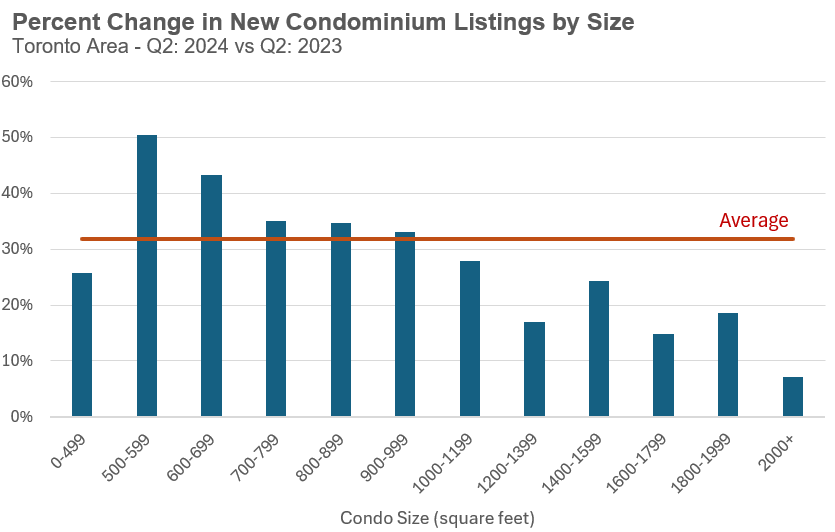
Units in the 500-599 square foot range saw the sharpest increase in new listings, up 50% over last year. The growth in new listings generally declines as the unit size increases, indicating that proportionally fewer owners of large units are listing their condos for sale.
The one exception to the above trend is very small units under 500 sq ft, which saw a smaller 26% increase in new listings over the last year, below the overall average increase of 32%. I suspect that more of these smaller units didn’t hit the market because many of those units are in newer buildings that were likely instead rented out by their owners at completion.
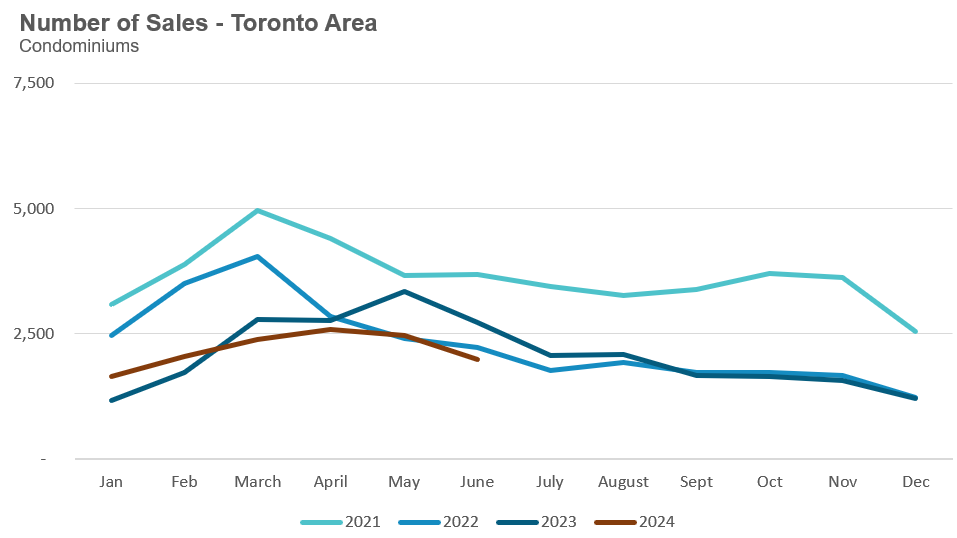
However, when we consider the demand for condo units by measuring the change in the number of sales during the second quarter, we see that units under 500 sq ft in size saw the biggest decline in sales. This is largely driven by the fact that the most common buyer of these units are investors and demand from investors has largely dried up because of high interest rates.
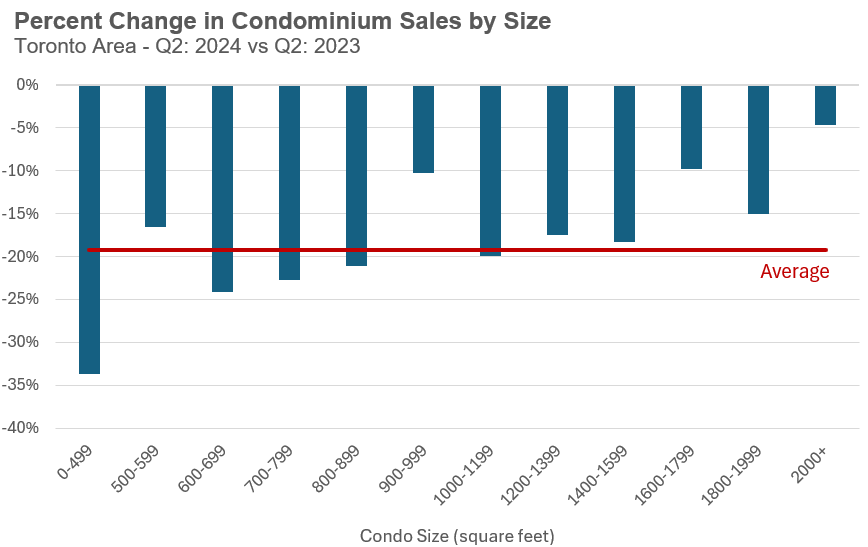
While the sales data is more volatile, the overall trend is that larger units are seeing a more moderate decline in sales compared to smaller units.
Despite the surge in the number of condos listed for sale, average prices have been relatively stable. However, the future is uncertain. If the number of active listings continues to accelerate, we may see some downward pressure on prices in the months ahead. Conversely, if inventory levels decline during the fall market, prices may continue to remain stable. This uncertainty underscores the potential risks in the market.
.png?width=600&height=300&name=Live%20Market%20Update%20-%20True%20Size%20HS%20600-300%20(1).png)
WATCH LIVE: The Market Now with John Pasalis - Thurs July 11th 2024 12PM ET
Join John Pasalis, report author, for key highlights of this month's report and responses to your questions. Sign Up Now >
By the Numbers: June 2024
The average price for a house in the Toronto area was $1,382,118 in June, down 5% over the same month last year. Last month's median house price was $1,200,000, down 6% over last year.
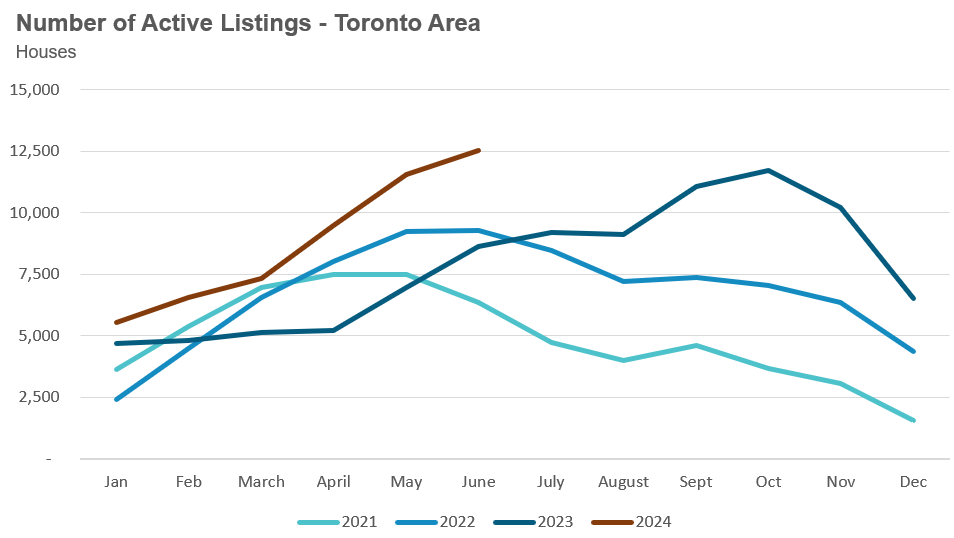
House sales in June were down 13% over last year, while new house listings were up 8%. The number of houses available for sale at the end of the month, or active listings, was up 45% over last year.
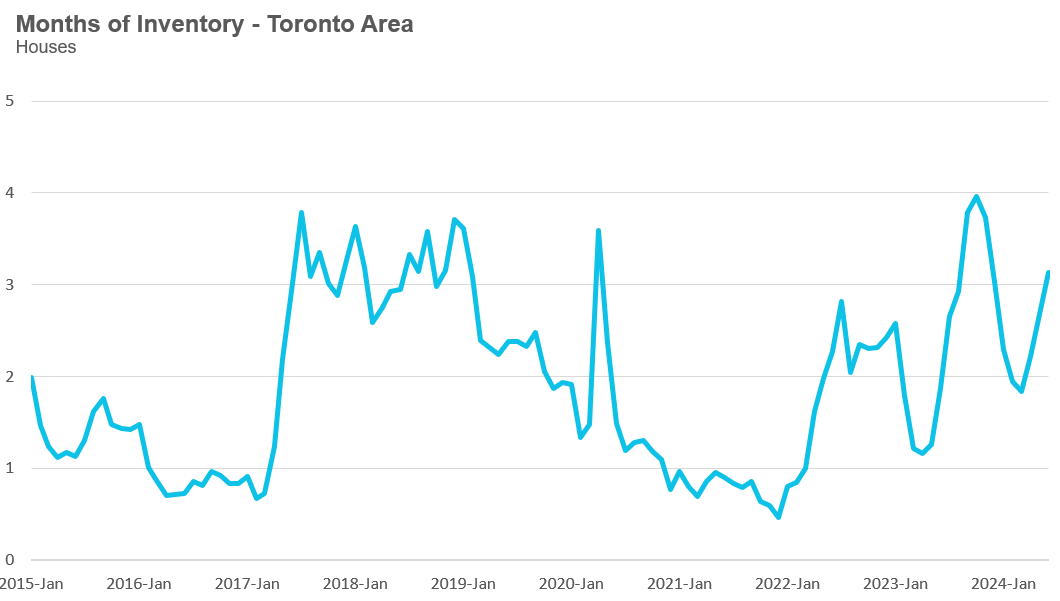
The current balance between supply and demand is reflected in the MOI, which is a measure of inventory relative to the number of sales each month. In June, the MOI for houses increased slightly to 3.1.
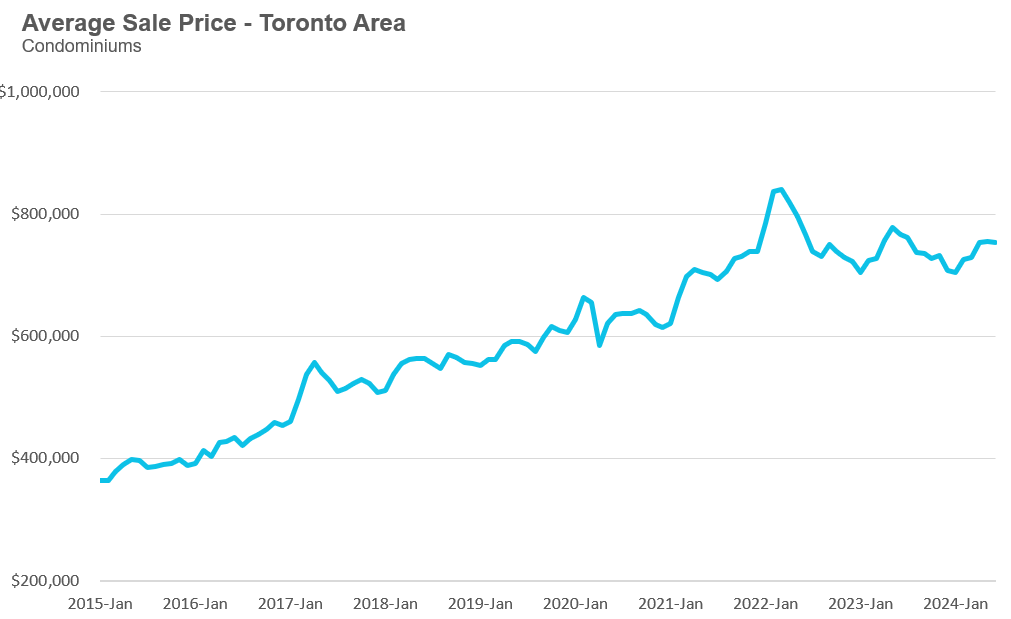
The average price for a condo in the Toronto Area was $753,111 in June, down 2% over last year. The median price for a condo in June was $670,000, down 3% over last year.
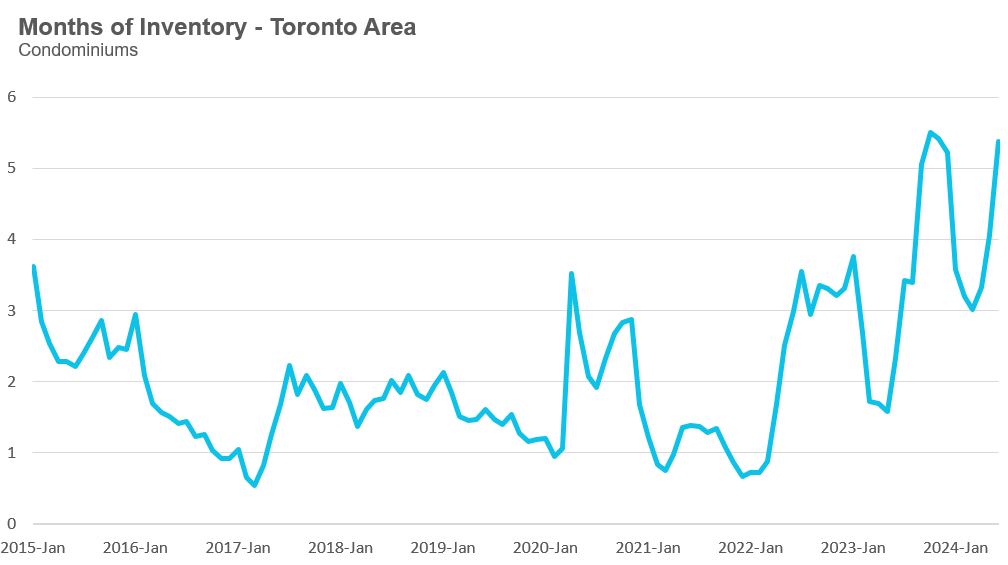
Condo sales in June were down 27% over last year, and new condo listings were up 16% over last year. The number of active condo listings was up 70% over last year and reached a new record of 10,688 for any month. The MOI increased to 5.3.
Browse detailed monthly statistics for June 2024 for the entire Toronto area market, including house, condo and regional breakdowns below.
Monthly Statistics
House Statistics
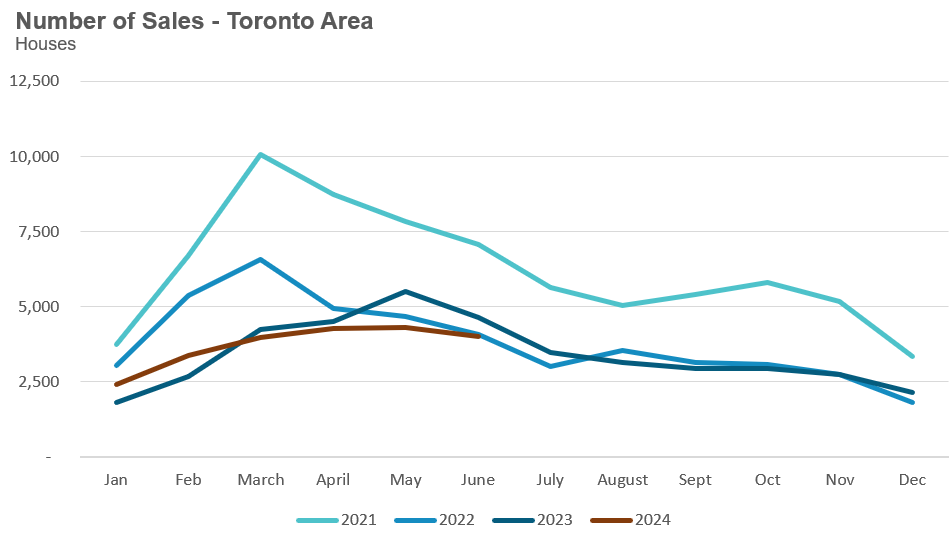
House sales (low-rise freehold detached, semi-detached, townhouse, etc.) in the Greater Toronto Area (GTA) in June 2024 were down 13% compared to the same month last year.
New house listings in June were up 8% compared to last year.
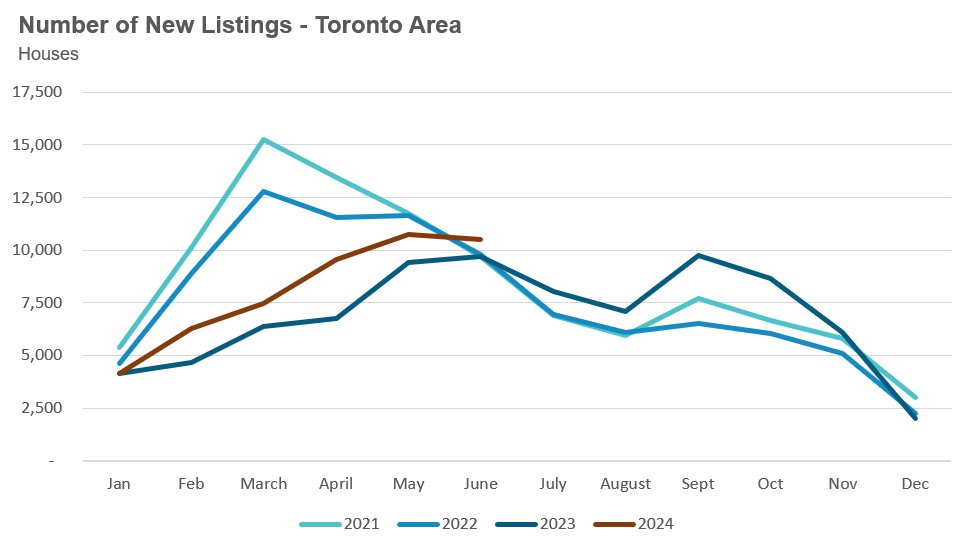
The number of houses available for sale (“active listings”) was up 45% in June compared to the same month last year.
The Months of Inventory ratio (MOI) looks at the number of homes available for sale in a given month divided by the number of homes sold in that month. It answers the following question: If no more homes came on the market for sale, how long would it take for all the existing homes on the market to sell, given the current level of demand? The higher the MOI, the cooler the market is. A balanced market (a market where prices are neither rising nor falling) is one where MOI is between four to six months. The lower the MOI, the more rapidly we would expect prices to rise.
While the current level of MOI gives us clues into how competitive the market is on-the-ground today, the direction it is moving in also gives us some clues into where the market June be heading.
The MOI for houses increased to 3.1 in June.
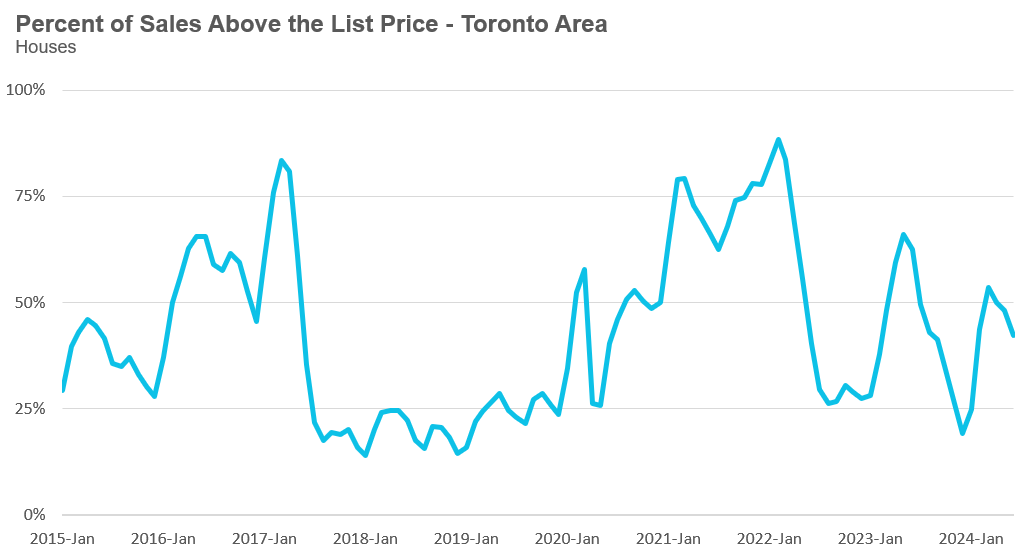
The share of houses selling for more than the owner’s list price decreased to 42% in June.
The average price for a house in June was $1,382,118 in June 2024, down 5% compared to the same month last year.
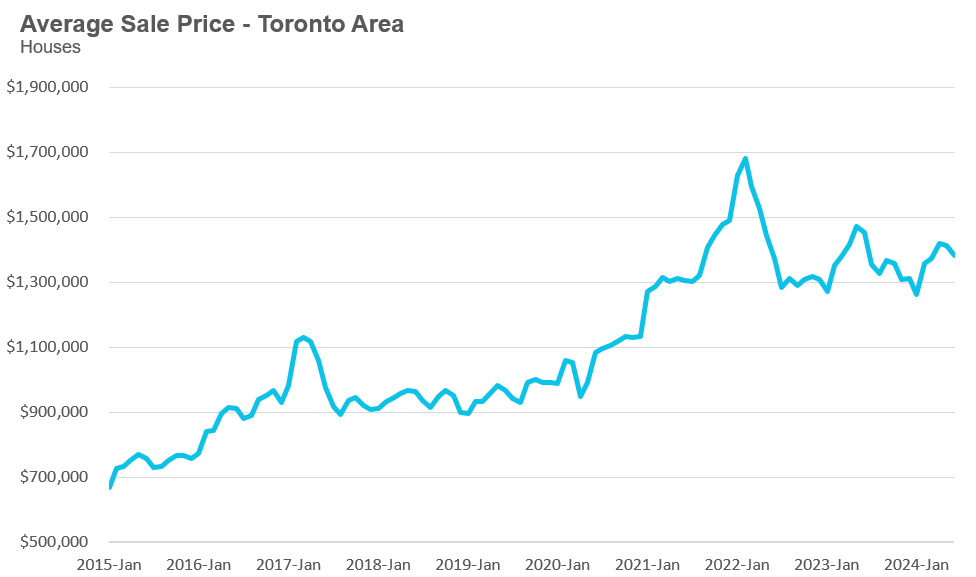
The median house price in June was $1,200,000, down 6% over last year.
The median is calculated by ordering all the sale prices in a given month and then selecting the price at the midpoint of that list such that half of all home sales are above that price and half are below that price. Economists often prefer the median price over the average because it is less sensitive to big increases in the sale of high-end or low-end homes in a given month, which can skew the average price.
Condo Statistics
Condo (condominiums, including condo apartments, condo townhouses, etc.) sales in the Toronto area in June 2024 were down 27% compared to the same month last year.
New condo listings were up 16% in June over last year.

The number of condos available for sale at the end of the month, or active listings, was up 70% over last year.
Condo months of inventory increased to 5.4 MOI in June.
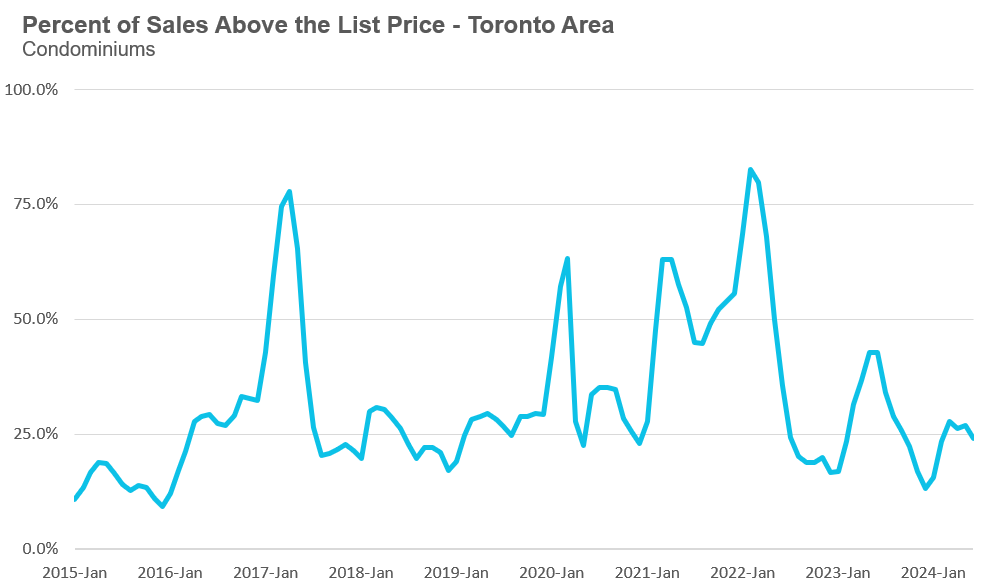
The share of condos selling for over the asking price increased slightly to 24% in June.
The average price of a condo in June was $753,111, down 2% from last year. The median price was $670,000, down 3% from last year.
Regional Trends
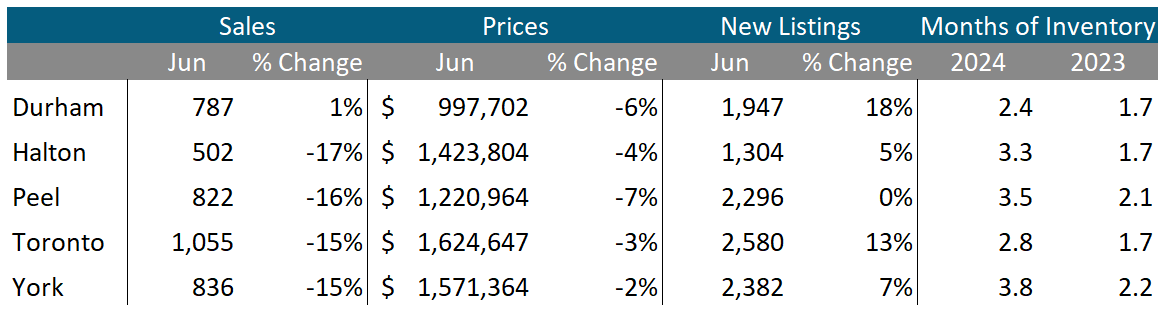
Houses
Sales were up by 1% in Durham, the GTA’s most affordable region, but down by double digits in the other five regions. Durham also saw the sharpest increase in new listings, up 18% over last year, followed by Toronto at 13%. Average prices were down in all five regions. Months of inventory was up across all regions, with York (3.8) and Peell (3.5) seeing the highest MOI of houses in the Greater Toronto Area.
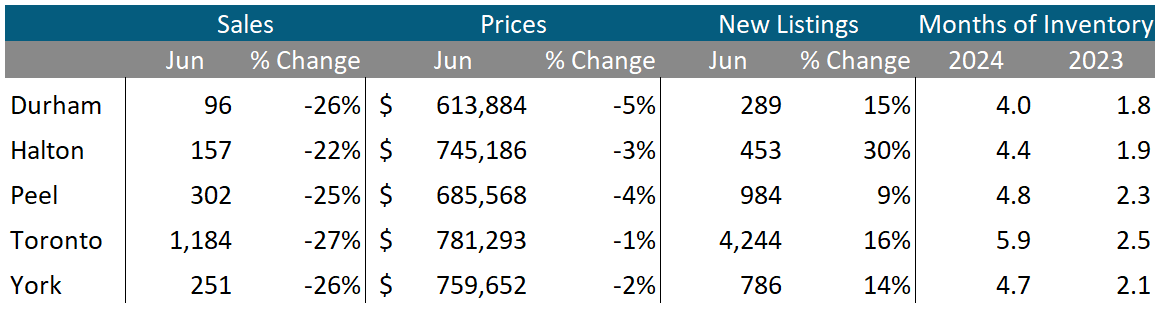
Condos
Condo sales were down by over 20% in all regions in June. Average prices were also down across the GTA. New listings and MOI were well above last year’s level for all regions. The City of Toronto has the highest MOI across all five regions.
Browse Real-Time Market Trends on MoveSmartly.com:
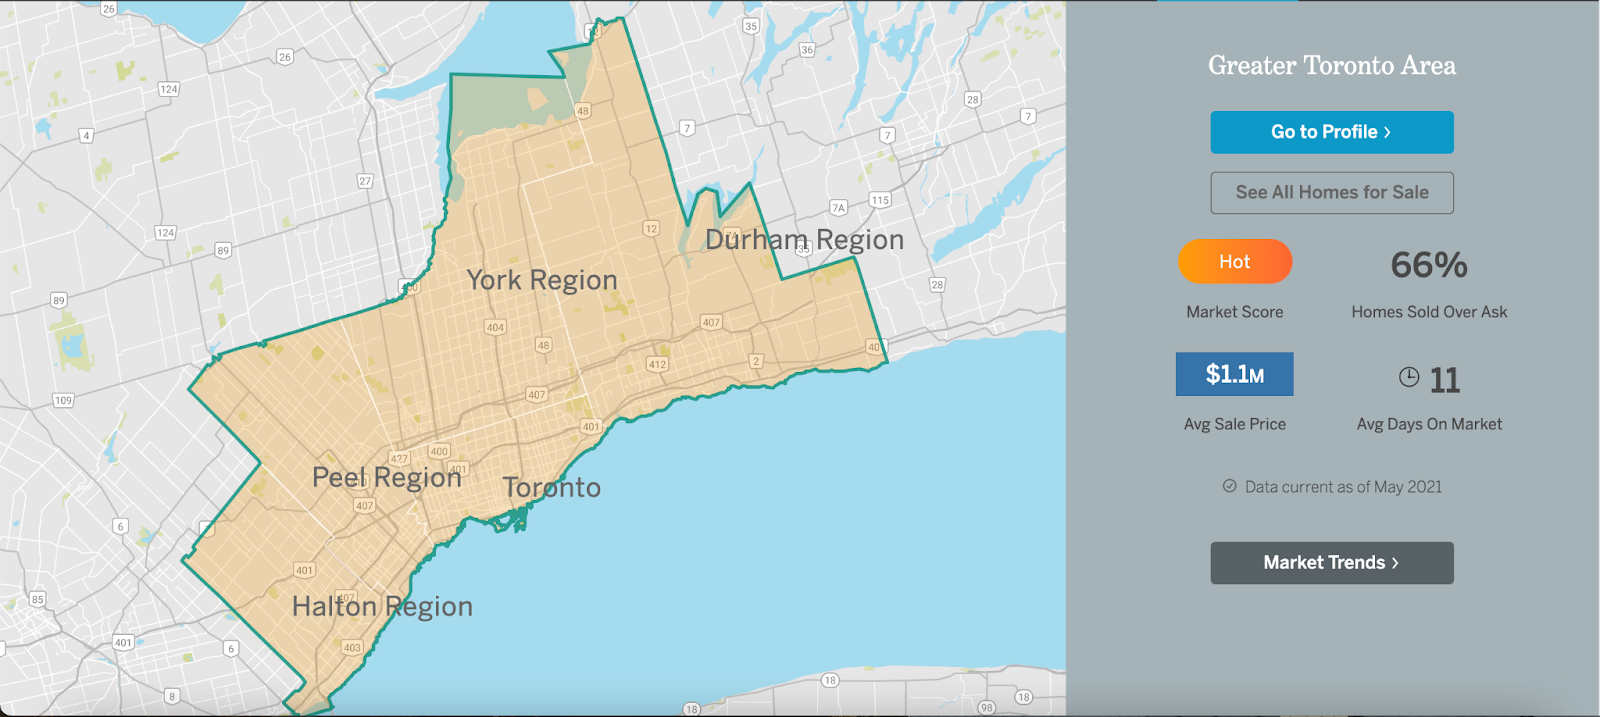
See Market Performance by Neighbourhood Map, All Toronto and the GTA
Greater Toronto Area Market Trends
John Pasalis is President of Realosophy Realty. A specialist in real estate data analysis, John’s research focuses on unlocking micro trends in the Greater Toronto Area real estate market. His research has been utilized by the Bank of Canada, the Canadian Mortgage and Housing Corporation (CMHC) and the International Monetary Fund (IMF).
Have questions about your own moves in the Toronto area as a buyer, seller, investor or renter? Book a no-obligation consult with John and his team at a Realosophy here: https://www.movesmartly.com/meetjohn
Published: July 09, 2024