
Toronto's housing market in November 2024 painted a complex picture, balancing robust sales activity against lingering sluggishness due to high inventory levels. Here's a closer look at the key trends:
Strong Sales Growth but Persistent Sluggishness
House and condo sales surged year-over-year, reflecting increased buyer activity spurred by lower borrowing costs. However, the relatively high number of active listings continued to dampen market momentum. This glut of inventory is keeping market conditions less competitive despite a decline in the months of inventory (MOI), which measures the balance between supply and demand.
Moderation in Competition
The decrease in MOI from earlier in the fall has not significantly intensified competition. The percentage of homes selling over the asking price has remained stable, signaling a market where buyers still hold some negotiation power. This restrained competitiveness is contributing to longer-than-usual days on the market for many listings.
Diverging Price Trends for Houses and Condos
House and condo prices moved in opposite directions in November 2024. House prices increased by 5% year-over-year, driven by sustained demand for detached homes, particularly in Toronto’s urban areas. Condo prices declined by 4% annually as high inventory levels and cautious investor sentiment weighed on this segment. Buyers continue to have leverage, with ample options and steady price declines
The Toronto housing market remains in flux, offering opportunities for buyers and challenges for sellers in an evolving landscape.
By the Numbers: November 2024
The average price for a house in the Toronto area was $1,370,641 in November, up 5% from the same month last year. Last month's median house price was $1,171,000, up 3% from the same month last year.
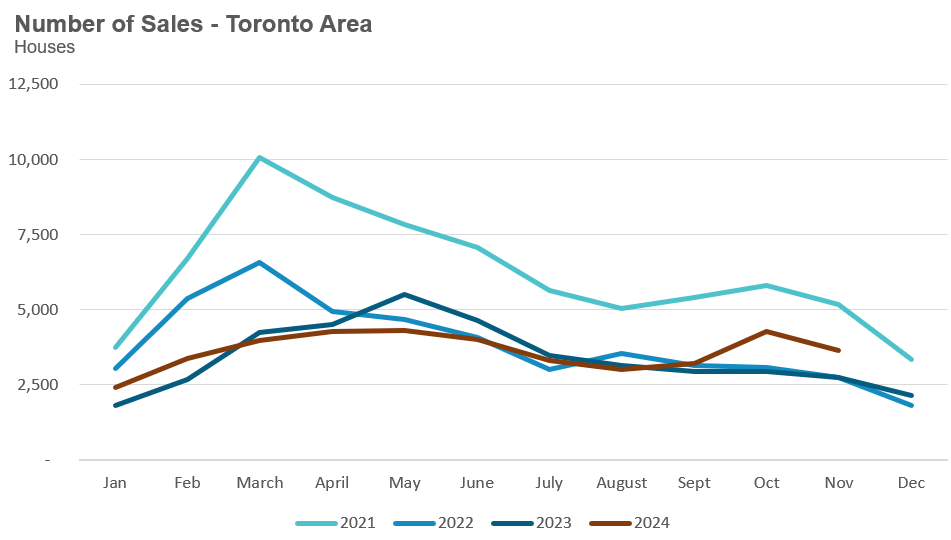
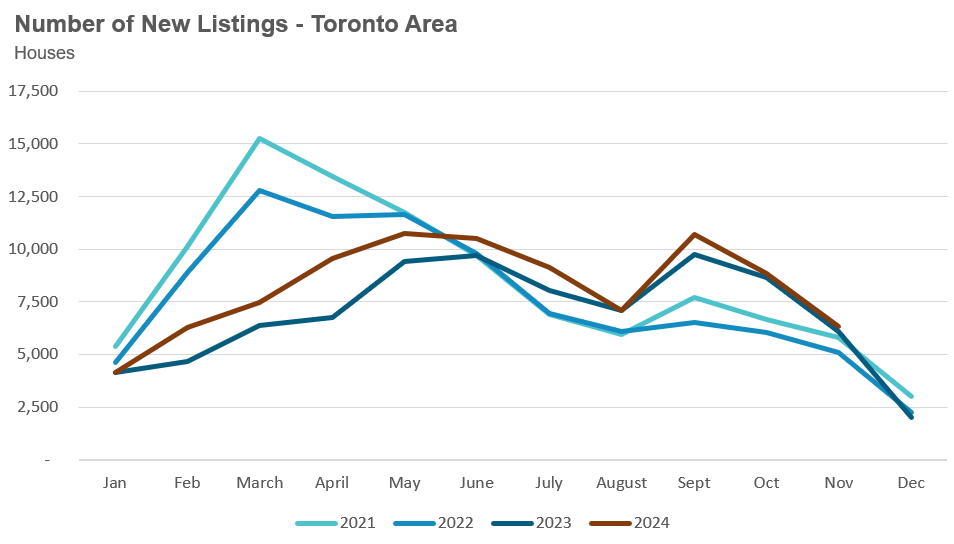
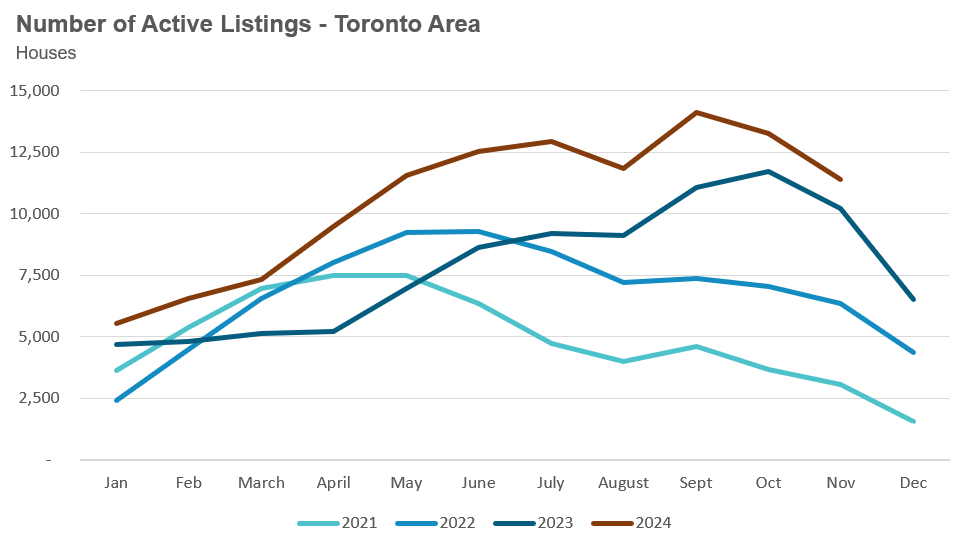
House sales in November were up 34% over last year, while new house listings were up 4%. The number of houses available for sale at the end of the month, or active listings, was up 12% over last year.
The current balance between supply and demand is reflected in the MOI, which measures inventory relative to the number of sales each month. In November, the MOI for houses fell slightly to 3.1.
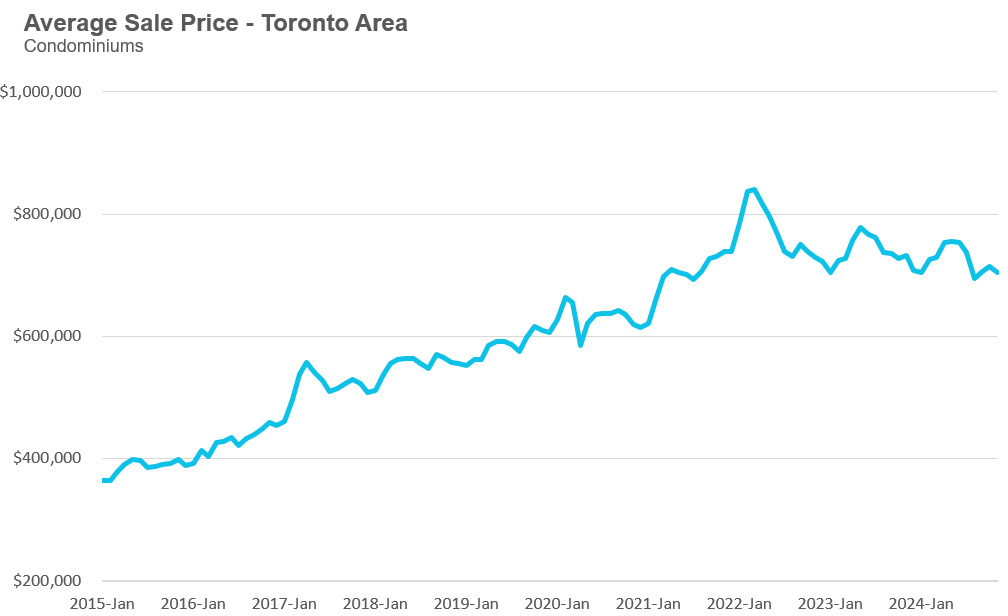
The average price for a condo in the Toronto Area was $705,036 in November, down 4% from the previous year. The median price for a condo in November was $638,888, down 2% from the previous year.
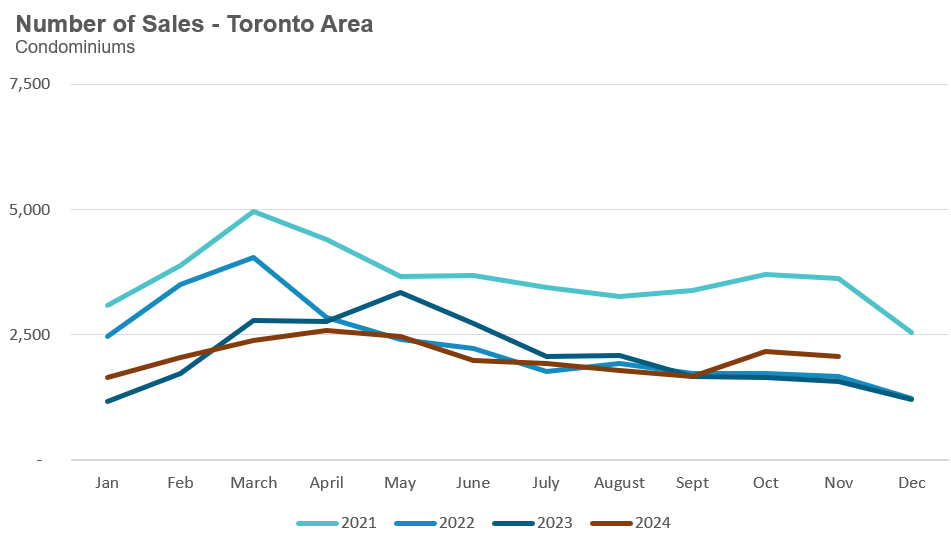
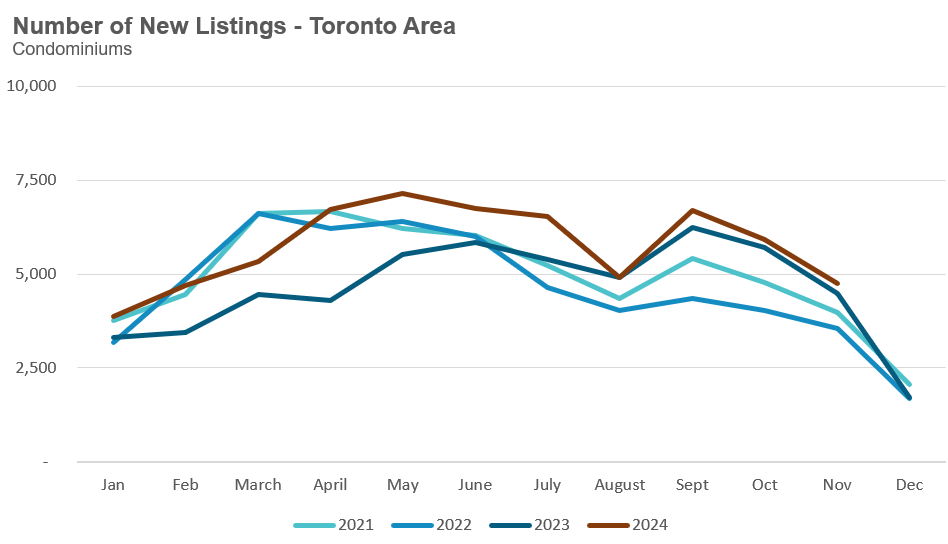
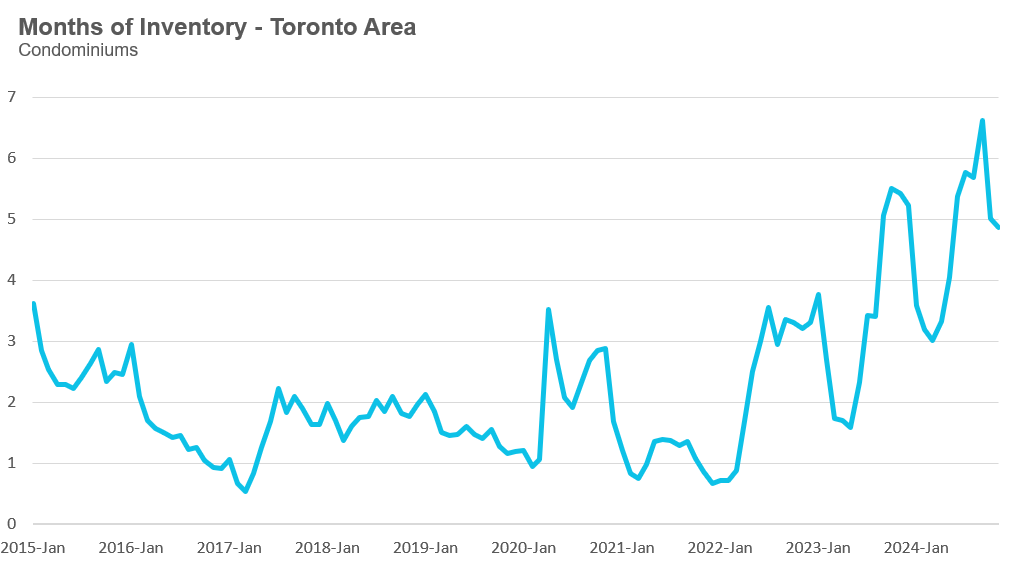
Condo sales in November were up 32% over last year, and new condo listings were up 6%. The number of active condo listings was up 19% from last year. The MOI fell to 5.
Browse detailed monthly statistics for November 2024 for the entire Toronto area market, including house, condo and regional breakdowns below.
Monthly Statistics
House Statistics
House sales (low-rise freehold detached, semi-detached, townhouse, etc.) in the Greater Toronto Area (GTA) in November 2024 were up 34% compared to the same month last year.
New house listings in November were up 4% compared to last year.
The number of houses available for sale (“active listings”) was up 12% in November compared to the same month last year.
The Months of Inventory ratio (MOI) looks at the number of homes available for sale in a given month divided by the number of homes sold in that month. It answers the following question: If no more homes came on the market for sale, how long would it take for all the existing homes on the market to sell, given the current level of demand? The higher the MOI, the cooler the market is. A balanced market (a market where prices are neither rising nor falling) is one where MOI is between four to six months. The lower the MOI, the more rapidly we would expect prices to rise.
While the current level of MOI gives us clues into how competitive the market is on-the-ground today, the direction it is moving in also gives us some clues into where the market November is heading.
The MOI for houses was unchanged at 3.1 for November.

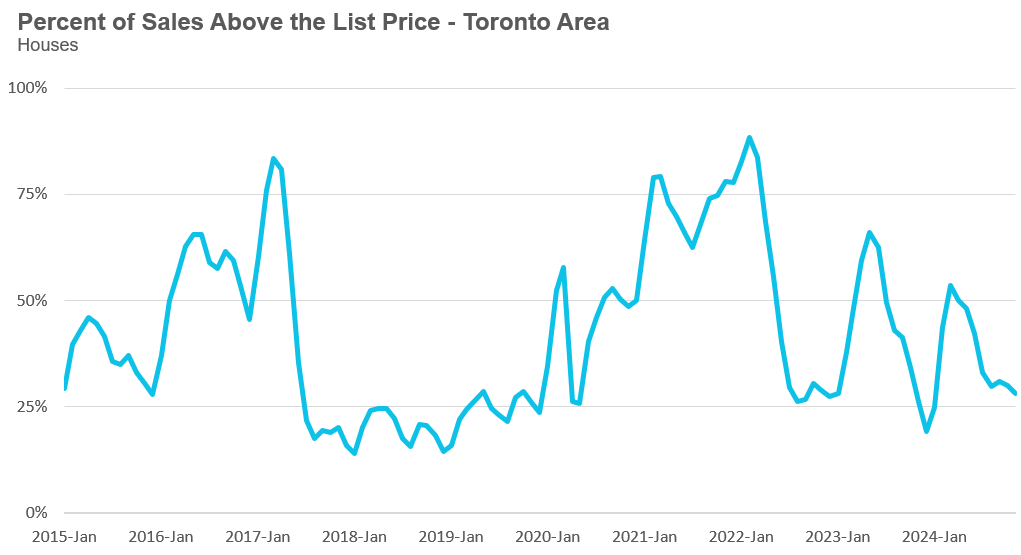
The share of houses selling for more than the owner’s list price fell to 28% in November.
The average price for a house in November 2024 was $1,370,641, up 5% from the same month last year.
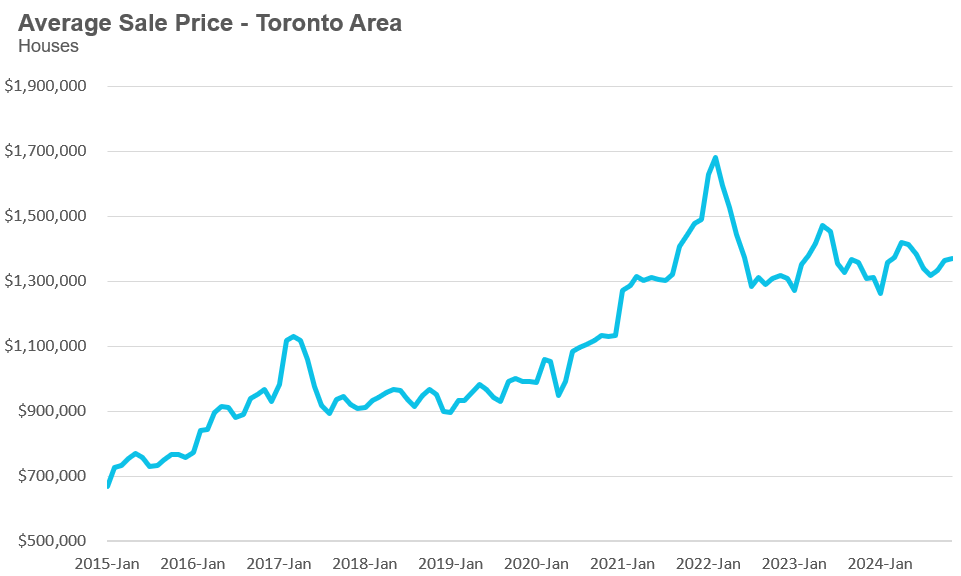
The median house price in November was $1,171,000, up 3% over last year.
The median is calculated by ordering all the sale prices in a given month and then selecting the price at the midpoint of that list such that half of all home sales are above that price and half are below that price. Economists often prefer the median price over the average because it is less sensitive to big increases in the sale of high-end or low-end homes in a given month, which can skew the average price.
Condo Statistics
Condo (condominiums, including condo apartments, condo townhouses, etc.) sales in the Toronto area in November 2024 were up 32% compared to the same month last year.
New condo listings were up 6% in November over last year.
The number of condos available for sale at the end of the month, or active listings, was up 19% over last year.
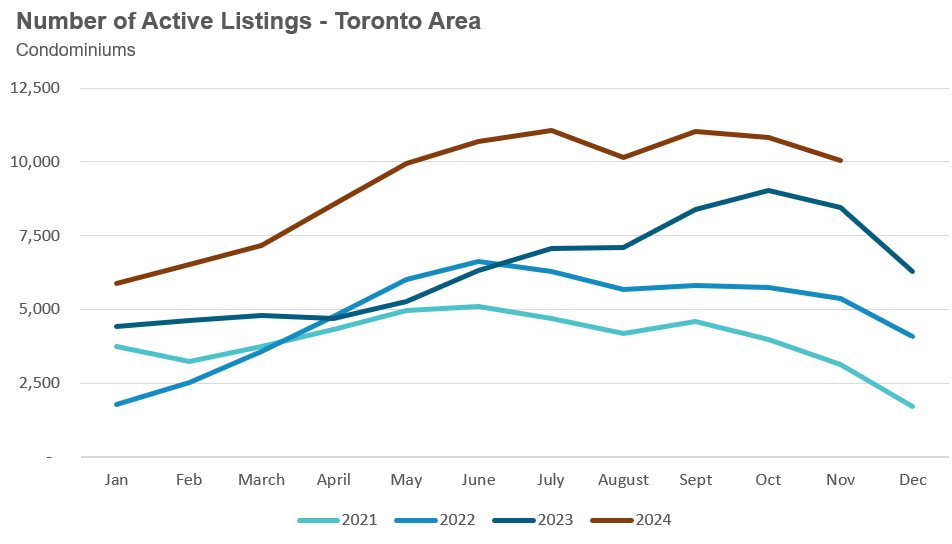
Condo months of inventory decreased to just under 5 MOI in November.
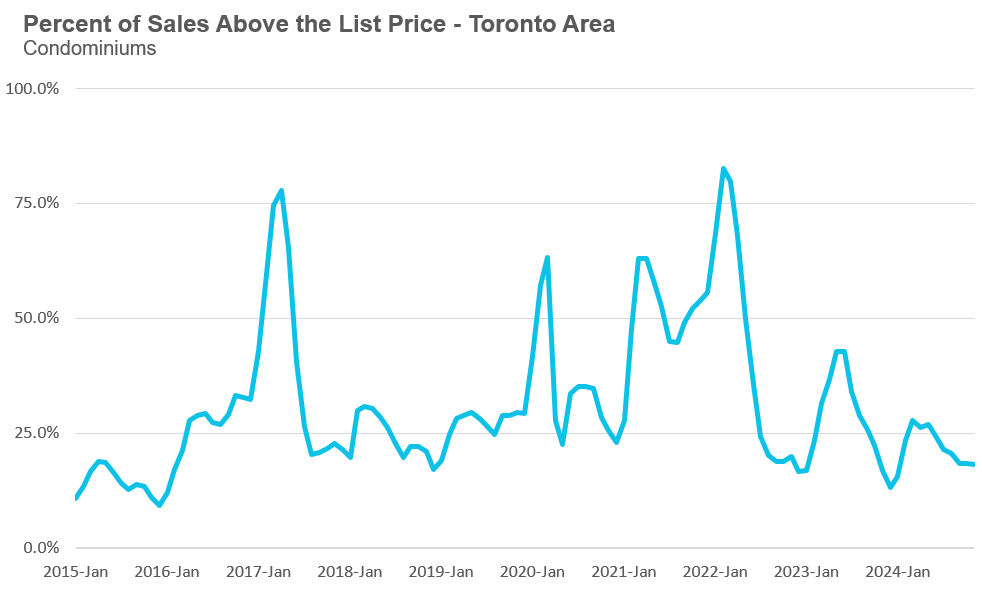
The share of condos selling for over the asking price was unchanged in November.
The average price of a condo in November was $705,036, down 4% from last year. The median price was $638,888, down 2% from last year.
Browse Real-Time Market Trends on MoveSmartly.com:
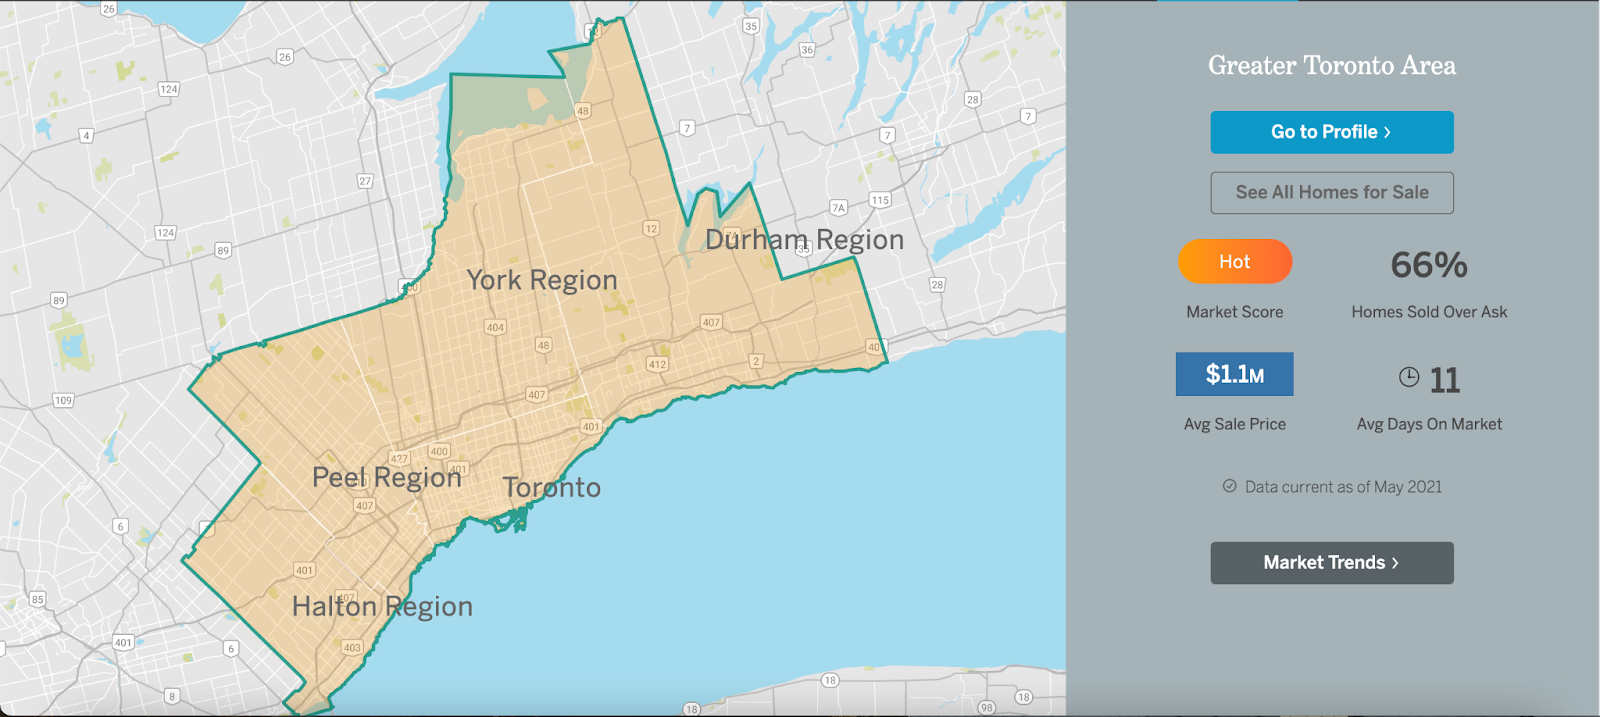
See Market Performance by Neighbourhood Map, All Toronto and the GTA
Greater Toronto Area Market Trends
John Pasalis is President of Realosophy Realty. A specialist in real estate data analysis, John’s research focuses on unlocking micro trends in the Greater Toronto Area real estate market. His research has been utilized by the Bank of Canada, the Canadian Mortgage and Housing Corporation (CMHC) and the International Monetary Fund (IMF).
Have questions about your own moves in the Toronto area as a buyer, seller, investor or renter? Book a no-obligation consult with John and his team at a Realosophy here: https://www.movesmartly.com/meetjohn
Published: December 05, 2024


