
GTA Housing Market Update – December 2025
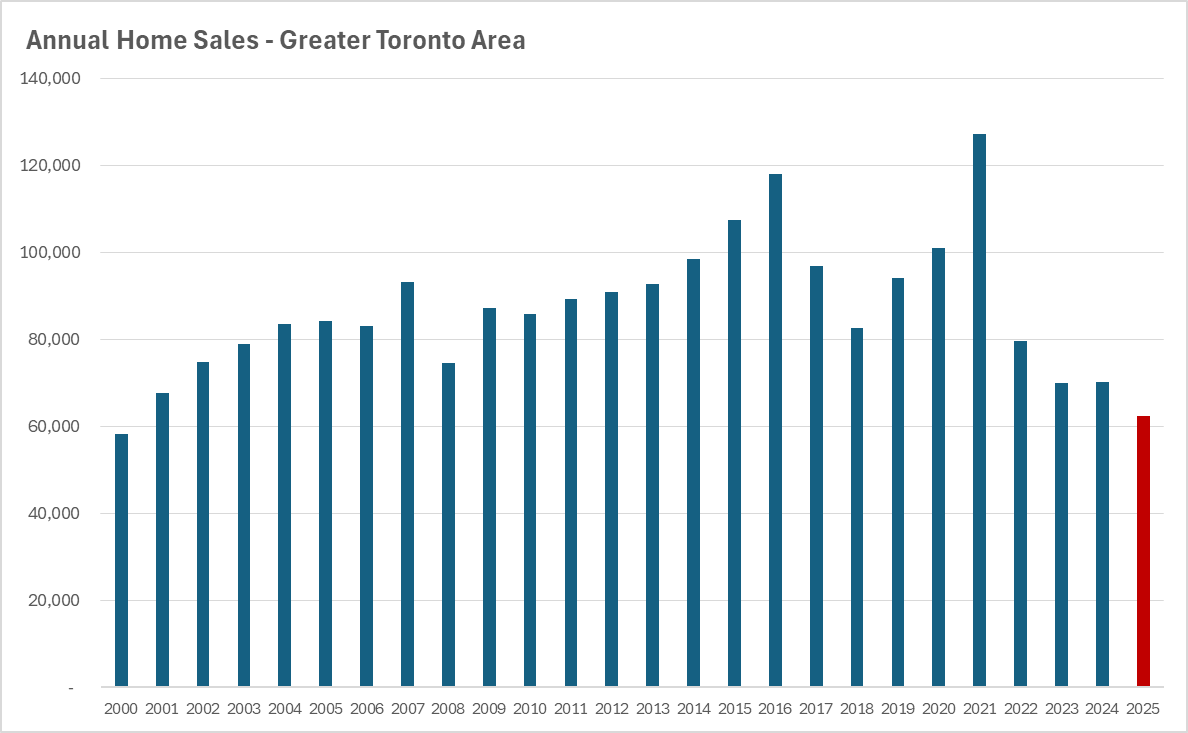
GTA home sales finished 2025 at 62,433 transactions, the lowest annual total since 2000. That followed sales of roughly 70,000 in both 2023 and 2024, which were already the weakest years since 2001.
This means three consecutive years of sales at more than a 20-year low, and by 2025 the market was clearly adjusting to that reality.
With demand this soft, new listings continued to outpace sales, pushing inventory higher and putting steady downward pressure on prices. As a result, prices declined across all major housing types in 2025, including detached homes, semis, townhouses, and condos.
A key shift this year was on the supply side. Over the previous two years, many sellers had held firm on their asking prices, hoping that lower interest rates would bring buyers back. In 2025, that changed. More sellers began pricing to the market rather than to past peak values, and many were motivated to sell sooner rather than wait in a falling market.
At the same time, buyer demand remained weak. Global trade tensions, geopolitical uncertainty, and broader economic risks made many households cautious. In addition, falling prices created an incentive for buyers to wait, which further reduced near-term demand.
One of the more surprising outcomes in 2025 was that low-rise homes and condominiums saw very similar percentage price declines. Most analysts expected houses to hold up better than condos, but that was not what played out. The correction was broad-based, not limited to one segment of the market.
Another important development this year was on the financial stress side. More households began falling behind on their mortgage payments, and this led to a noticeable increase in the number of homes sold under power of sale. That trend accelerated through 2025 and is likely to continue into 2026 as higher borrowing costs and weaker prices put pressure on stretched homeowners.
Taken together, 2025 was a year of lower sales, falling prices, rising inventory, and growing financial strain across the GTA housing market.
December at a Glance
Houses
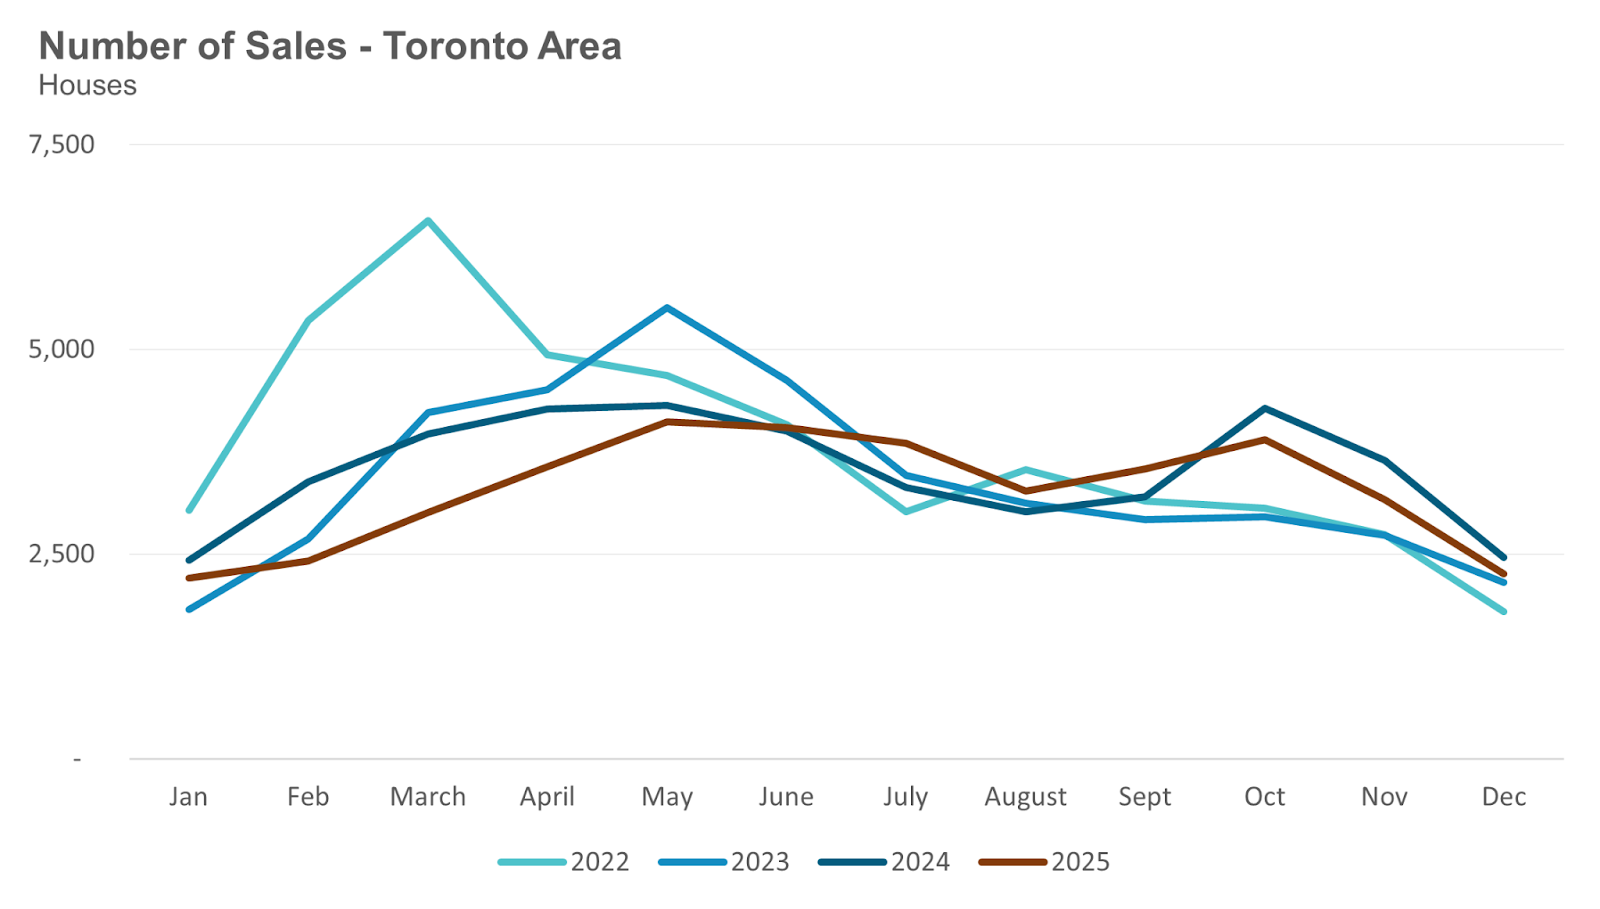
Sales were down 8 percent over last year.
New listings were up 5 percent.
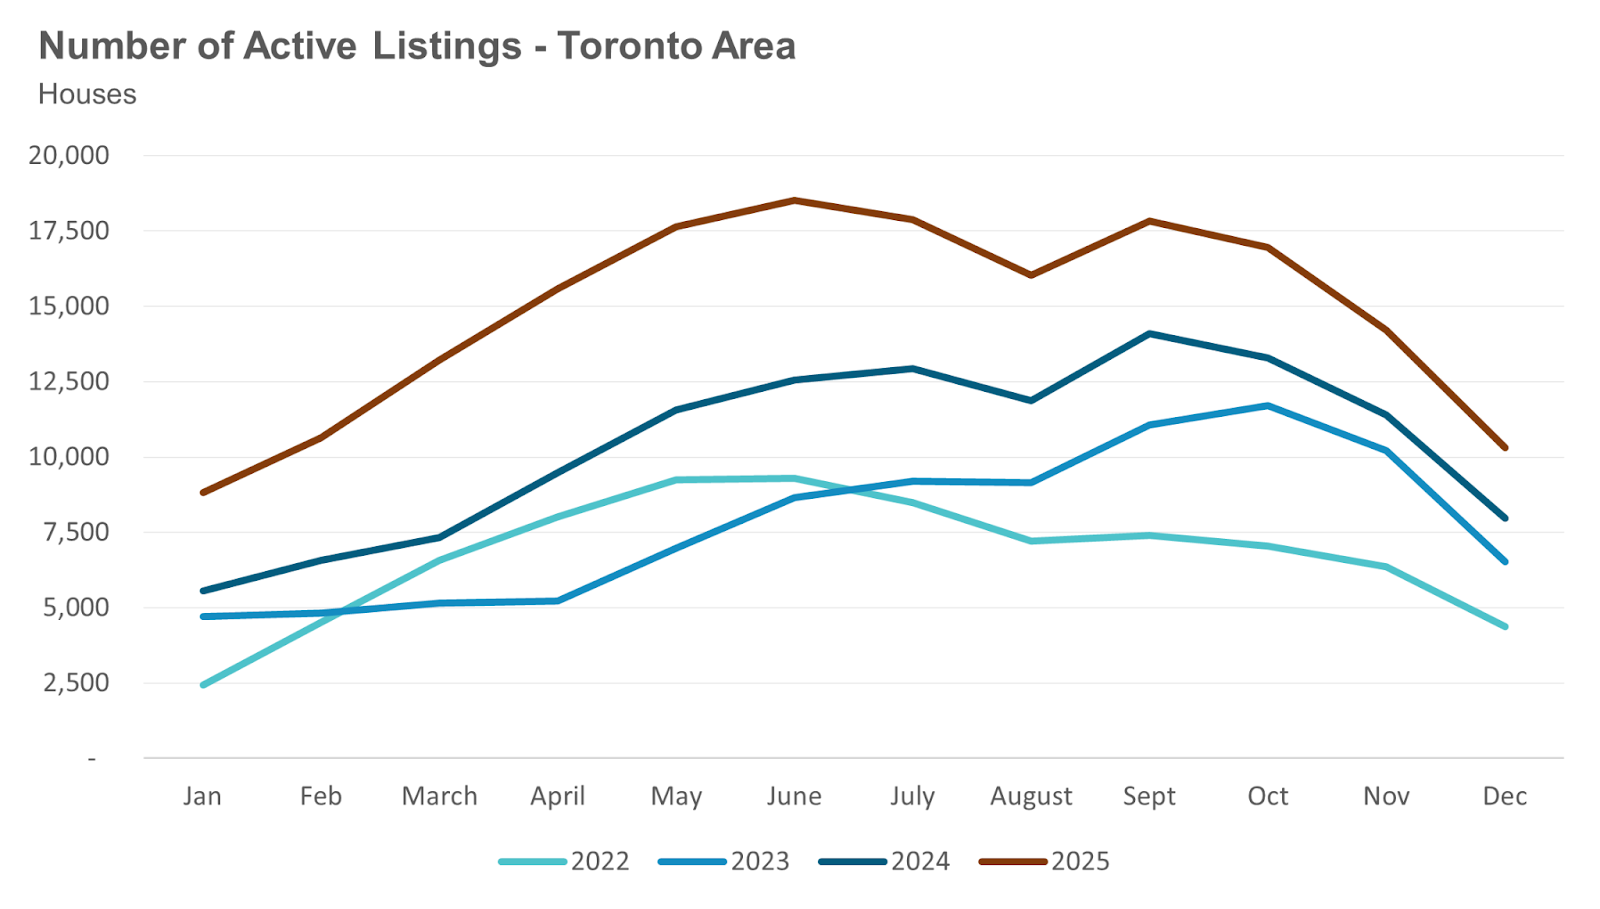
Active listings were up 29 percent.
Months of Inventory increased to 4.6.
Average price: $1,227,979, down 6 percent.
Median price: $1,035,000, down 8 percent.
Condos
Sales were down 14 percent over last year.
New listings were down 2 percent.
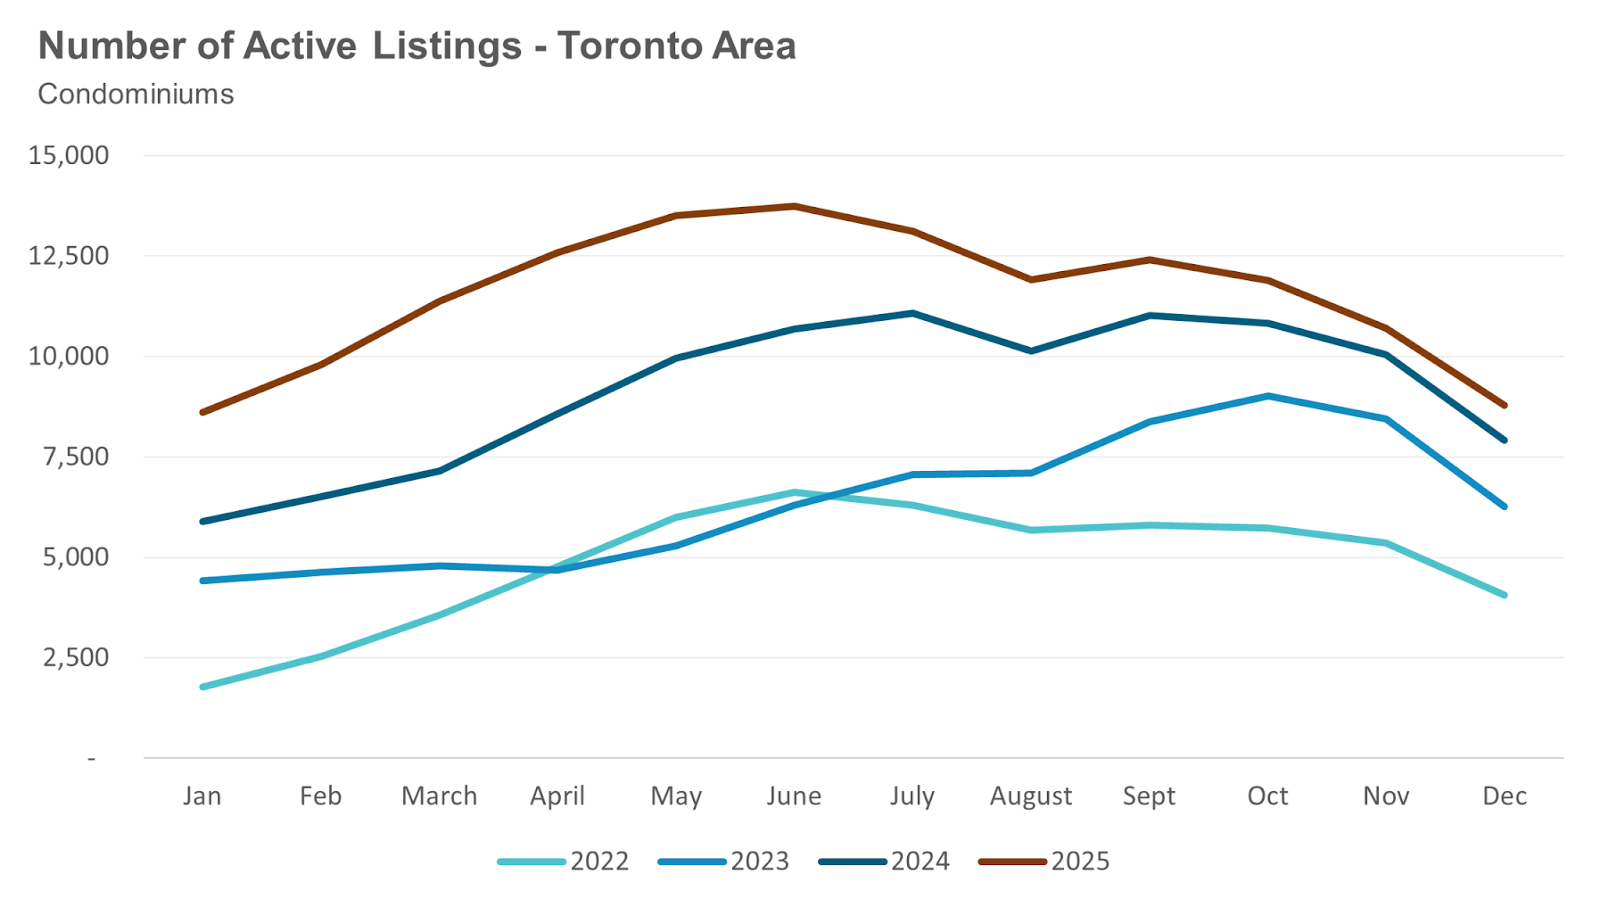
Active listings were up 11 percent.
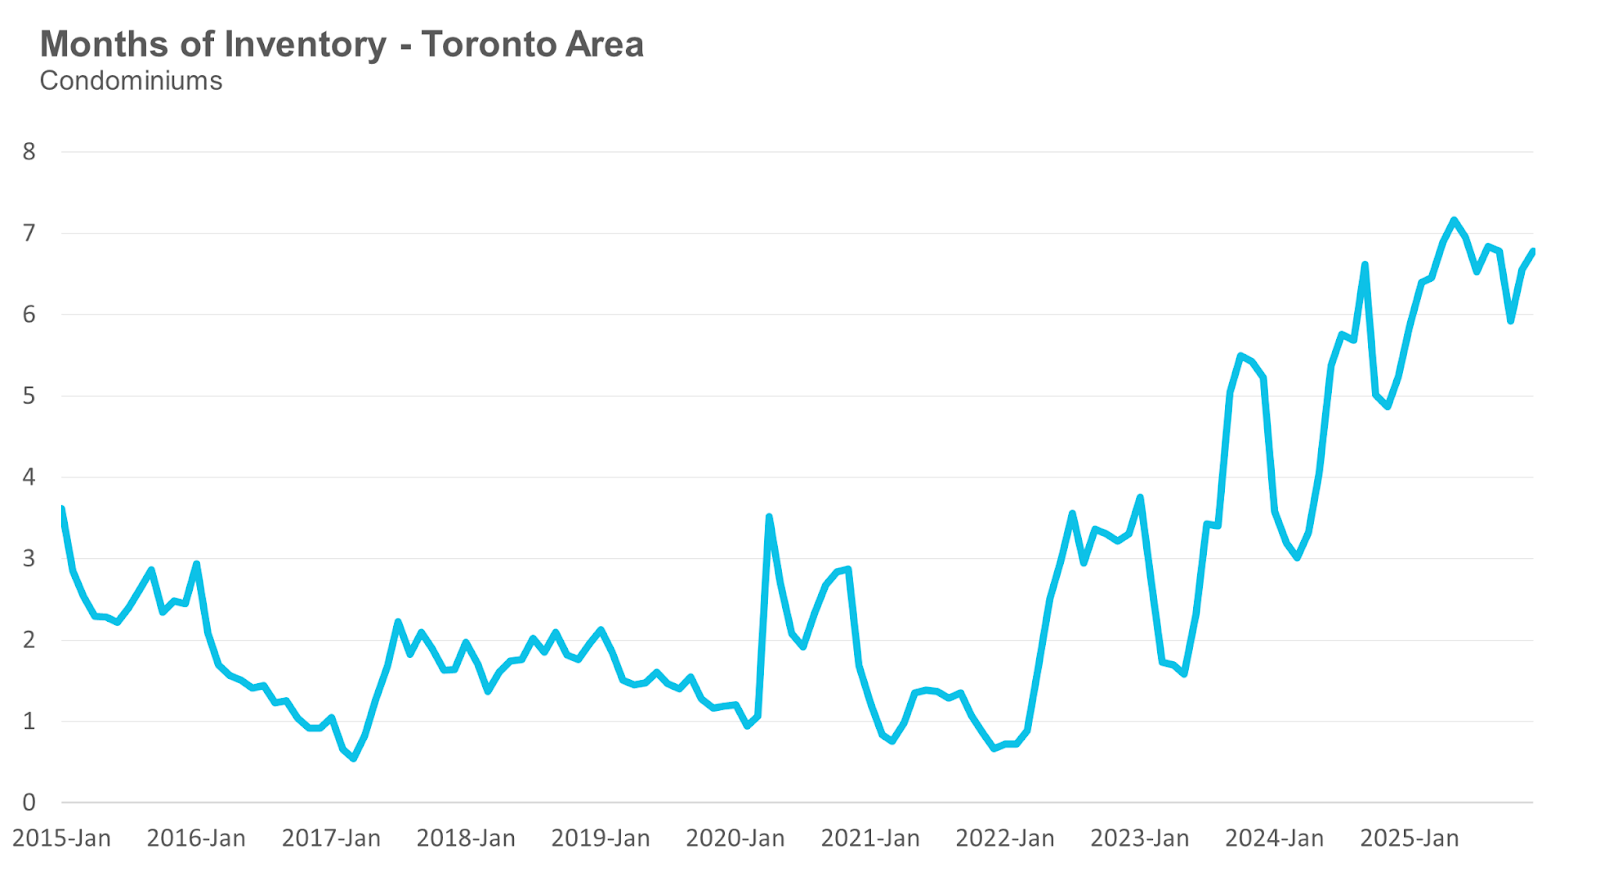
Months of Inventory increased to 6.8.
Average price: $651,043, down 7 percent.
Median price: $570,000, down 10 percent.
Monthly Statistics
House Statistics
House sales (low-rise freehold detached, semi-detached, townhouse, etc.) in the Greater Toronto Area (GTA) in December 2025 were down 8% compared to the same month last year.
New house listings in December were up 5% compared to last year.

The number of houses available for sale (“active listings”) was up 29% in December compared to the same month last year.
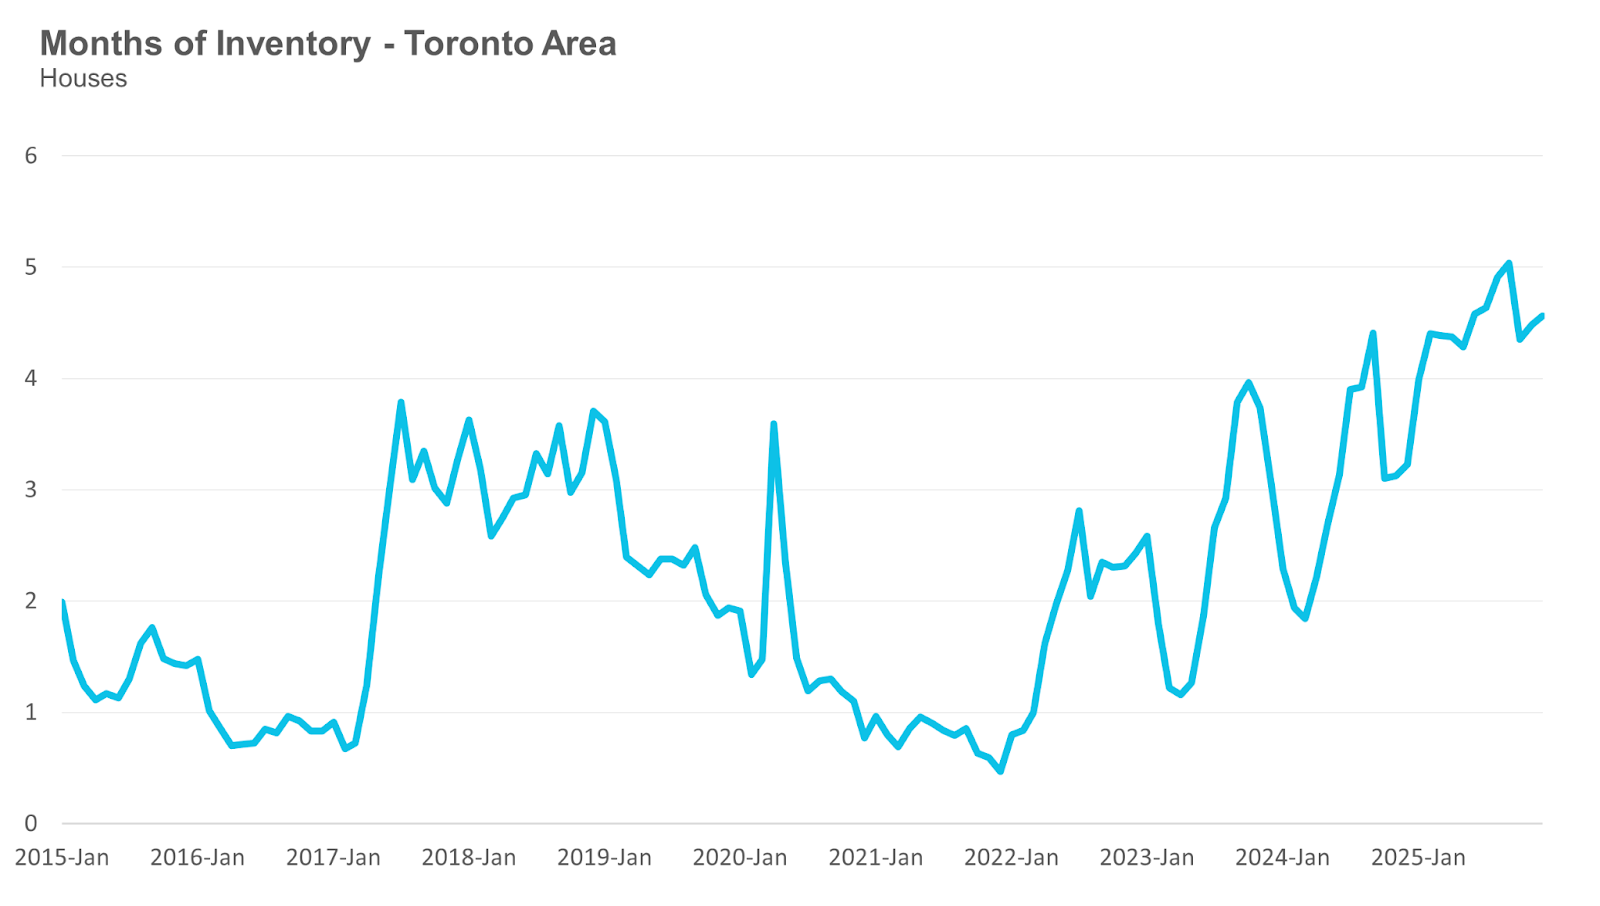
The Months of Inventory ratio (MOI) looks at the number of homes available for sale in a given month divided by the number of homes sold in that month. It answers the following question: If no more homes came on the market for sale, how long would it take for all the existing homes on the market to sell, given the current level of demand? The higher the MOI, the cooler the market is. A balanced market (a market where prices are neither rising nor falling) is one where MOI is between four to six months. The lower the MOI, the more rapidly we would expect prices to rise.
While the current level of MOI gives us clues into how competitive the market is on-the-ground today, the direction it is moving in also gives us some clues into where the market December is heading.
The MOI for houses increased to 4.6 in December.
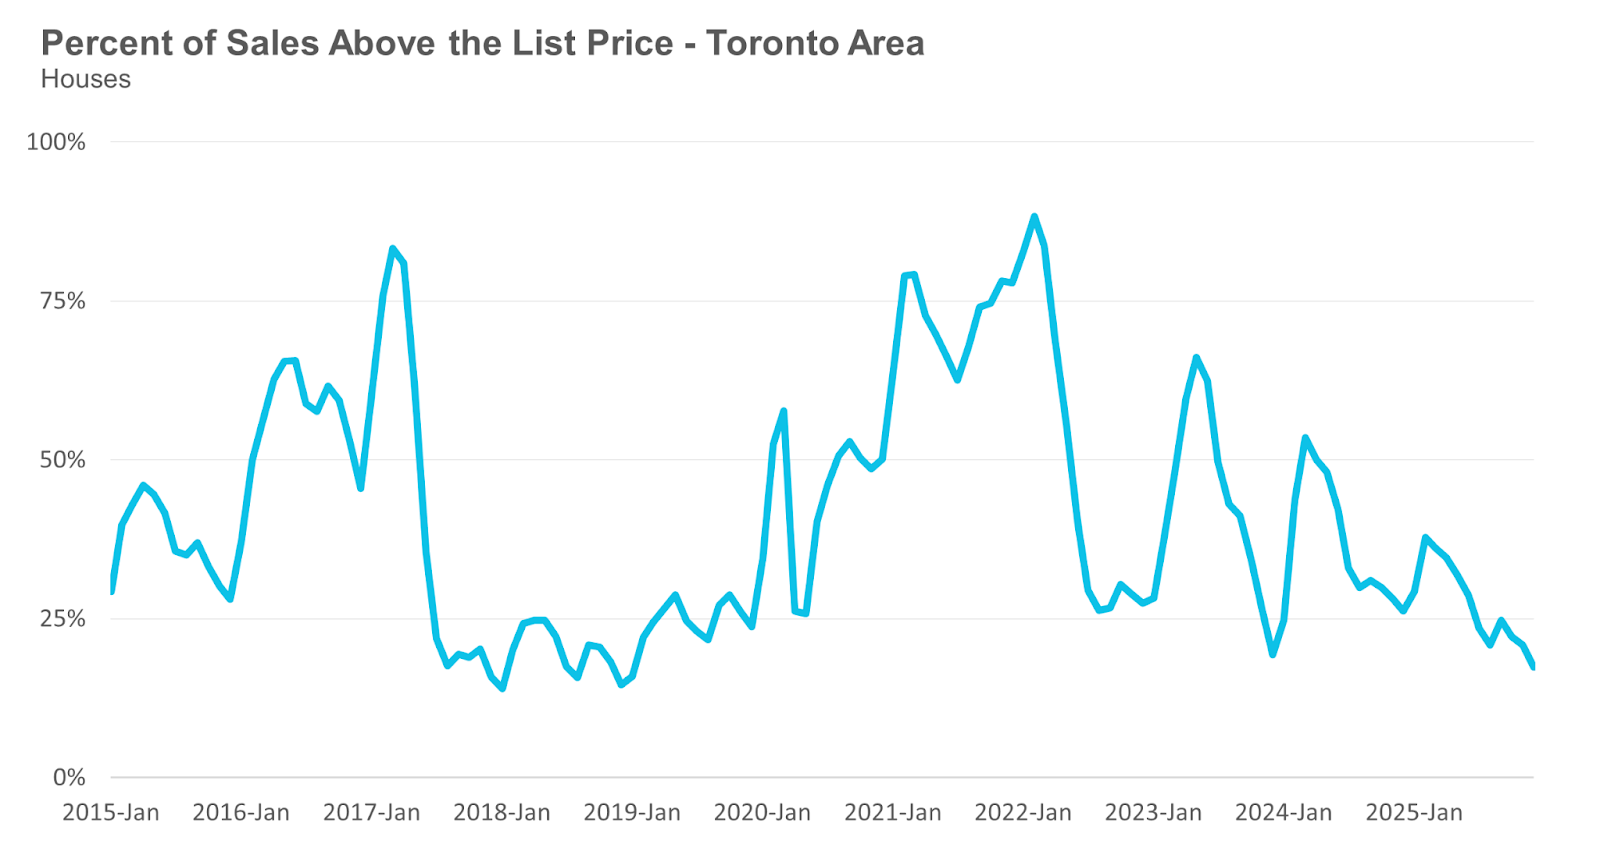
The share of houses selling for more than the owner’s list price fell to 17% in December.
The average price for a house in December 2025, $1,227,979, was down 6% from the same month last year.
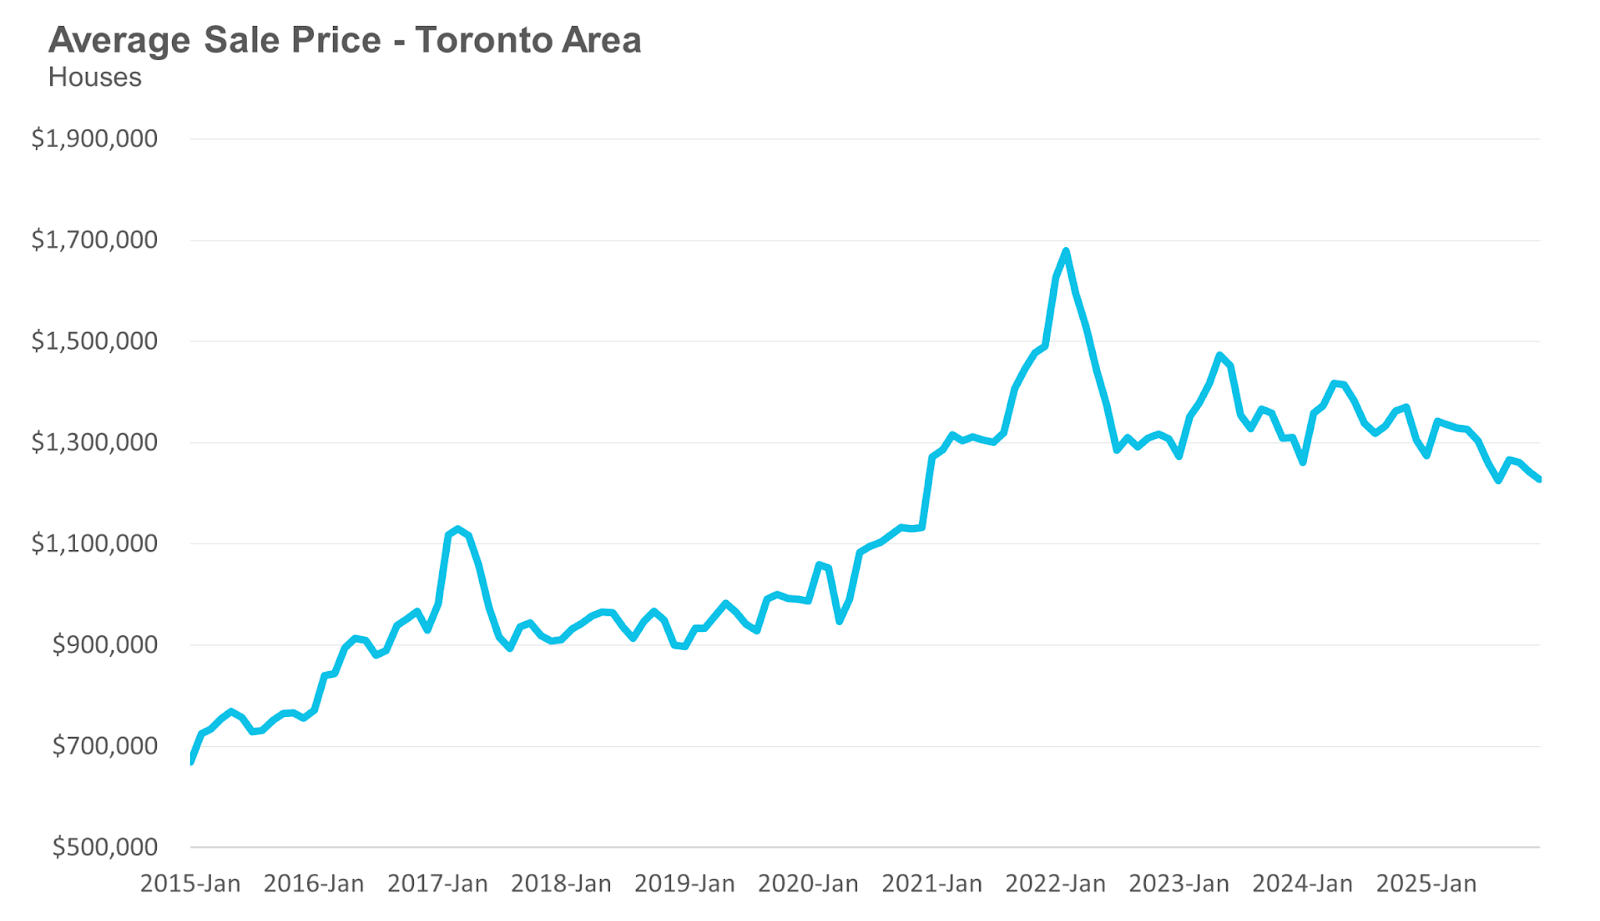
The median house price in December was $1,035,000, down 8% over last year.
The median is calculated by ordering all the sale prices in a given month and then selecting the price at the midpoint of that list such that half of all home sales are above that price and half are below that price. Economists often prefer the median price over the average because it is less sensitive to big increases in the sale of high-end or low-end homes in a given month, which can skew the average price.
Condo Statistics
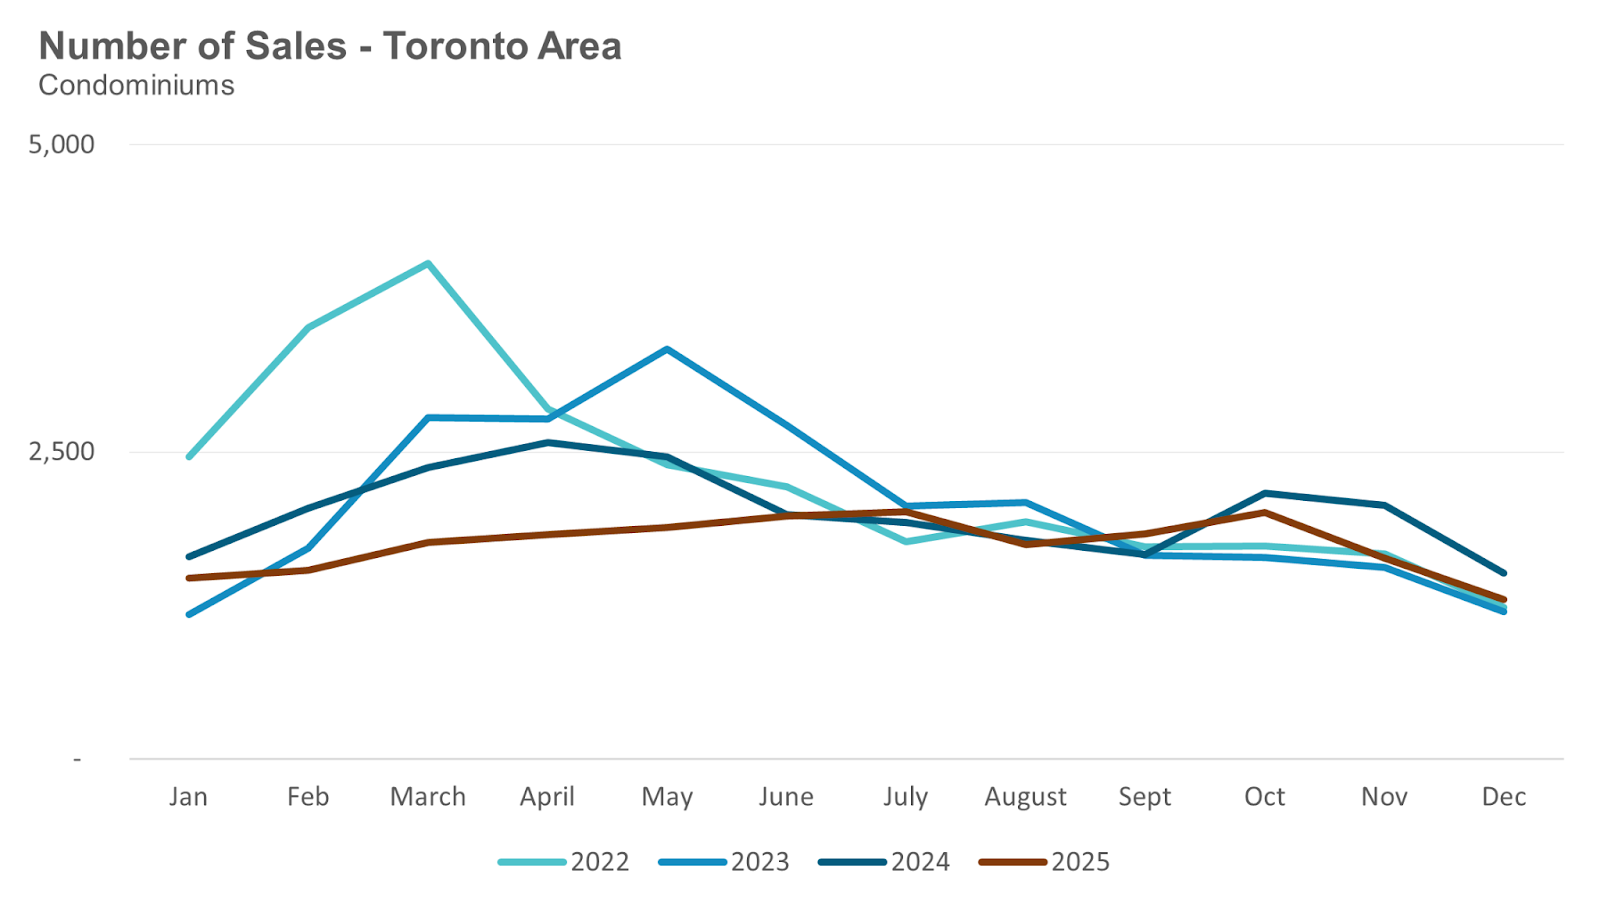
Condo (condominiums, including condo apartments, condo townhouses, etc.) sales in the Toronto area in December 2025 were down 14% compared to the same month last year.
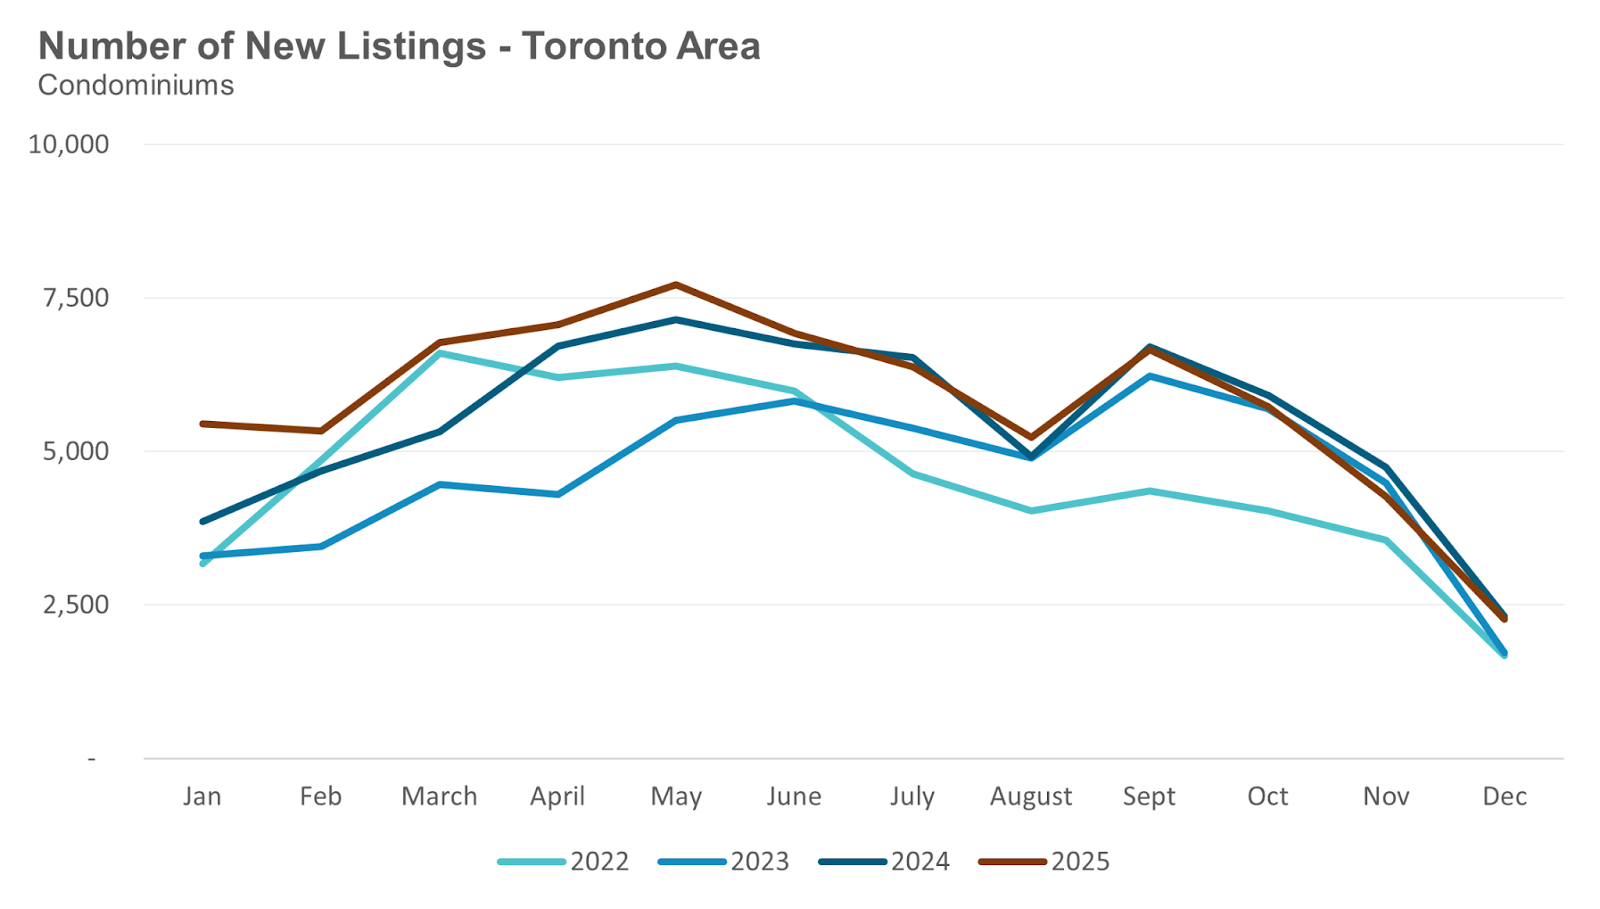
New condo listings were down 2% in December over last year.
The number of condos available for sale at the end of the month, or active listings, was up 11% over last year.
Condo months of inventory increased to 6.8 MOI in December.
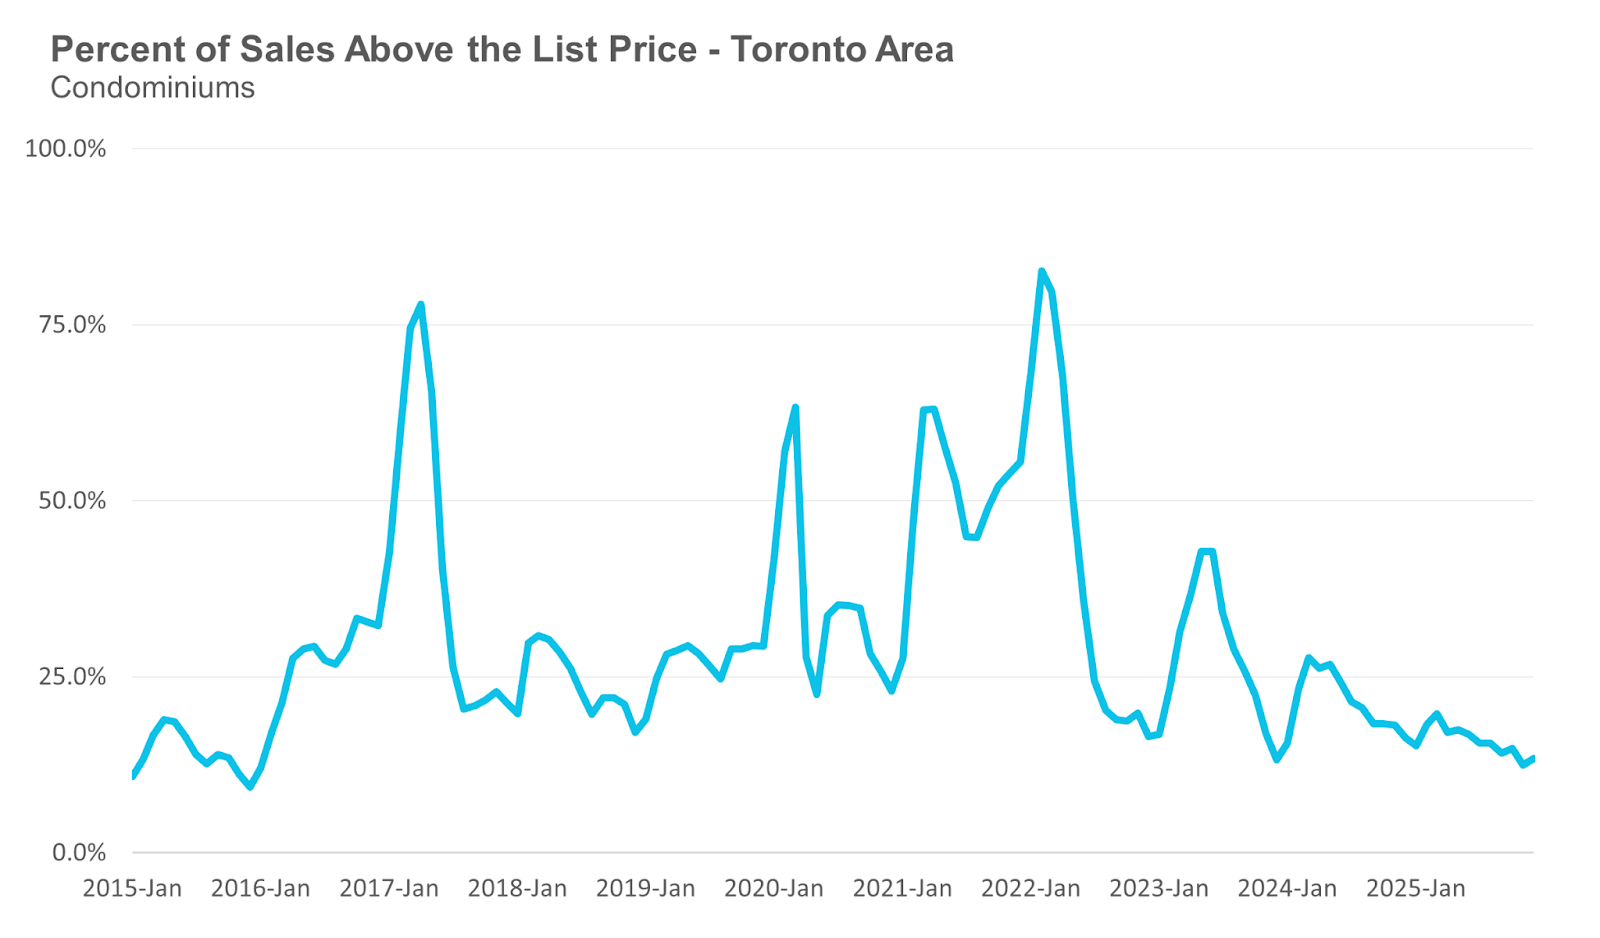
The share of condos selling for over the asking price was unchanged at 13% in December.
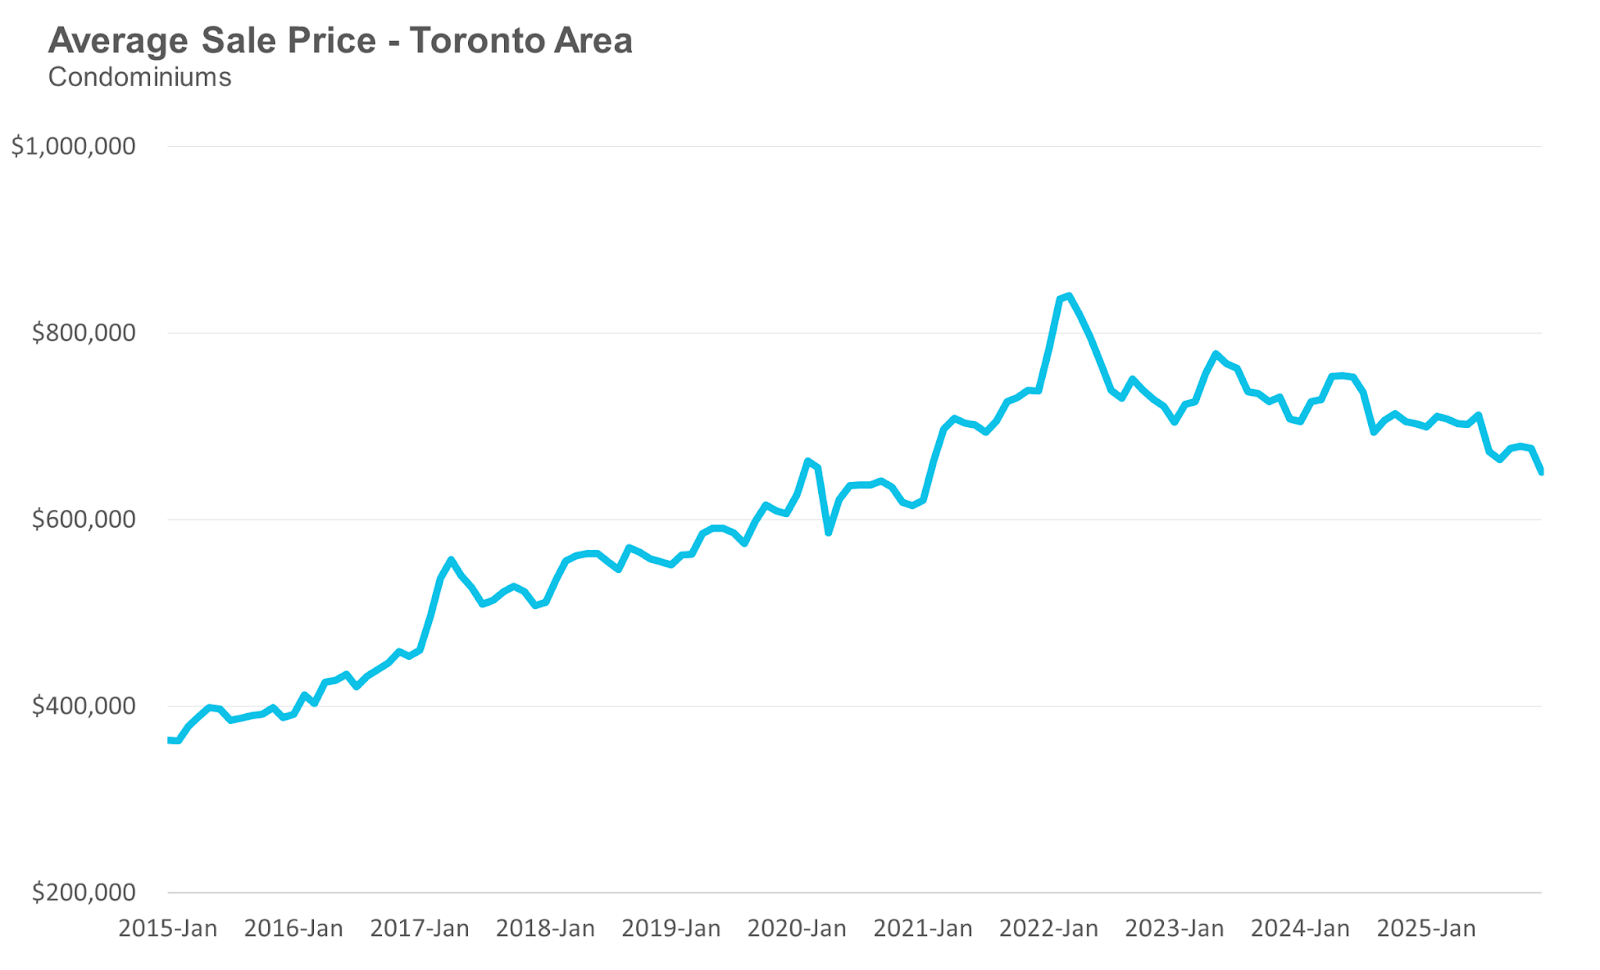
The average price of a condo in December was $651,043, down 7% from last year. The median price was $570,000, down 10% from last year.
John Pasalis is President of Realosophy Realty. A specialist in real estate data analysis, John’s research focuses on unlocking micro trends in the Greater Toronto Area real estate market. His research has been utilized by the Bank of Canada, the Canadian Mortgage and Housing Corporation (CMHC) and the International Monetary Fund (IMF).
Have questions about your own moves in the Toronto area as a buyer, seller, investor or renter? Book a no-obligation consult with John and his team at a Realosophy here: https://www.movesmartly.com/meetjohn
Published: January 12, 2026


