When we look at the number of properties that have been listed for sale in the Greater Toronto Area (GTA) (including Toronto) since 2012, we see a very interesting trend.
The number of new listings has been trending down since 2012 which means that more buyers are competing for fewer and fewer houses available for sale.
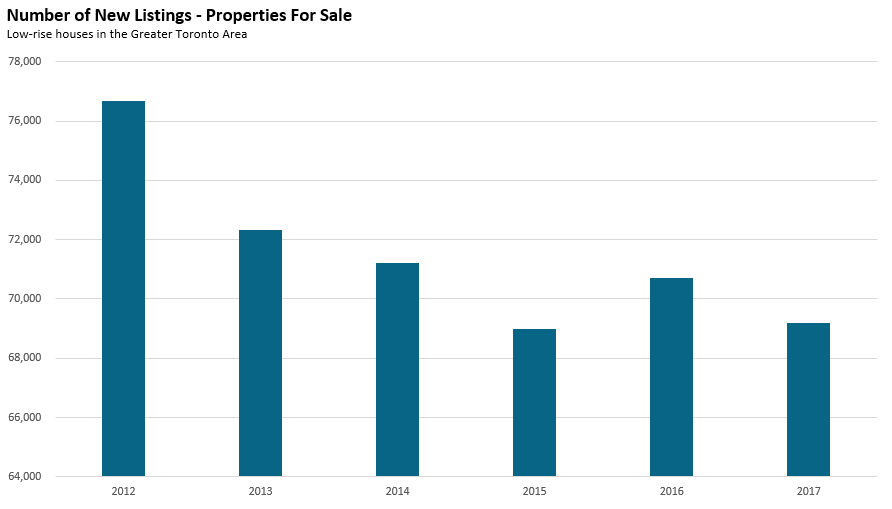
The chart above reflects the number of unique low-rise houses that were listed for sale in any given year. We have filtered out duplicate listings for the same property – a practice agents use when a particular property has been sitting on the market for a long period of time.
This trend raises a very important question, why are the number of new listings declining in the GTA?
Since 2008, the GTA has seen over 120,000 new low-rise houses completed, not a big number over a ten-year period, but still an increase in the overall housing stock that we would think could result in a slight increase in the number of new listings over time - but it hasn’t.
While it’s very difficult to pinpoint a single explanation for this trend, one possible explanation can be seen by looking at how the number of rental listings for low-rise houses have changed over the same period.
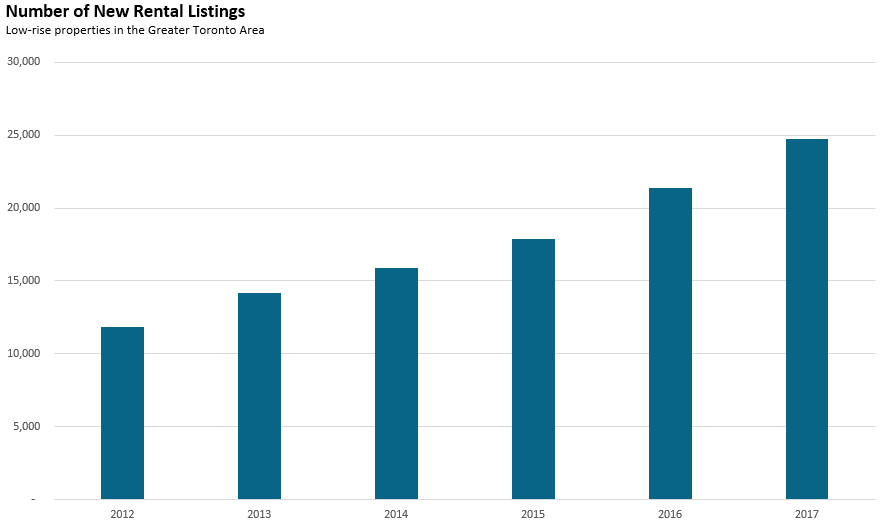
Since 2012, the number of properties listed for rent on the MLS (a platform utilized by agents and brokers to advertise properties) has more than doubled, which likely means that the number of single family homes owned by investors has also roughly doubled.
One possible explanation for the decline in new listings for sale and the rise in rental listings is that some existing homeowners who are buying a new house in the GTA are opting to simply hold on to their existing home as a rental property rather than sell it. While it’s difficult to quantify such behaviour, we know anecdotally that among the few owners that can afford to hold on to two properties, many chose to.
How could this have impacted house prices and rents in the GTA? Fewer houses for sale helps push sales prices higher and a surge in rental listings helps to moderate rental prices.
The chart below shows how average house prices and rents have changed in the GTA since 2012. House prices have climbed 64% compared to an 11% increase in average rents.
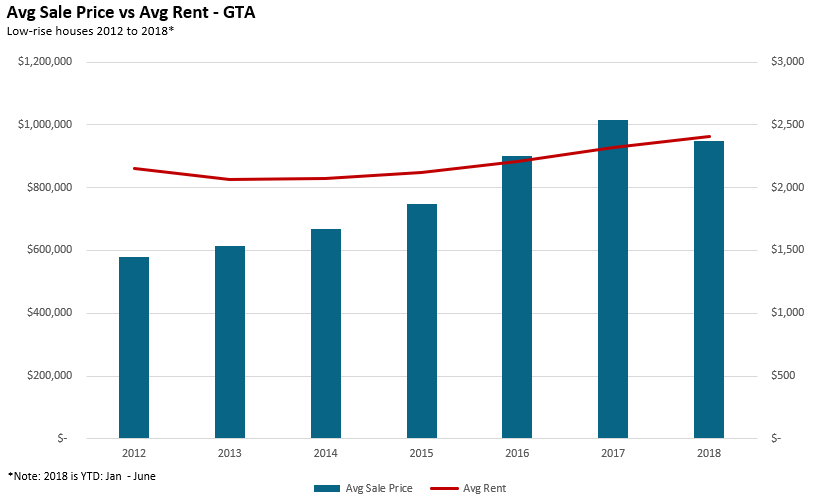
Now that house prices are no longer increasing very much in the GTA, it will be interesting to see if this downward trend in the number of new listings continues into 2018.
John Pasalis is the President and Broker of Realosophy Realty Inc. Brokerage in Toronto. A leader in real estate analytics and pro-consumer advice, Realosophy helps clients buy or sell a home the right way.
Follow John on Twitter @johnpasalis
Published: July 12, 2018