The headlines and the recent numbers about the Greater Toronto Area’s real estate market have not been great this spring. Average home prices are down 14% in March and sales are down 40% year-over-year – the type of numbers that leave you with the impression that the sky is falling on GTA real estate.
But the numbers don’t really reflect what is happening in the market today and it’s leading to a lot of confusion for buyers who find themselves in bidding wars on homes during a market that they hear is in decline.
Average Prices
Average prices in the GTA peaked in April 2017 at $920,791 and by August had tumbled to $732,292 – a 20% decline in just four months. Since then, average prices have actually remained relatively steady. The chart below shows average prices in the GTA since 2016.
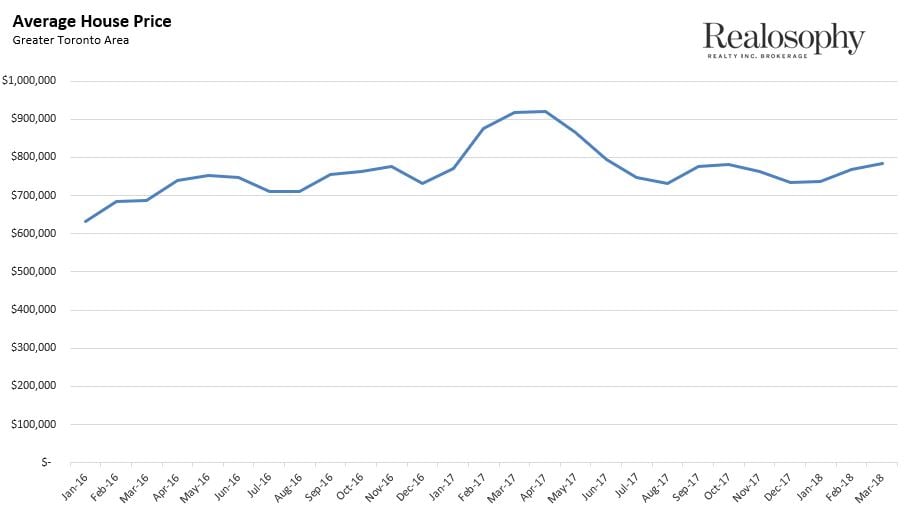
The decline in prices we are seeing in the headlines today actually reflect the declines that happened last year. They’re making the headlines now because we are now comparing these declines on a year over year basis against the peak of the market. But in many ways, these price declines are old news.
Sales
When considering the decline in sales, there are a couple of things we need to keep in mind. Firstly, we are comparing our market today to the peak of Toronto’s real estate bubble – a market that was so out of balance prices were rising by 33% per year. To get back to a more balanced market either sales have to fall dramatically or new listings have to rise – or both. In the case of the GTA new listings were actually down 14% over last year which means that any relief from the bubble-like imbalance we saw last year had to come from a dramatic decline in demand.
When trying to make sense of how alarming this decline in demand is we want to consider the demand for homes in relation to the current active inventory. The months of inventory represents the number of months it would take for all the current homes on the market to sell given the current inventory levels and sales volumes.
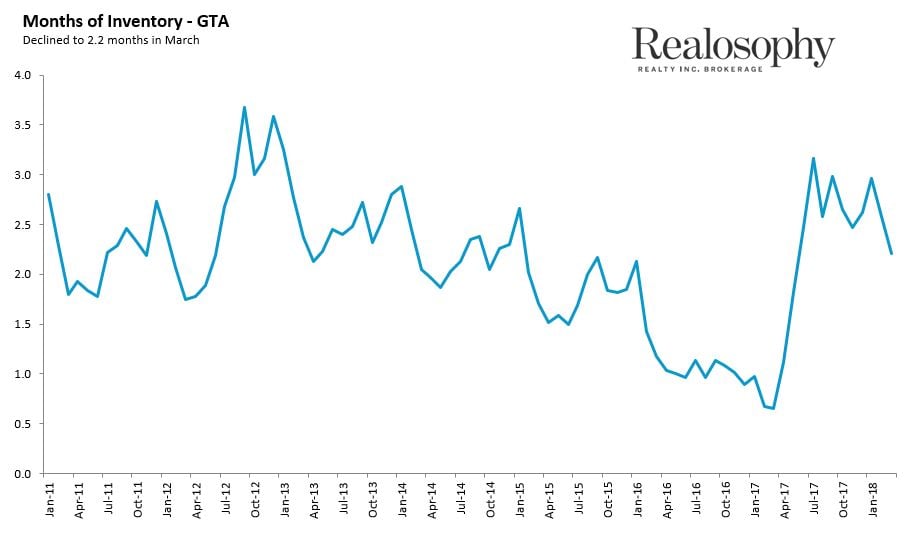
Since August the months of inventory has remained relatively stable between 2.5-3 months which tells us two important things. Firstly, this level of inventory is what we expect in a competitive seller’s market – not a buyer’s market. Buyer markets tend to have upwards of 6 months of inventory at any given point in time.
Today's market of course is not as competitive as last March when there was just over half a month of inventory – but it is still a competitive market and explains why many downtown buyers are finding themselves competing in bidding wars.
The other important observation is that the months of inventory is not trending up – it has remained in the same range since August and is actually trending down the past few months suggesting things are heating up a bit, not cooling down. Had the months of inventory been trending up as it was in the spring of 2017, then this would have been a sign that the market is likely to cool even further.
While there are some areas in the GTA that are cooler than others and showing some price declines – the market as a whole is actually quite stable right now.
Illustration: eseninstudio
John Pasalis is the President and Broker of Realosophy Realty Inc. Brokerage in Toronto. A leader in real estate analytics and pro-consumer advice, Realosophy helps clients buy or sell a home the right way.
Published: April 05, 2018