FREE PUBLIC WEBINAR: WATCH REPORT HIGHLIGHTS & Q/A - Thursday December 14th 12PM ET
.jpg?width=600&height=337&name=Public%20Webinar%20Social%20%E2%80%93%20Dec%202023_YouTube%20(1).jpg)
Join John Pasalis, report author, market analyst and President of Realosophy Realty, in a free monthly webinar as he discusses key highlights from this report, with added timely observations about new emerging issues, and answers your questions. A must see for well-informed Toronto area real estate consumers.
Is Toronto’s housing market turning another corner after being sluggish over the past few months?
It’s still too early to say, and while home sales in the Toronto area remain at historic lows and inventory is up over last year, some key numbers are moving in the opposite direction than many, myself included, were expecting.
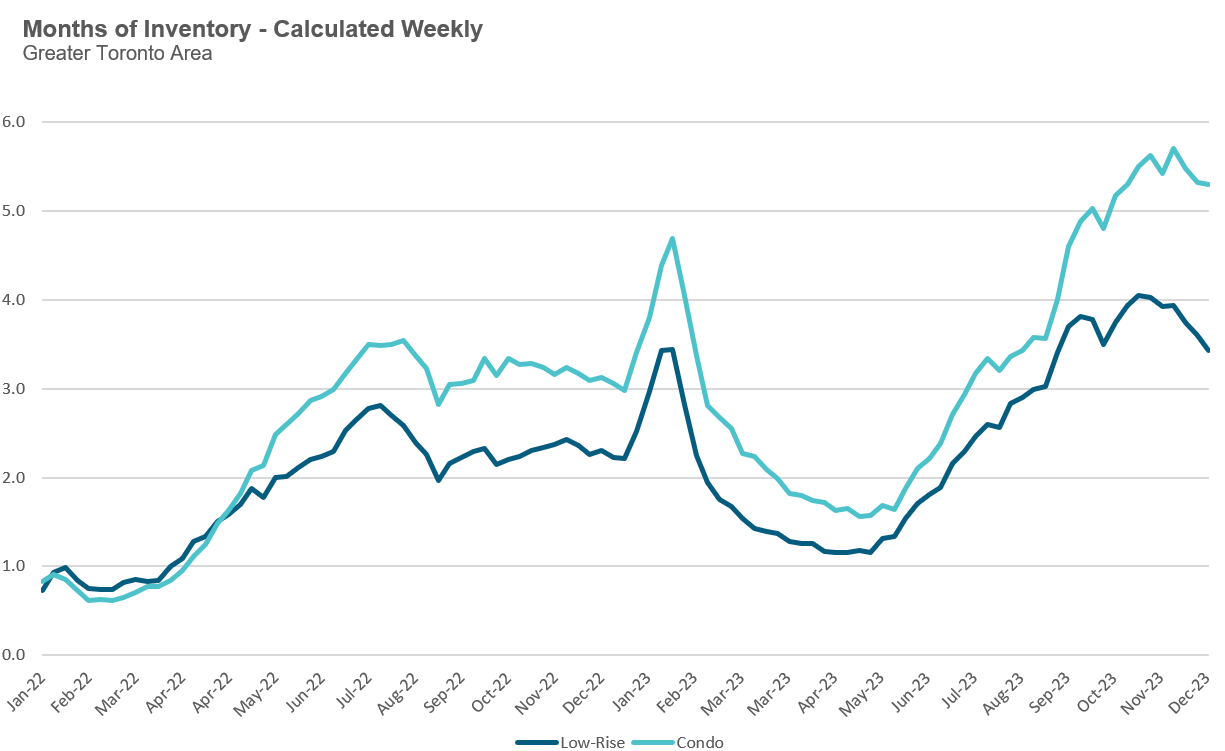
To get a sense of which way the market is heading, or its momentum, we need to look at the relationship between sales and inventory levels, referred to as the months of inventory (MOI). The MOI is the number of homes available for sale divided by the number sold over the previous month (for a more detailed explanation of this measure, see the final section of this report).
When the MOI is trending up, it means that the number of listings coming on the market for sale is outpacing the demand from sales, causing inventory levels to increase in a slowing market. On the flip side, when the MOI starts trending down, it typically means that sales are outpacing the volume of new listings, causing the MOI to decrease gradually.
Looking at weekly MOI data, we can see that MOI levels have been trending down, particularly for houses, since peaking five weeks ago.
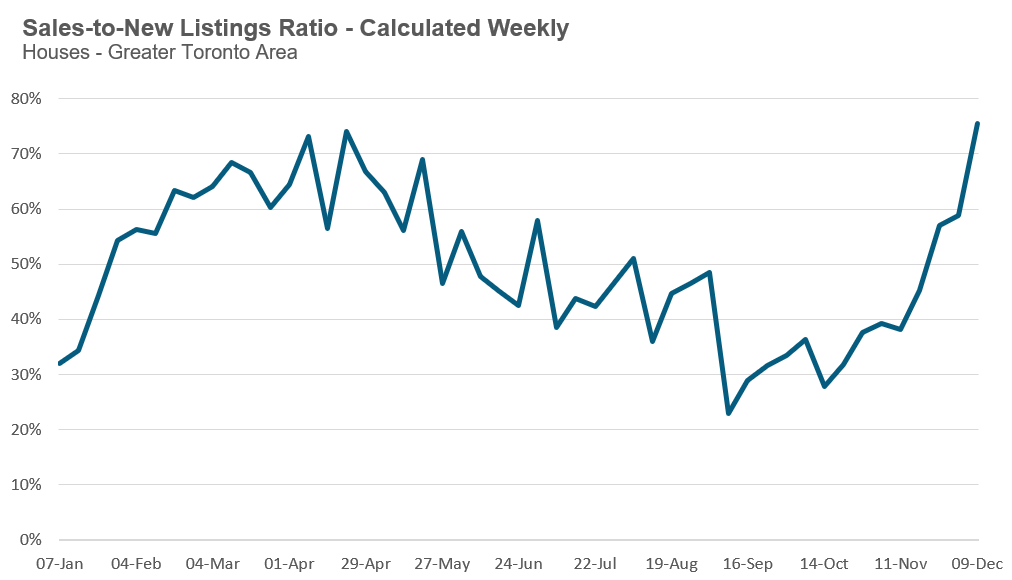
This gradual decline in the MOI is largely due to the fact that the number of sales each week relative to the number of new listings, also referred to as the sales-to-new listings (SNL) ratio, has been trending up.
This does not mean that the housing market is suddenly hot again. It just means that over the past five weeks, in response to very soft home buying demand, the volume of new listings coming on the market has cooled relative to sales, pushing the SNL ratio up. In the case of houses, the SNL ratio reached its highest level this year.
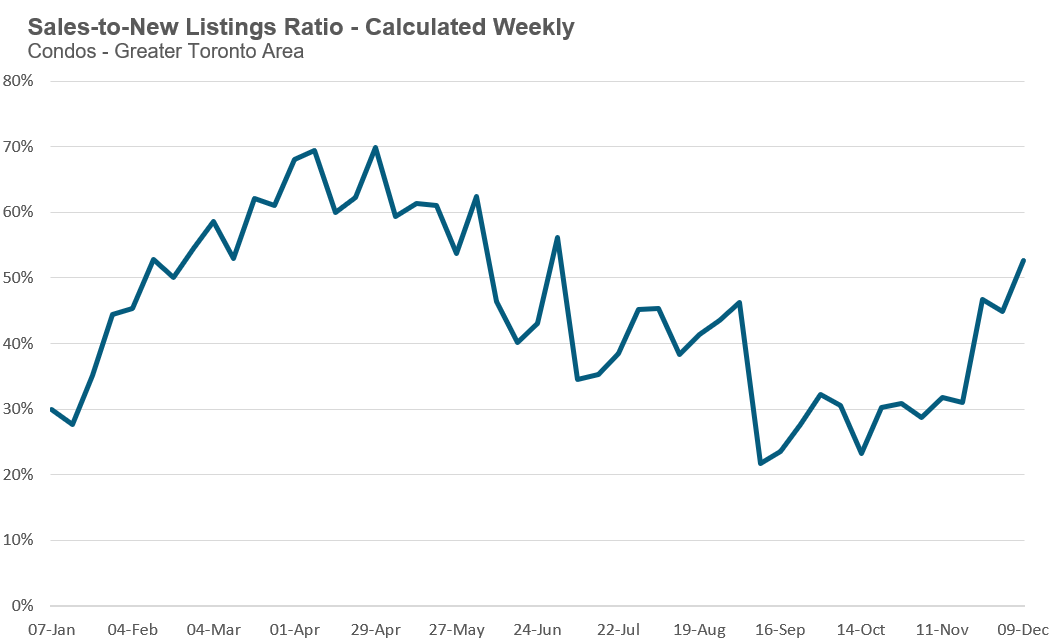
The condo market is seeing a similar trend, although the increase in the SNL ratio over the past five weeks is not as pronounced.
The other factor contributing to the decline in the MOI is the number of owners taking their homes off the market which has increased by roughly 56% over the same month last year. It’s worth noting that this increase is in line with the increase in active listings, which means the number of cancelled listings is roughly consistent with last year’s trend.
We do need to be cautious in interpreting these results, given that these trends only reflect five weeks of data. But as I noted above, this is not the direction we would have expected the market to go in as we move towards the holiday season. These numbers suggest that many sellers are deciding to pause and wait for what they hope will be a much busier 2024 housing market.
We’ll see if their hunch is right.
Houses
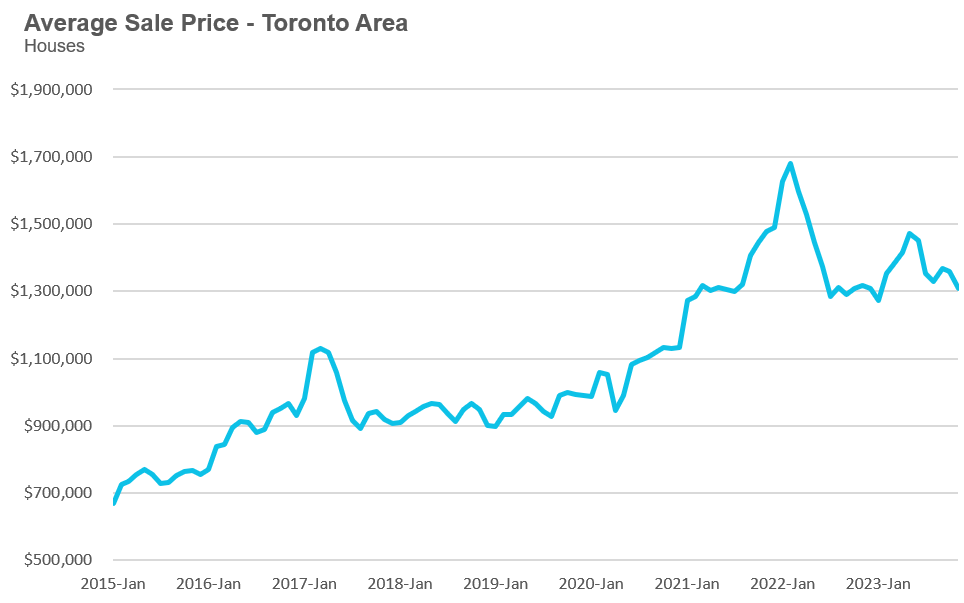
Year-over-year, the average price for a house in the Toronto area was $1,309,650 in November, down 1% over the same month last year. Last month's median house price was $1,140,000, also down 1% over last year.
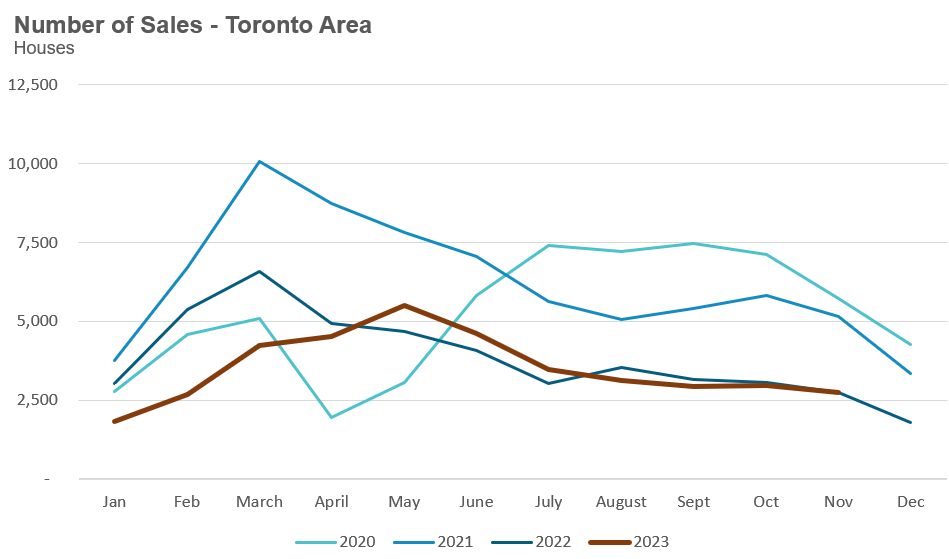
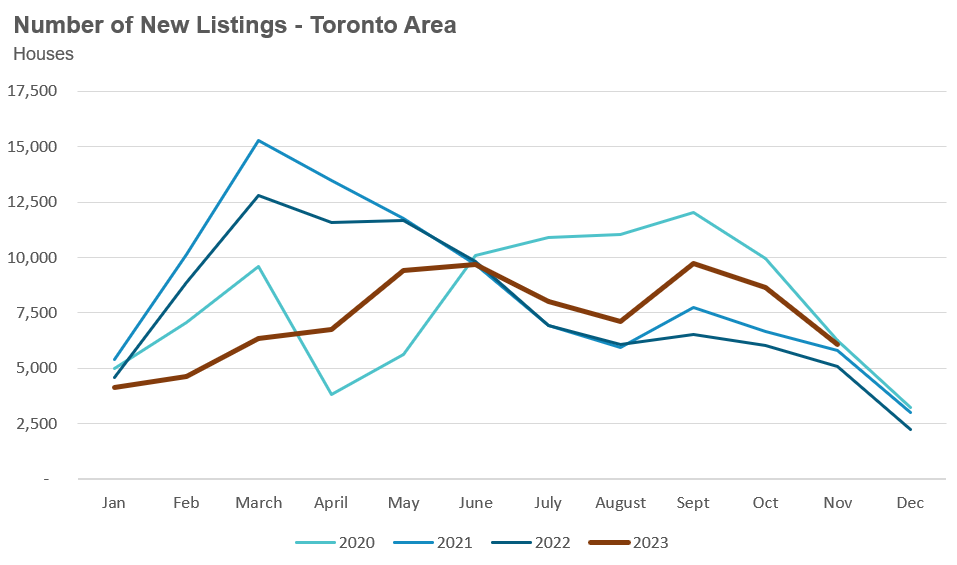
House sales in November were unchanged over last year while new house listings were up 22%.
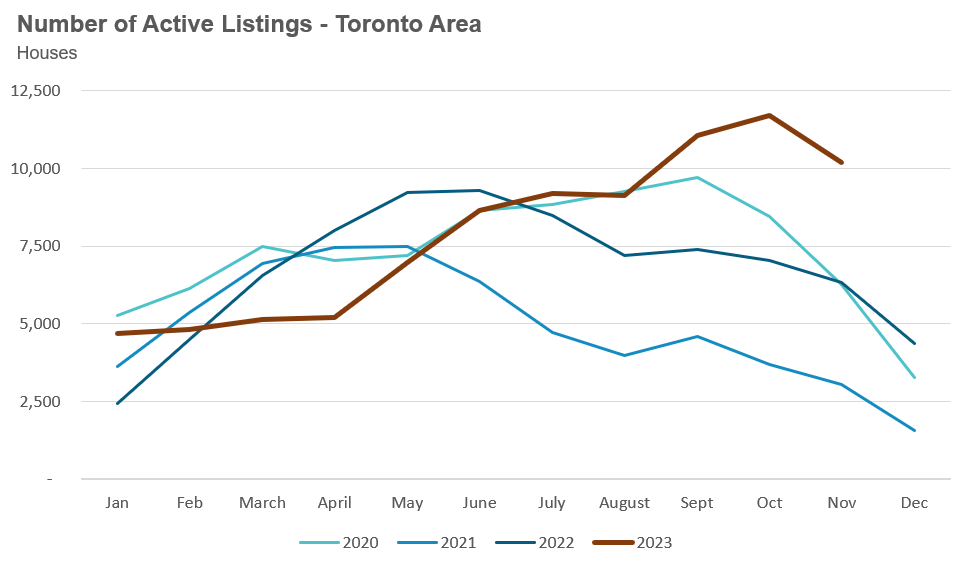
The number of houses available for sale at the end of the month, or active listings, was up 61% over last year.
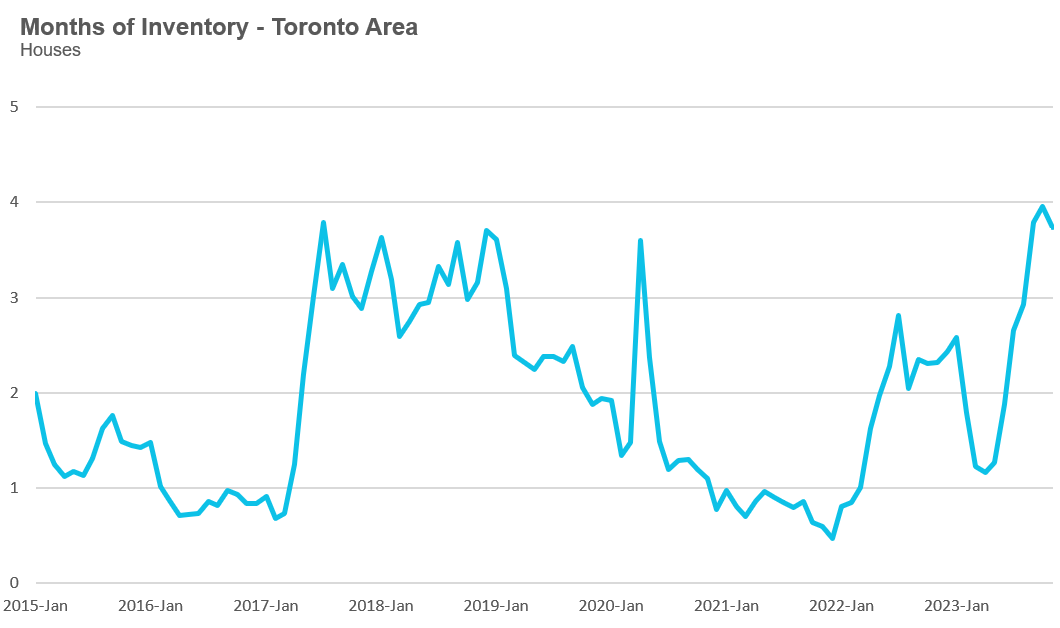
The current balance between supply and demand is reflected in the MOI, which is a measure of inventory relative to the number of sales each month.
In November, the MOI for houses fell slightly to 3.7.
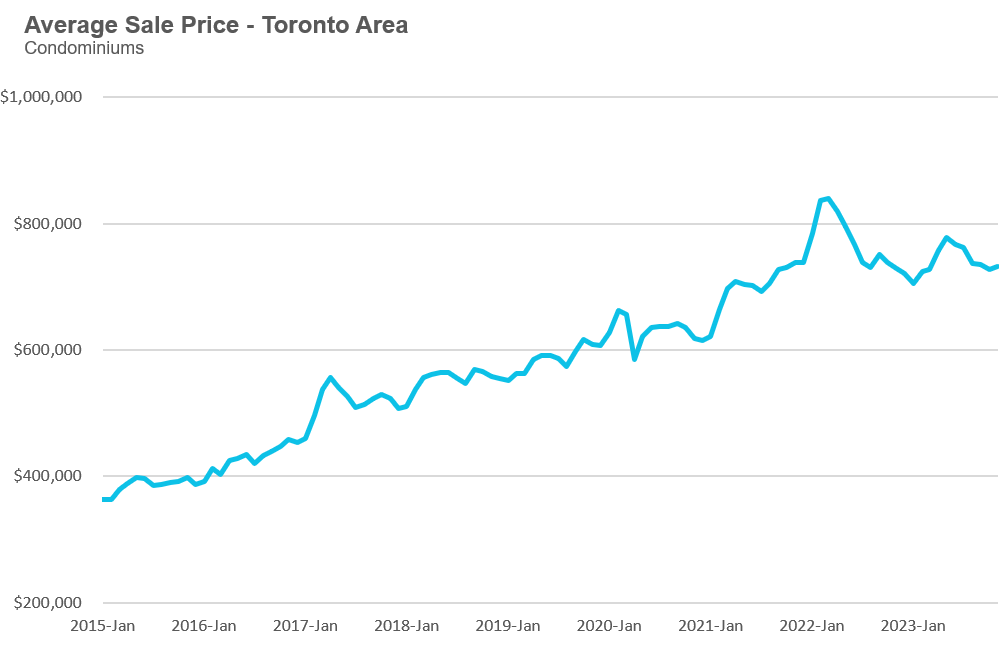
The average price for a condo in the Toronto Area was $731,734 in November, which is unchanged over last year. The median price for a condo in November was $650,000, also unchanged over last year.
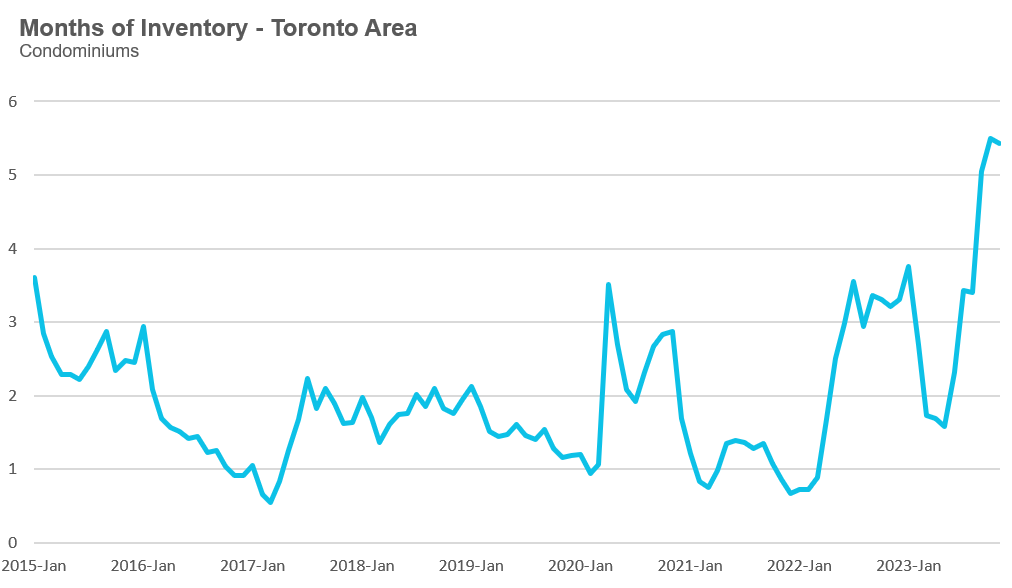
Condo sales in November were down 7% over last year, and new condo listings were up 26% over last year. The number of active condo listings was up 58% over last year. The MOI decreased slightly to 5.4.
For detailed monthly statistics for November 2023 for the entire Toronto area market, including house, condo and regional breakdowns, see the final section of this report.
“Like all countries, we’ve always had problems. Throughout Canada’s past, though, almost anyone who got a job could save up and buy a home by their mid-20s. When did all that change? About 8 years ago.”
- Pierre Poilievre
“This shouldn’t be a problem in Canada based on our supply-demand dynamics. Think about it, with our massive geography, meaning lots of supply and our small population, meaning limited demand, housing should be cheap here in Canada.”
- Pierre Poilievre
“What do you think is the most expensive thing that goes into a new house in say, Vancouver? Is it labour, lumber, land? Nope, government! A CD Howe study added up all the costs of labour materials, land and profit needed to build a home and compared it to the final sale price. In Vancouver, the gap was nearly $1.3M. That gap, or as I call it, the Gatekeeper Gap, is the cost of government permit delays, changing rules, pricey consultants, lawyers fees, charges and taxes etc.”
- Pierre Poilievre
While it is true that governments haven’t done all that could have been done to promote housing, what Poilievre isn’t saying is that the majority of the $1.3M he calls the “Gatekeeper Gap” is not government fees or delays, but rather the location value of the land in Vancouver.
The authors of the CD Howe report he cites make a number of questionable assumptions, including assuming that land value should not exceed 25% of the sum of physical construction costs and land required to build a home. In areas where land costs exceed 25%, the authors conclude that this additional land cost is all due to policies restricting housing supply and has nothing to do with the demand for housing in that geographic location.
This is part of the growing field of YIMBY economics that aims to blame municipal housing regulations as the single cause of high house prices and land values. It is true that up to recently most of Canada's cities have opposed new housing construction deemed to change the the character of existing neighbourhoods; only recently, Toronto and Vancouver have introduced major zoning changes to enable more housing to be built. But this doesn’t equal in $1.3M in extra cost.
But, though Poilievre makes little mention of it, the fact is that when it comes to demand for housing, location matters. Higher land values are often a product of higher demand for housing in specific geographic areas due to a number of factors, including the area's socio-economic characteristics. When you have more people fighting for a fixed supply of land in a geographic area, we would expect land values in that area to be higher, independent of the region's land-use policies. We would also expect areas with very high demand for housing to have more land-use regulations, such as greenbelt zoning, than areas with minimal demand.
As for the other government fees and taxes Poilievre blames, it’s worth noting that federal GST/HST adds to the cost of new housing but he didn’t take the opportunity promise to eliminate all federal taxes on new housing construction (in October, the Trudeau government announced a GST/HST rebate on new rental building).
What Pierre Would Do
So what is Poilievre’s “common sense” plan to solve Canada’s housing crisis?
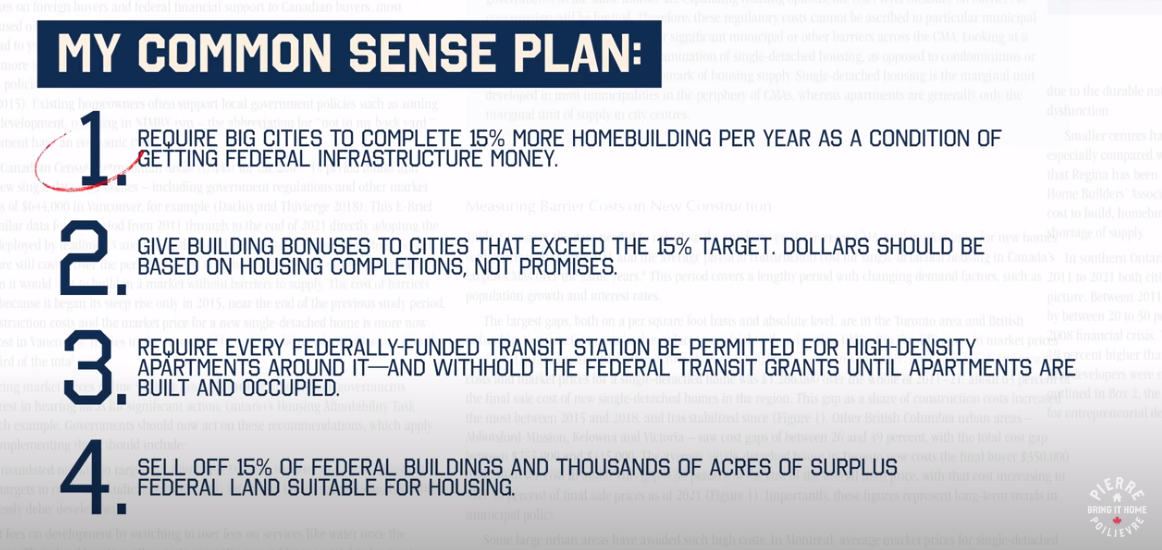
As we can see in his plan (see above), Poilievre says that the $4.5 billion that the federal government provides in infrastructure funding to municipalities each year should only be delivered to municipalities if the number of homes built in the city increases by 15% each year while also offering bonuses to municipalities that exceed this target.
He also insists that funds for federally-funded transit stations be delivered to municipalities after permitting the area for high-density housing around the station and after the housing is built and occupied.
This plan has obvious problems.
Firstly, municipalities often need to invest in new infrastructure before homes can be built, including water, sewage and other essential services. Withholding infrastructure transfers isn’t going to help municipalities deliver more housing; it may, in fact, delay their ability to build more homes.
As I wrote in my report last month, this is why municipalities are pushing back on the Ontario Ford government’s efforts to withhold funds in their own attempt to spur home-building.
The Ontario government created a $1.2B fund to offer a financial incentive to municipalities that reached at least 80% of their provincially assigned housing target. While many municipalities have argued they achieved their target based on the number of building permits they approved, the provincial government insists that their targets are based on housing starts (shovels in the ground) and not permits issued.
But cities rightfully are arguing that they cannot control when builders decide to start construction. Many builders are delaying new housing projects due to higher costs and the uncertain economic environment. Under Poilievre’s housing plan, the federal government will withhold infrastructure transfers if builders decide to scale back their housing starts for economic reasons.
As for requiring apartment buildings to be completely built around transit before funding such transit, this is a terrible approach to building great cities. By the time any such transit would be completed, all of those residents would have had to acquire cars or other means of transit to get anywhere, which is literally the opposite of how transit should be planned.
So Pierre’s housing plan is effectively a “do nothing plan.”
He wants his government to sit around, do nothing, and introduce no new federal housing policies while they wait for municipalities to solve this crisis independently.
None of this, of course, mentions that Polievere’s solution also depends on the benevolence of builders to build during an uncertain economic environment.
Pierre’s strong-man authoritarian leader tone, promising to punish municipalities for goals they don’t have complete control over, may sound great in a YouTube video, but something tells me it won’t lead to meaningful results.
While it is true that Poilievre’s rival, Trudeau, has also used federal funding control as a way to encourage building at the municipal level, there are some key differences with the latter’s approach. In creating an additional $4B housing accelerator fund to encourage municipalities to change their local policies to enable more housing supply, the federal government has guided municipalities on the types of housing policy reforms they would like to see to qualify for federal transfer from the housing accelerator fund — see Federal Minister of Housing Sean Fraser’s recent demand to Toronto mayor, Olivia Chow, that Toronto improve their plan in order to access $500M in funds.
The reader can decide on their own which approach might actually lead to more housing being built.
The Biggest Thing Pierre Doesn’t Say
The biggest problem with Poilievre’s housing plan is that he fails to identify the biggest driver of Canada’s boom in house prices, and that’s our booming population.
For years, Canadians have been told that our housing crisis is strictly due to a “lack of supply” caused by municipal zoning restrictions.
However, this sentiment among economists and the public has shifted as many now see that Canada’s decision under the Trudeau government to triple its population growth rate when they should have known that housing supply couldn’t keep up is a primary contributor to our housing crisis.
Since this is the one driver of our housing crisis that the federal government has direct control over, it’s very noteworthy that Poilievre doesn’t mention it or attack Trudeau on it at all.
Poilievre may have very good political reasons for this omission as he campaigns towards becoming Canada’s next PM, but it doesn’t make him at all coherent when it comes to putting forward a plan that might actually address Canada’s housing crisis.
Monthly Statistics
House sales (low-rise freehold detached, semi-detached, townhouse, etc.) in the Greater Toronto Area (GTA) in November 2023 were flat compared to the same month last year.
New house listings in November were up 22% over last year.
The number of houses available for sale (“active listings”) was up 61% in November compared to the same month last year.
The Months of Inventory ratio (MOI) looks at the number of homes available for sale in a given month divided by the number of homes sold in that month. It answers the following question: If no more homes came on the market for sale, how long would it take for all the existing homes on the market to sell, given the current level of demand? The higher the MOI, the cooler the market is. A balanced market (a market where prices are neither rising nor falling) is one where MOI is between four to six months. The lower the MOI, the more rapidly we would expect prices to rise.
While the current level of MOI gives us clues into how competitive the market is on-the-ground today, the direction it is moving in also gives us some clues into where the market may be heading.
The MOI for houses dipped slightly to 3.7 in November. The rapid increase in the MOI since May signalled a rapidly cooling down market, moving into a buyer’s market.
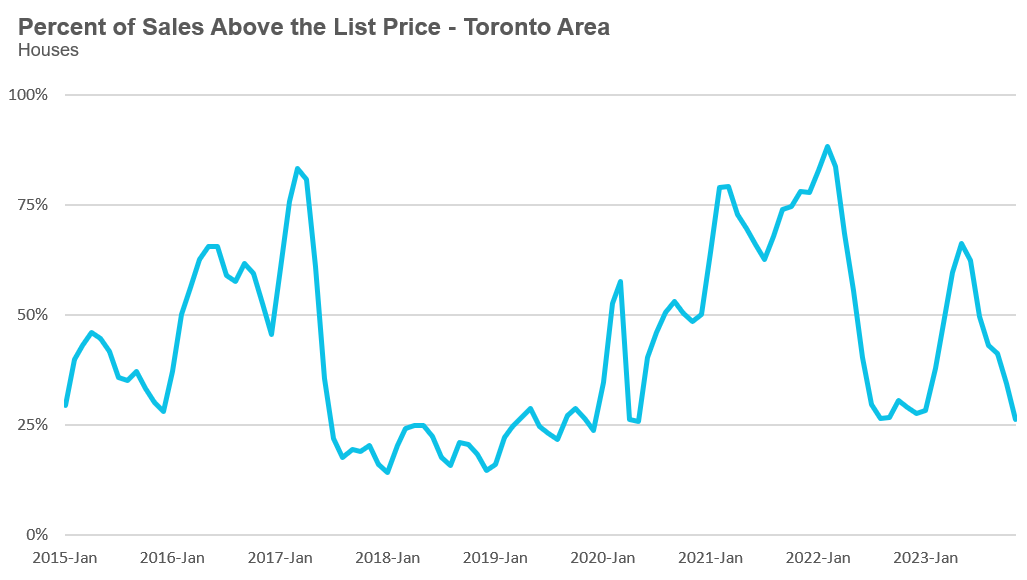
The share of houses selling for more than the owner’s list price decreased to 26% in November.
The average price for a house in November was $1,309,650 in November 2023, down 1% when compared to the same month last year.
The median house price in November was $1,140,000, down 1% over last year.
The median is calculated by ordering all the sale prices in a given month and then selecting the price that is at the midpoint of that list such that half of all home sales are above that price and half are below that price. Economists often prefer the median price over the average because it is less sensitive to big increases in the sale of high-end or low-end homes in a given month which can skew the average price.
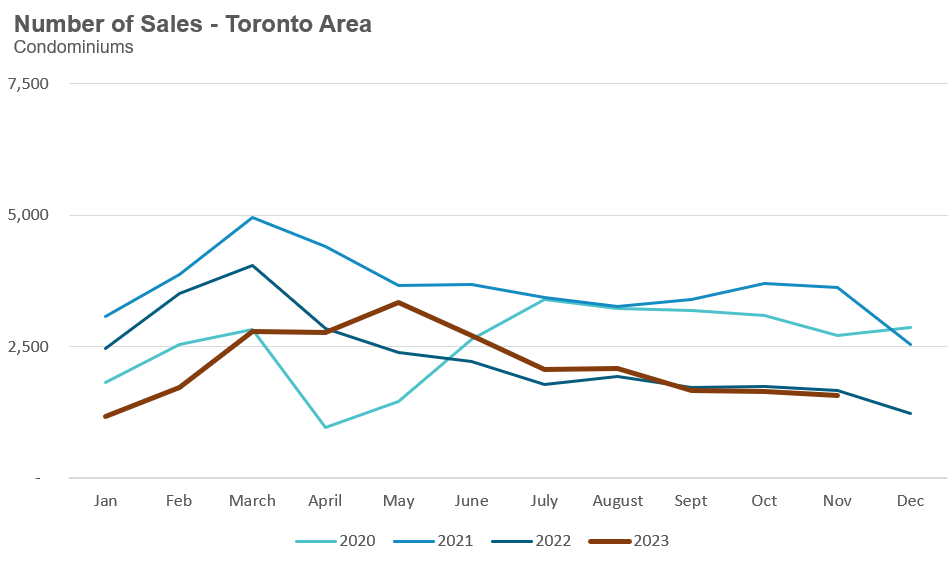
Condo (condominiums, including condo apartments, condo townhouses, etc.) sales in the Toronto area in November 2023 were down 7% over the same month last year.
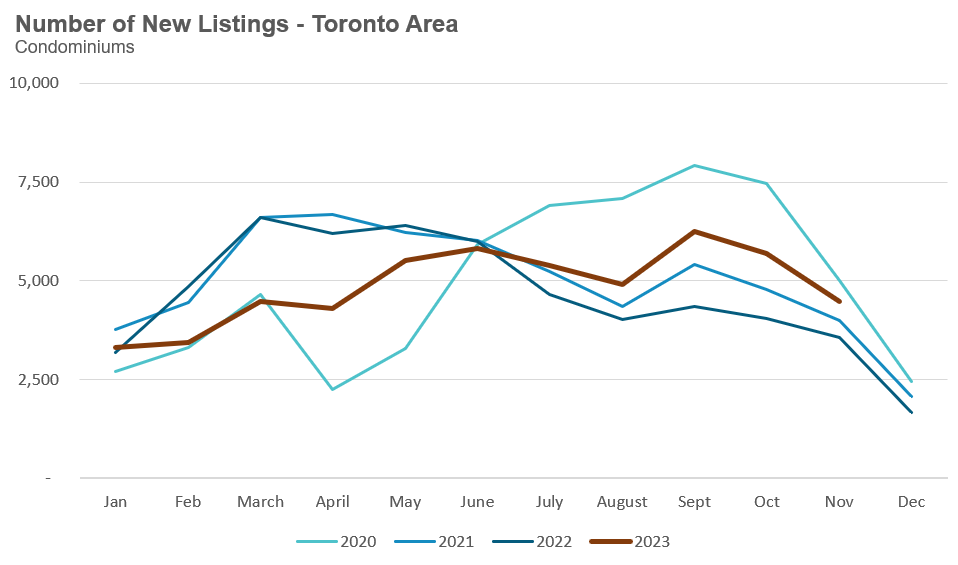
New condo listings were up 26% in November over last year.
The number of condos available for sale at the end of the month, or active listings, was up 58% over last year.
Condo months of inventory increased from 1.6 in May to 5.4 MOI in November, a sign that the condo market is rapidly cooling down.
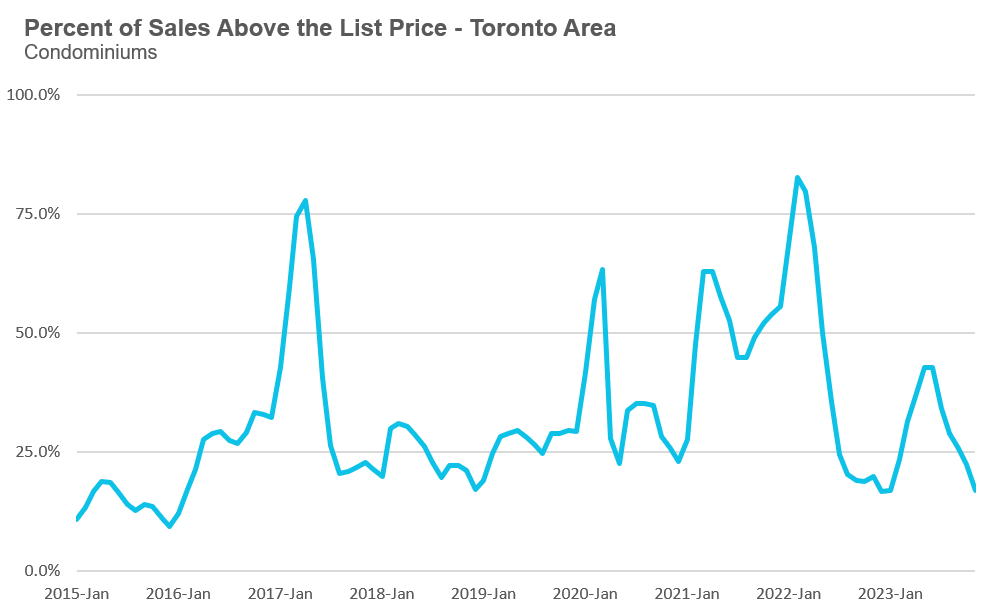
The share of condos selling for over the asking price declined to 17% in November.
The average price for a condo in November was $731,734, unchanged over last year. The median price for a condo in November was $650,000, down 2% over last year.
Houses
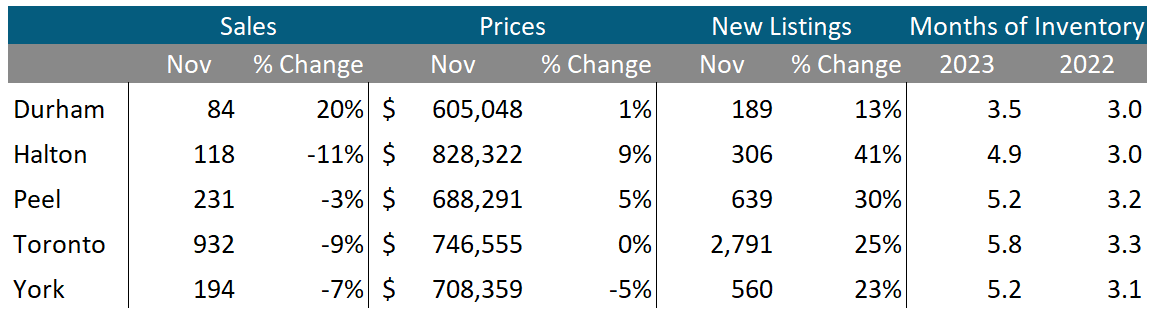
Average house prices were down in Halton, Peel and York regions and up slightly in Durham and Toronto. Sales were down and relatively flat over last year, while new listings were up across all five regions. The MOI is well above last year’s levels, suggesting the market for houses is cooler this year compared to last year.
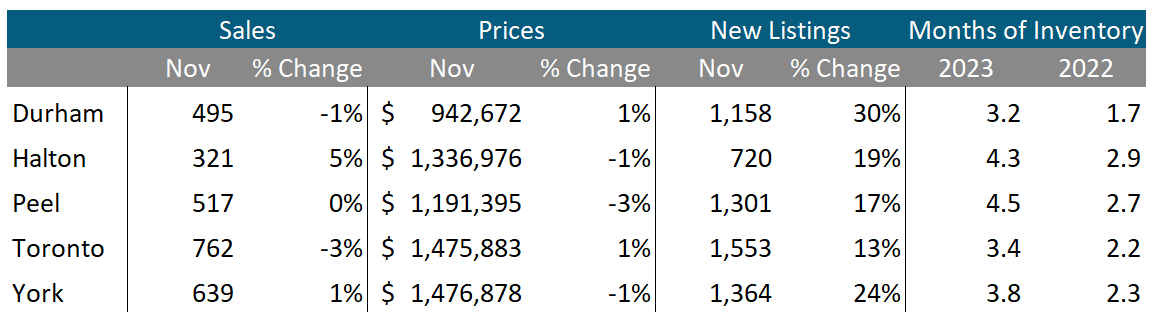
Condos
Condo sales were down in Halton, Peel, Toronto and York, while Durham saw sales increase over last year. Average prices were down in York, flat in Toronto and up in Durham, Halton and Peel. New listings are up significantly across the GTA. The MOI is above last year’s level, indicating a cooler market for condos this year.