

A recent note from CIBC argues that real estate investors cannot be blamed for high house prices. While this conclusion is technically valid, the real issues surrounding how investors impact the housing market are more nuanced.
When economists study housing markets, they first try to determine what factors are impacting house prices. If they observe a high share of investors in an area with rapidly rising house prices, they might assume that investors are causing the higher prices, in a relationship that looks like this:

For this reason, the CIBC conclusion that “it just isn’t clear that one can draw a cause and effect line from investor purchases to high housing costs for Canadians” is a reasonable one. But their statistical argument overlooks important issues when considering the role that investors play in the housing market.
In my April 2021 report, I argued that policy makers should consider macro-prudential policy measures that either make it harder or less lucrative for investors to invest in single family homes. I did not suggest this because I believe investors are the only cause for high house prices or because I think their effect on the housing market is inherently bad — investors have played an important role in adding rental supply to the GTA’s housing market.
My suggestion is instead aimed at mitigating the outsized negative impact investors can have on a market once it starts to see price declines — an issue that MIT economist Alp Simsek discusses here.
At the heart of Simsek’s argument is the idea that average home buyers and real estate investors have very different (heterogeneous) beliefs about the future direction of the housing market, which affects their behaviours and leads to very different market outcomes.
When prices are rising, real estate investors are more optimistic that prices will keep rising rapidly in the future which is why investors are typically willing to pay more for a property than an end user. Investors are often so optimistic they’ll buy a property with a negative cash flow (where the income isn’t high enough to cover expenses and debt payments) simply because they believe house prices will be higher tomorrow, something I’ve written about often.
From CIBC’s report:
"Our prior research found that Toronto area rents provide slim or even negative net cash flows to leveraged investors. Capital gains must therefore be their motivation, and climbing prices could be read by some as a sign of more to come."
But the optimistic real estate investors also tend to be the most leveraged, that is, they use a lot of borrowed money to make their investments, which means they feel the effects of a decline in prices far more than an end user. And it’s during a down market that beliefs about the future direction of the housing market suddenly flip. The optimistic investor suddenly becomes the pessimistic investor eager to exit the market to mitigate the risk of a further decline in home prices and hits to their balance sheet:
As Simsek notes:
"Now these guys will get disproportionately hit, because they were the ones loading up onto the risk in good times, so when the bad times come, their wealth share now will collapse disproportionately, and this means that now the swings on the downside will be much bigger because now a lot of the wealth is in the hands of the pessimists. So they will be the ones that are basically pricing risky assets like houses. So that's actually going to generate a downward swing the other direction. So this makes the asset boom bust cycle much bigger than it would otherwise be."
Toronto saw an investor driven boom in 2016/17 that saw a rapid acceleration in the price of suburban detached homes (which I identified in my report Freeholds on Fire). The decline in prices that followed was also largely limited to the segment of the market where investors dominated - suburban homes.
Today, optimistic investors are not fuelling the resale house market, but the market for pre-construction condominiums (pre-con condos), where units are now selling for nearly 40% more than the average resale condo in the central Toronto (old City of Toronto boundaries).
“Even with the recent bounce back in resale prices to above $1,000 psf in the former City of Toronto, new condominium prices remain at a record high premium of approximately $400 psf — more than double the 10-year year average.”
-
Anyone following the latest headlines about Toronto’s housing market, and my own updates on Twitter, has by now heard that Toronto’s housing market is showing signs of cooling. But I appreciate that these types of headlines can leave many buyers confused about what “cooling” really means.
Active buyers who are still seeing 10+ offers on the homes they are bidding on are certainly not feeling any ‘cooling’. Buyers considering entering the market are wondering if a cooling market means prices will fall in the near future, like right after they’ve bought (i.e., the dreaded ‘buying at the peak’ problem).
The best way to make sense of this cooling trend is to think of the housing market as a car that was driving at over 200 km/h in March, but has now decelerated to a more reasonable 120 km/h in June. The market is still moving quickly, but not as out-of-control as it was months ago.
We can see these changes by looking at changes in a couple of metrics between March and June.
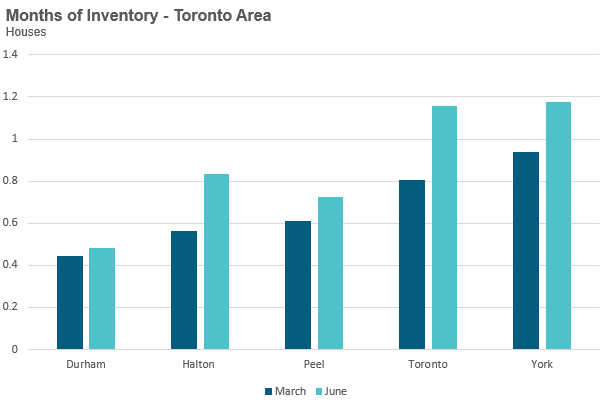
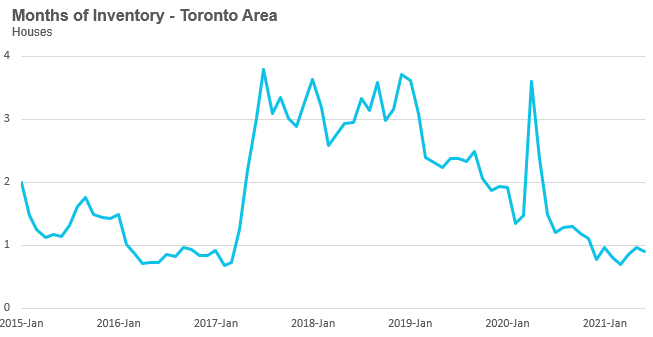
The months of inventory (MOI) gives us a good measure of how hot the market is at any given point in time - the lower the inventory the hotter the market.
An MOI between 4-6 months is generally considered a “balanced market” with anything below 3, a hot seller’s market.
MOI for houses was below 1 month for all five municipalities in March, a sign of an overheating housing market. Inventory levels have increased slightly since then, but still remain in seller’s market territory.
Next, we can see a bigger shift in the MOI between March and June in the condo market, in particular in Peel, Toronto and York Region.
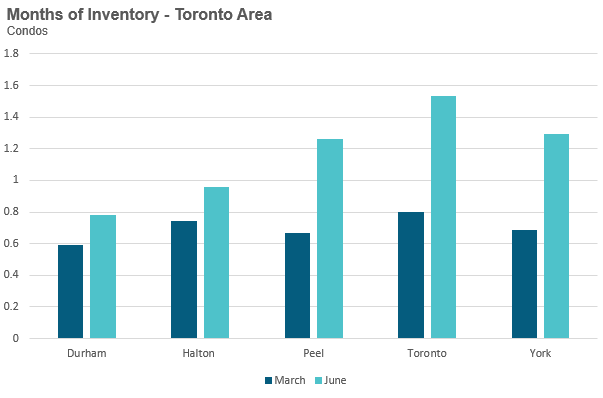
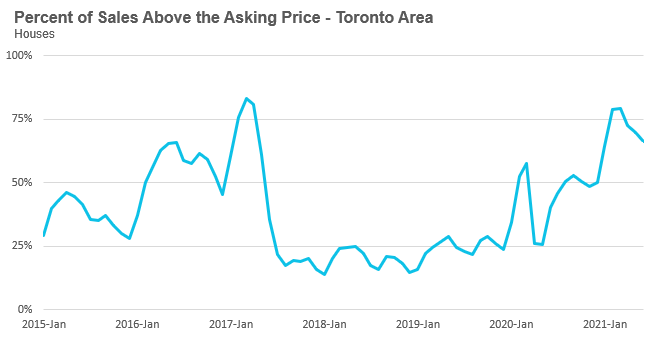
While the GTA’s housing market is still in seller’s market territory, this slight increase in inventory since March has taken some of the heat out of the market. Houses and condos for sale are seeing fewer showings and fewer offers on their offer nights. We are also seeing a decline in the number of homes selling for more than the owner’s asking price in both segments.
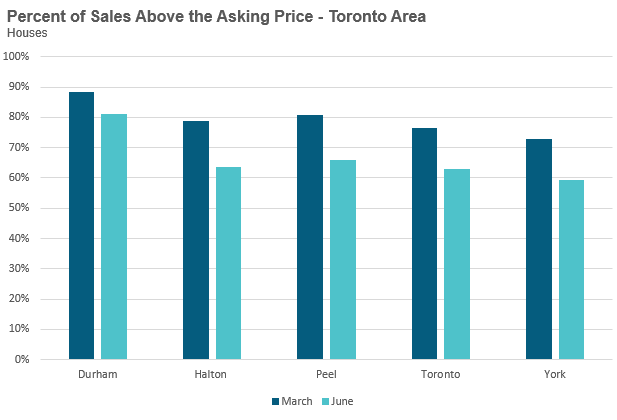
A decline in the number of homes selling for over the asking price means an increase in those selling for under the seller’s list price, bringing the average down. We are also seeing an increase in the number of homes selling with a con- dition on financing or home inspection, something that was rare back in March.
This cooling trend we are seeing today is a seasonal trend we typically see as we move into the summer months of July and August. The market usually cools in the summer as many active buyers hit pause on their search to take a summer break. Many of these buyers jump back into their home search in September.
What the fall market will look like will largely depend on how many new buyers enter the market and the volume of homes listed for sale. While it’s impossible to predict these trends, my instinct is that we’re likely to see the market continue to moderate for the remainder of the year.
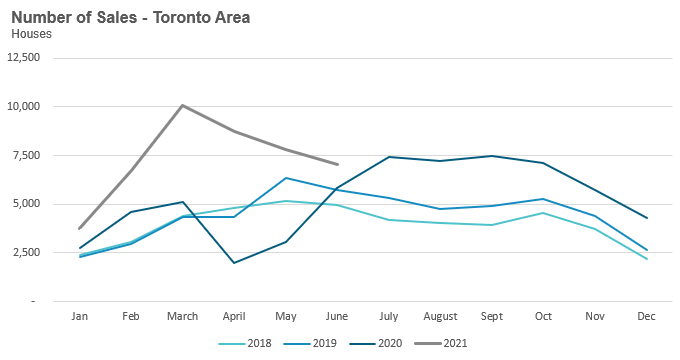
House sales (detached, semi-detached, townhouse, etc.) in the Toronto area in June 2021 were up 22% over the same month last year.
Year-over-year comparisons in April and May were misleadingly inflated due to the dramatic drop in sales in April and May of the previous year due to the first round of COVID-19 lockdowns. But last June 2020 was the first month we saw an increase in buyers re-entering the market after the first round of lockdowns- so year-over-year comparisons will be more relevant going forward.
However, there is still one more COVID effect to account for as we continue to move into the summer months of July and August, when I expect to see sales begin to decline on a year-over-year basis as our comparison will be against a period of inflated home sales in 2020 caused by the demand shock of buyers rushing back into the market after the first COVID-induced lockdown.
We can also see this declining trend in house sales by looking at the change on a month-over-month basis. Sales have been declining each month since peaking in March 2021.
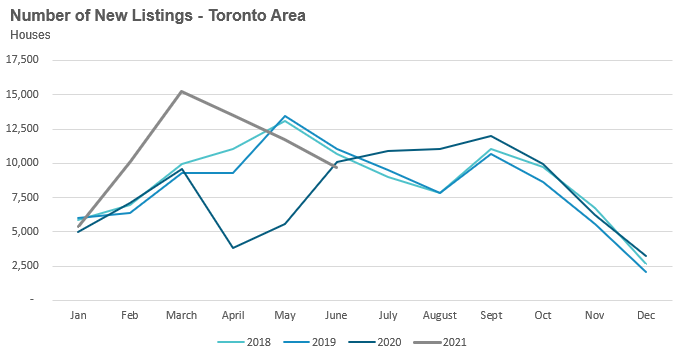
New listings in June were down 4% over last year, and much like the sales num- bers, new listings are also showing a month-over-month decline since March.
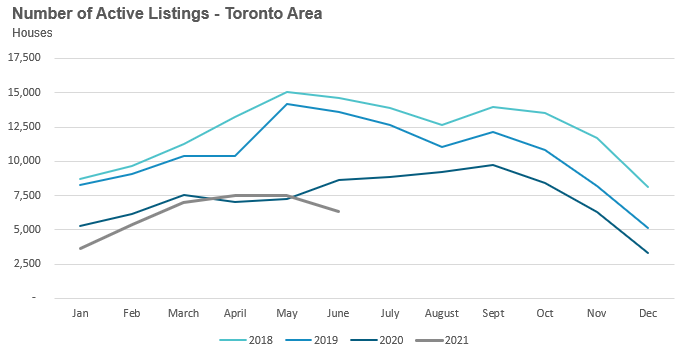
The number of houses available for sale (“active listings”) was down 27% when compared to the same month last year and more than 50% below the inventory levels seen in 2018 and 2019.
The Months of Inventory ratio (MOI) looks at the number of homes available for sale in a given month divided by the number of homes that sold in that month. It answers the following question: If no more homes came on the market for sale, how long would it take for all the existing homes on the market to sell given the current level of demand?
The higher the MOI, the cooler the market is. A balanced market (a market where prices are neither rising nor falling) is one where MOI is between four to six months. The lower the MOI, the more rapidly we would expect prices to rise.
This June, the market remained very competitive with an MOI of just under 1.
While the current level of MOI gives us clues into how competitive the market is on the ground today, the direction it is moving in also gives us some clues into where the market may be heading. The MOI has remained relatively stable at or below 1 MOI for the past eight months.
The share of houses selling for more than the owner’s asking price dropped from 79% in March to 66% in June. While this figure still suggests a very hot and competitive market, at my brokerage, Realosophy Realty, we are finding that the number of offers that houses are receiving on their offer nights has declined significantly, and that in many cases houses may only get one offer; however, a house priced lower to encourage multiple offers will still likely sell for more than the owner’s asking price because the buyer knows that the asking price does not reflect the actual market value of the house and will make their bids accordingly.
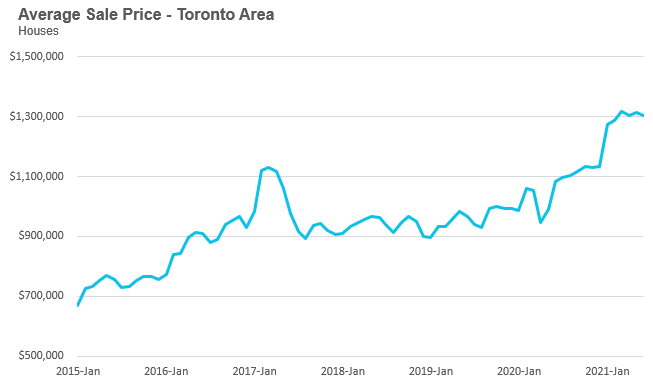
The average house price in June was $1,305,092 while the median was $1,140,500, up 21% and 26% respectively over last year.
While average house prices are up significantly over last year, house prices have plateaued in 2021 with average prices remaining relatively constant in the $1.3M range since the start of the year.
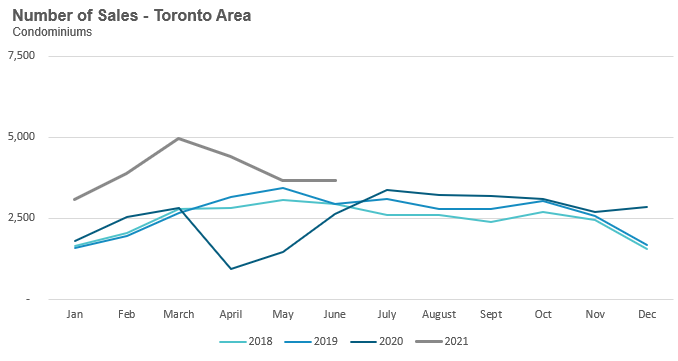
Condominium (condo) sales (condo apartments, condo townhouses, etc.) in June were up by 49% over last year. Unlike house sales, condo sales were flat on a month-over-month basis between May and June.
New condo listings were up by 2% in June 2021 over last year. Unlike the market for houses, the condo market is not seeing a dramatic month-over-month decline in new listings since March which is helping push the number of active listings up.
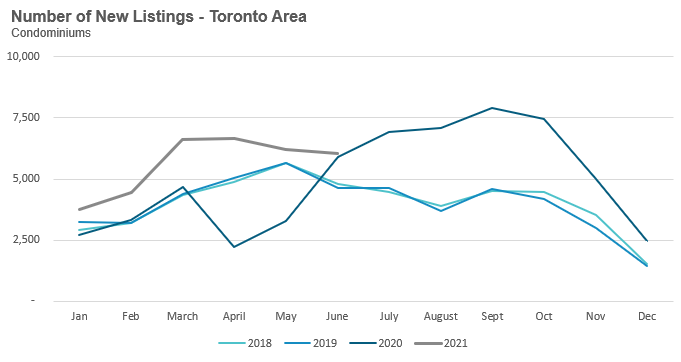
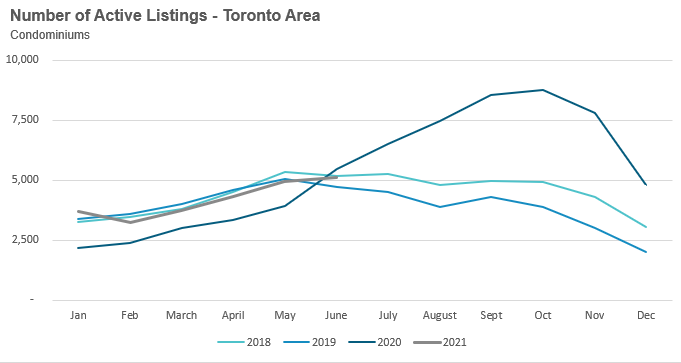
The number of condos available for sale at the end of the month, or active listings, was down 7% over last year but has been trending up since February and is inline with levels seen in 2018 and 2019.
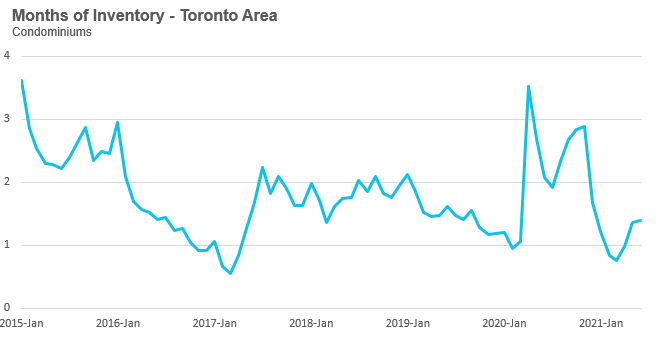
The strong volume of new listings (supply) helped keep the MOI at 1.4 for the month of June, up from 0.8 MOI in March.
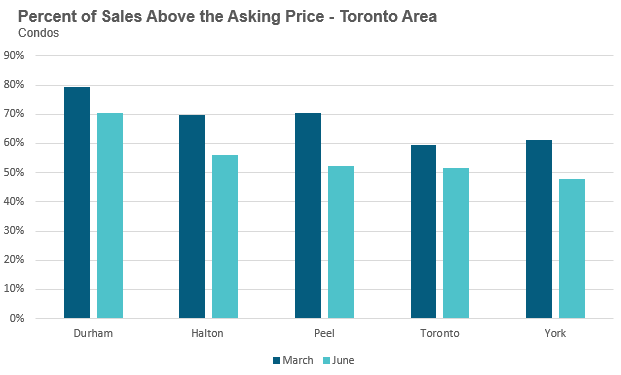
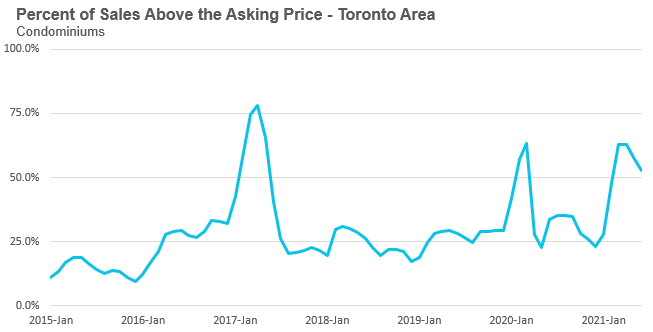
The competition for condos is easing slightly with the share of condos selling for over the asking price falling from 63% in April to 53% in June.
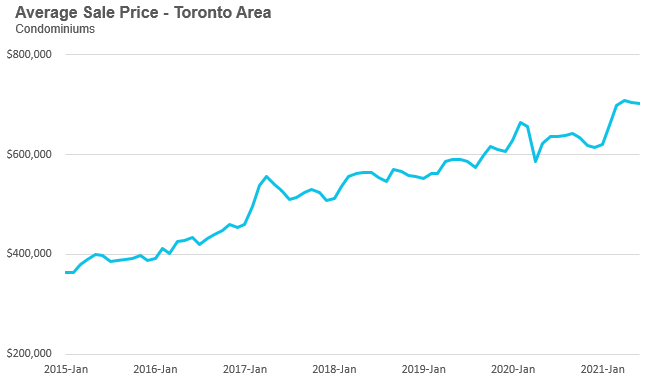
The average condo price in June was $701,730 while the median was $640,000, up 10% and 9% respectively over last year.
Average condo prices were in the low $600K range during the fourth quarter of 2020 and after a rapid acceleration during the first quarter of 2021 to approximately $700K, now appear to be plateauing.
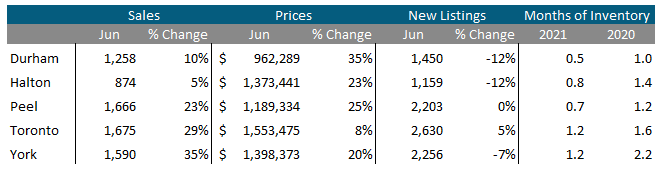
Houses
Sales across all five regions in the GTA were up in June as were average prices. Despite the increase in new listings, MOI is at 1 or below 1 across the entire GTA, indicating a strong seller’s market.
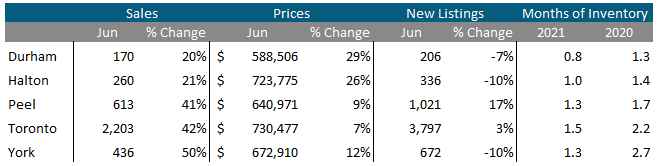
Condos
The surge in condos sales continued in June across the entire GTA. Average prices were up across the suburban regions, along with the City of Toronto. Also indicative of strong market conditions, current MOI levels are below last year’s levels for all five regions.
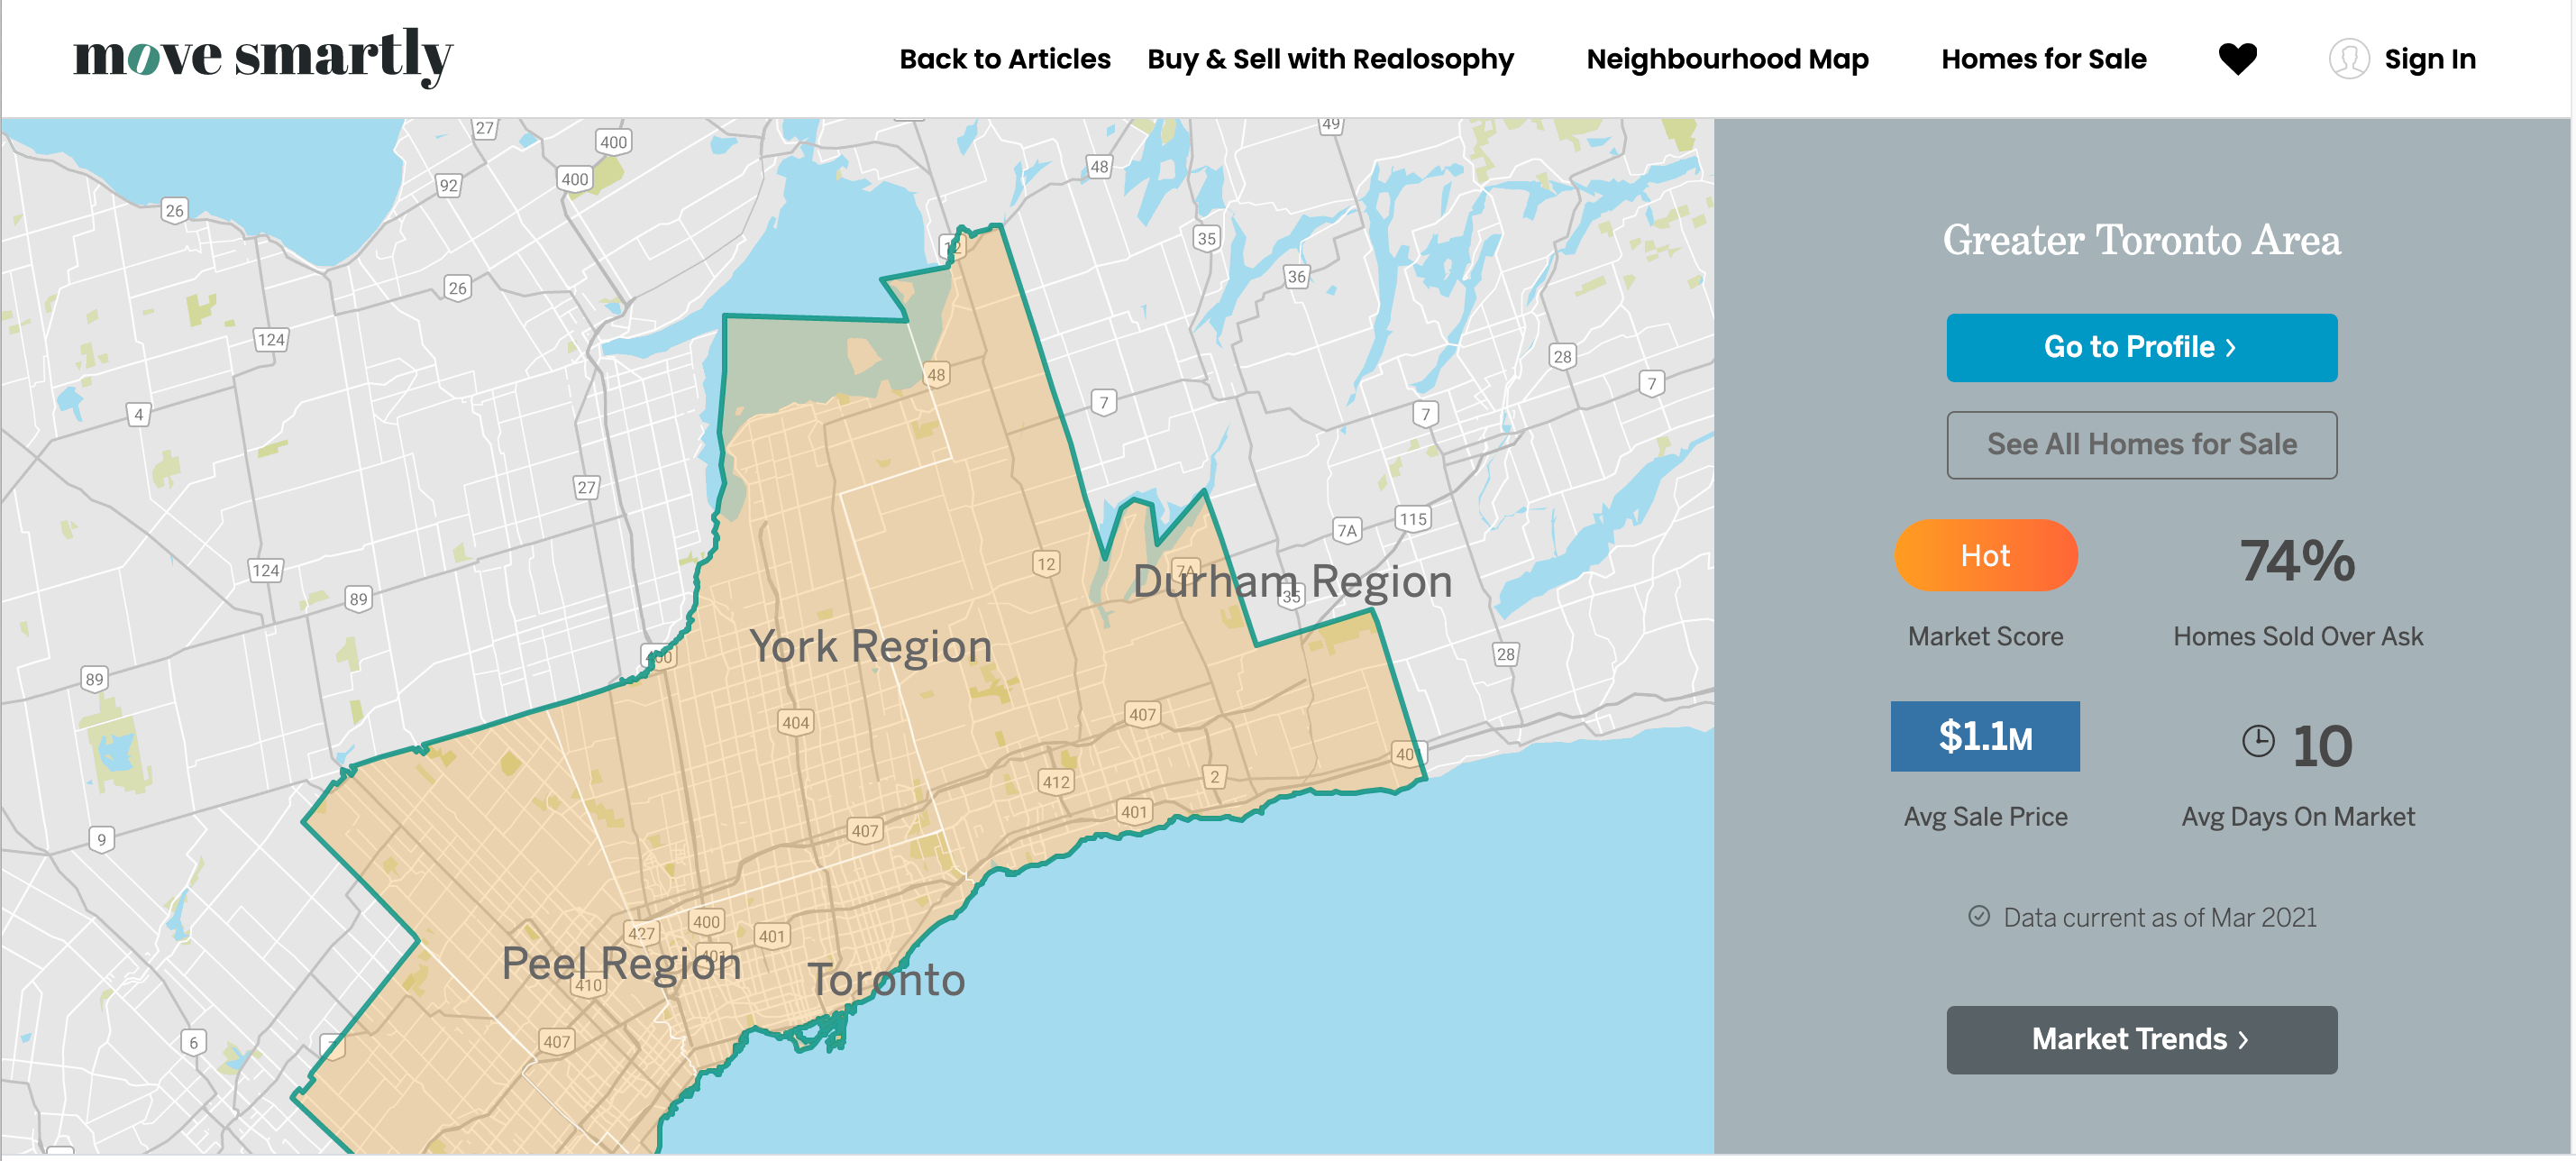
Greater Toronto Area Market Trends
All Market Performance by Neighbourhood Map, Toronto and the GTA
GET MORE DATA
The Move Smartly monthly market report is powered by Realosophy Realty. Get the same up-to-date Toronto area market information on realosophy.com plus additional information on every home for sale, including building permit history, environmental alerts and more when you buy a home with Realosophy Realty.
