Looking at our most recent statistics for the Toronto area market, we see a continuation of the downturn we saw last month.
House sales in June are down 42% over last year and down slightly when compared to last month.
The average price for a house in June was $1,373,325 down from the most recent peak of $1,679,429 in February, but up 5% over last year; the median house price in June was $1,200,000, down from $1,485,000 in February, but up 5% over last year.
New house listings were up 1% compared to last year, but well below previous years, while the number of houses available for sale at the end of the month, or active listings, at the end of June was up 46% over last year.
Condo sales were down 40% in June over last year and below pre-Covid sales volumes for the month.
The average price for a condo in June fell to $766,839, down from $840,444 in March, the most recent peak. The average price is up 9% over last year. The median price for a condo in June was $705,000, up 10% over last year, but down from $777,000.
New condo listings were down 1% over last year, and ahead of typical new listing volume for the month. The number of active listings for condos was up 30% over last year.
For detailed monthly statistics for the Toronto Area, including house, condo and regional breakdowns, see the final section of this report.

The Greater Toronto Area (GTA)’s housing market continued to cool in June due to a big decline in the number of active buyers in the market, a trend we’re able to see on the ground.
Four months ago, when agents would list a home for sale they would get anywhere from 30 to 100 buyers viewing it the first week on the market. Today, sellers are lucky to get ten viewings for their first week.
The nicest homes of course are still getting a lot of interest, and many of those are still getting multiple offers on their offer nights. But even with these homes, offer prices are far more conservative than in earlier months and final sale prices are generally still below the price sellers would have received back in February.
While the average price of a low-rise house in June was down 18% from the peak in February, this slightly underestimates the rate of change as prices have been trending down each week: when we compare the most recent weekly average price to the February peak, average prices are down 22%.
One interesting fact is that even though home sales have hit a 20-year low for the second month in a row, the inventory of homes available for sale is still relatively low at just over two months of inventory (MOI) for low-rise houses and 3 months for condos so we are not yet seeing the rapidly rising inventories we might normally expect in a slowing market.
The relatively low level of inventory is likely a function of two factors. Firstly, our starting point in terms of active listings was very low in February and it takes the market some time to see inventory build up - the GTA had just under 1 MOI in March.
But more importantly, in a slowing market, it’s relatively common to see some sellers speed up the sale of their home if they’re worried prices are going to fall further in the future. Home owners who are planning on moving in the year ahead would normally list their home sooner than they originally planned to try to sell at a price that is closer to the peak and to avoid any future decline in prices. Investors also exit the market at a faster rate at the first sign of a decline to maximize their profit and potentially re-enter the market at a lower price.
But we haven’t seen these trends materialize on the ground yet, and in fact the volume of new listings coming on the market, in particular for low-rise houses, is below pre-Covid levels for the month of June. So at this point, it appears as though homeowners and investors are not rushing to sell. We’ll see if that changes as rates continue to rise — and if prices continue to fall — in the second half of this year.
“Inflation is a persistent rise the in the average level of prices over time.”
- The Bank of Canada
Prices typically rise over time, but the BOC’s goal is to have prices rising in a range between 1 to 3%. But we all know that the cost of the things we buy and consume, from food to gasoline, have been rising far more rapidly than 1 to 3%.
The BOC measure of inflation shows that prices are rising closer to 8% per year, and some experts even think this estimate is low.
So why is a high inflation rate bad?
For households, it means that the monthly paycheque doesn’t go as far in covering living expenses and without a rise in income, this can strain household finances.
But inflation is also a big problem for businesses. When inflation is stable, say at around 2%, which is the BOC target, it’s a lot easier for businesses to forecast future costs. But when inflation is high and volatile, it makes it a lot harder for businesses to make investments today without clarity around tomorrow’s costs.
Here’s a chart showing the Consumer Price Index (CPI) which is the measure the Bank of Canada uses to measure inflation:
X
The last time inflation was this high was in the early 90s, but one big difference from then is the speed and magnitude of the change in inflation today.
In the early 90s, the inflation rate went from 4% to 7% in just under a year. Today, we’ve gone from an inflation rate of 1% to over 7% in just over one year, a much greater rate of change.
Also contributing to today’s inflation rate are global events that are out of the BOC’s control, such as the war in Ukraine, which has resulted in elevated gas and food prices..
How Higher Interest Rates Impact Us
So how does the BOC lower the inflation rate?
The BOC’s main policy tool is their policy rate, also called the overnight rate. This is the rate that variable rate mortgages are based on, which means that as the policy rate increases so does the interest rate on your variable rate mortgage. (These rate increases, through their impact on bond markets, also indirectly affect new and renewing fixed rate mortgages.)
The BOC’s policy rate was 0.25% in March and at the time of writing this report in early July 2022, it has been raised to 1.5%, with most economists expecting it to increase another .75% at their next policy meeting in mid-July, and potentially reaching as high as 3% by the end of the year.
So how does raising interest rates cool inflation?
Rapidly rising prices are due to an imbalance between supply and demand, or too much demand chasing too few goods. As the BOC’s policy rate can’t do much on the supply front (i.e., to produce more oil or more food), it is utilized to impact demand.
As interest rates increase, people eventually start spending less. A household that was planning to borrow $100K from their home equity line of credit to renovate their house may put that on hold if they would have to pay a much higher interest to pay that money back. As people start spending less, this takes demand out of the market and should help ease the inflation rate over time.
But it’s not just households who spend less - businesses also scale back investments because the cost to borrow funds to finance investments is high, but also because the high inflation rate makes it hard to forecast future costs.
This combination of reduced consumer and business activity is why periods of high interest rates and high inflation can lead to recessions, which can lead to further economic downturns and even job losses.
Why High Household Debt Matters
In the Bank of Canada’s June 2022 Financial System Review, they highlighted six vulnerabilities in the financial system and at the top of that list was “elevated level of household indebtedness.”
(Side note: For anyone who is interested in learning more about the current macroeconomic environment in Canada, I would recommend reading the Bank of Canada’s Financial System Review, which offers a brief but very detailed summary written in plain language.)
High household debt is a significant risk when interest rates are rising rapidly because the costs to service (or payback) our debt rises with interest rates. As this usually happens while inflation is also very high, this additional debt expense comes at a time when the cost of all other household expenses is also rising.
One of the Bank of Canada’s concerns is understanding if highly indebted households can continue servicing their debt as rates increase without significantly reducing their household spending/consumption and that these households are also far more likely to face financial difficulties if there is a shock to their income due to job loss.
How These Factors Impact Our Market
As discussed, the future path of home prices is largely determined by interest rates.
Let’s look at how changes in interest rates impact a household’s mortgage payments:
As rates increase, households can’t spend as much as they did a year ago to buy a home because their monthly mortgage payments would be much higher so to stay in the market, they would have to reduce their budget for buying a home, resulting in downward pressure on home prices.
The second thing to keep in mind is that the future path of interest rates is largely going to depend on the inflation rate. If the inflation rate remains high then the BOC will keep interest rates high. Changes to the policy rate will also depend on current economic conditions, but even if we find ourselves in a recession a year from now, the BOC will have a hard time lowering rates to stimulate the economy if inflation remains elevated.
And finally, if high inflation and high interest rates are with us for an extended period of time this may begin to strain highly indebted households, especially if households see a shock to their income due to a recession.
So these are just some of the macroeconomic factors that will likely impact the future path of home prices over the next 12-24 months. But while these macro factors help us understand the broader trends that might impact the housing market, real estate trends are very local.
When thinking about how stable or unstable prices are over the next 12+ months, these trends will likely be very different depending on the type of home and neighbourhood you’re considering buying or selling in.
It will be important to really understand these very local micro trends in the neighbourhoods you’re most interested in - and I’ll be touching on this topic in future reports.
“If you’ve got a mortgage, if you’re considering making a major purchase, or you’re a business and you’re considering making an investment, you can be confident rates will be low for a long time.”
- Tiff Macklem, Bank of Canada Governor
“In an environment of low mortgage rates and rapid increases in house prices, expectations of a large capital gain can make houses an attractive asset for investors. For the purpose of this analysis, investors are defined as existing mortgage holders who obtain an additional mortgage to purchase a property. In 2021, they made purchases at a faster pace than first-time or repeat homebuyers.”
- Bank of Canada, Financial System Review, June 2022
“Part of the exceptional increase in house prices observed since the start of the pandemic may have reflected extrapolative price expectations. This happens when people come to expect that house prices will rise in the future simply because they have risen in the past. In such a situation, homebuyers may rush into the market out of fear of missing out or may hope to realize a sizable capital gain.”
- Bank of Canada
The Canada Mortgage and Housing Corporation (CMHC) released a report last month that measured how many more new homes need to be built to solve Canada’s housing affordability crisis by 2030.
CMHC’s analysis found that in order for Ontario to keep up with our booming population over the next nine years, and return prices to what they refer to as “Maximum Affordable Price Level,” which CMHC defined as 40% of disposable income level, Ontario needs to build 1.85M homes over and above the 700K+ homes already in our new housing pipeline.
Economist Mike Moffatt summarized CMHC’s proposed solution to housing affordability nicely:
In short, CMHC believes that the solution to housing affordability in Ontario is for the province to increase new housing completions from roughly 68,000 homes per year to 291,000 homes per year over the next nine years.
The chart below shows Ontario’s annual housing completions since 1990 in blue and the number of completions that would be required to achieve CMHC’s target completions in Ontario assuming a constant growth rate for housing completions.
There are a number of things that stand out in CMHC’s report.
Firstly, it’s plainly obvious that CMHC’s “solution” to housing affordability, increasing housing completions by 4X over the next 9 years is not a realistic solution.
But even more troubling than the fact that this is not achievable is that CMHC actually suggests that this is in fact an achievable goal if everyone “works together” to change current practices.
“The size of the number should make all of us who form part of the housing system realize that we have a large task in front of us. We need to work together—and change current practices —to meet this challenge.”
- Canada Mortgage and Housing Corporation
“Increasing the number of permanent immigrants beyond expected trends means that more housing will need to be built to accommodate them. This also presents challenges for the timing of bringing those dwellings – whether to own or rent – to market. Whereas increasing immigrant numbers can be done quickly, the time it takes to approve and build new housing takes years.”
- Canada Mortgage and Housing Corporation
As CMHC correctly points out, increasing the number of homes Canada builds is significantly harder than raising immigration numbers. A responsible government would have done the hard work of increasing our supply of new housing first before raising immigration targets to ensure housing is affordable for new Canadians moving here.
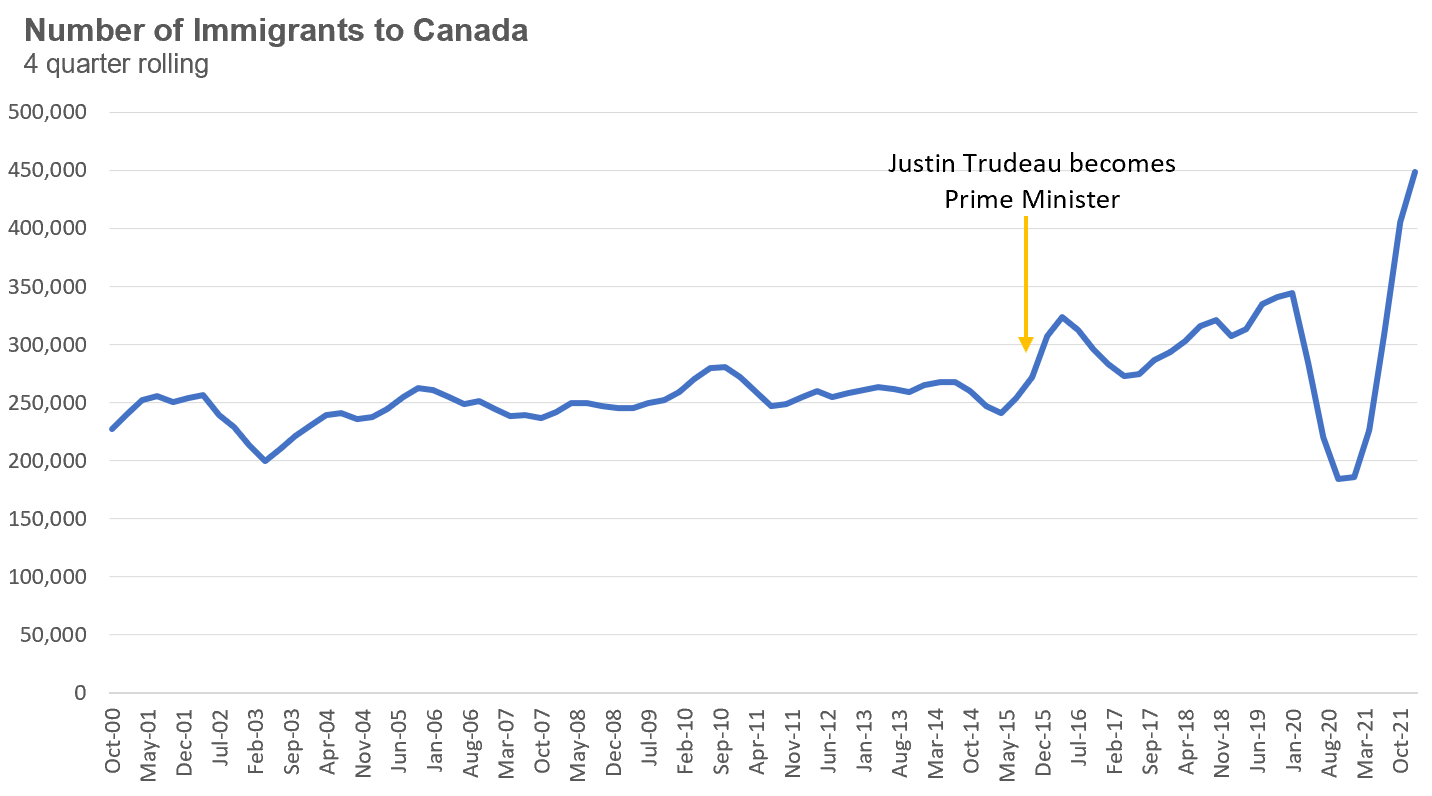
The federal Liberal government under Justin Trudeau has taken the opposite approach, rapidly increasing immigration targets without any consideration for whether or not provinces can build the homes we need for Canada’s growing population.
The Liberal government has raised Canada’s immigration target to over 400,000 per year through to 2024, well above the 250,000 average since 1990.
Canada’s immigration figures do not account for the boom in the number of non-permanent residents moving to Canada, which has also surged since 2015.
The reason home prices and rents have been surging is because Canada has not seen any meaningful increase in the number of homes being built. While we have seen a slight upward trend recently, and 2021 did see the highest number of completions in 30 years, this increase isn't nearly enough to meet the needs of Canada’s booming population.
There are a few important things that home buyers, sellers and real estate investors can take away from these trends.
Politicians — Not Immigrants — Are The Problem
In social media and other forums, I’ve seen some people argue that immigrants and non-permanent residents such as foreign students are to blame for sky-rocketing home prices, but I do not feel this is correct.
Canada has long been a country of immigrants so we can’t blame today’s new immigrants for wanting to move to Canada as so many of us and our families did.
The blame lies with our federal and provincial governments who do not do the hard work of ensuring we had a plan to increase our housing supply before increasing immigration and non-permanent resident targets. This includes building adequate student housing for the 390,000 international students moving to Ontario each year (triple the number from a decade ago) and long-term permanent rental and market rate housing.
Instead, students are forced to rent in illegal and unsafe rooming houses while new immigrants are faced with the same reality we all face, rapidly rising rents and the most overvalued housing market in the G7.
Housing Affordability Will Only Get Worse
It should be clear that when a government decides to rapidly increase their population before figuring out how to build more homes, they are deciding to drive up the cost of housing.
Rapidly rising housing costs is not an accident but a policy decision from our current governments. And while home prices have outpaced rents over the past ten years, we are beginning to see a big surge in the cost of renting.
Last month, the average rent for houses and condos rented on the Toronto Regional Real Estate Board’s MLS system increased by 18% over last year, an increase of over $400 per month.
While the rapidly rising cost to rent a home is terrible for many households, in particular for families newly immigrating to Toronto, our politicians are offering yet another gift to Canada’s real estate investors. In a market where mortgage costs are rising quickly, real estate investors will be very happy to see their rent increase to offset any increase to their mortgage payments.
Home Prices Will Continue to Trend Up (Eventually)
As I discussed in the above Consumer Advice section, the path for Toronto’s housing market over the short term is very uncertain and we may very well see some downward pressure on home prices as interest rates continue to rise.
But once rates start to decline again, we’ll still be faced with the same fundamental factors that have been driving up home prices in the Toronto area — and likely return to the same high home prices and unaffordability issues we have been seeing.
House sales (low-rise detached, semi-detached, townhouse, etc.) in the Greater Toronto Area (GTA) in June 2022 were down 42% over the same month last year and represent a 20-year low for the month of June.
New house listings in June were up 1% when compared to last year, but below typical new listing volumes for the month of June.
The number of houses available for sale (“active listings”) was up 46% when compared to the same month last year, but still 32% below pre-Covid levels in 2019.
The Months of Inventory ratio (MOI) looks at the number of homes available for sale in a given month divided by the number of homes that sold in that month. It answers the following question: If no more homes came on the market for sale, how long would it take for all the existing homes on the market to sell given the current level of demand?
The higher the MOI, the cooler the market is. A balanced market (a market where prices are neither rising nor falling) is one where MOI is between four to six months. The lower the MOI, the more rapidly we would expect prices to rise.
While the current level of MOI gives us clues into how competitive the market is on-the-ground today, the direction it is moving in also gives us some clues into where the market may be heading.
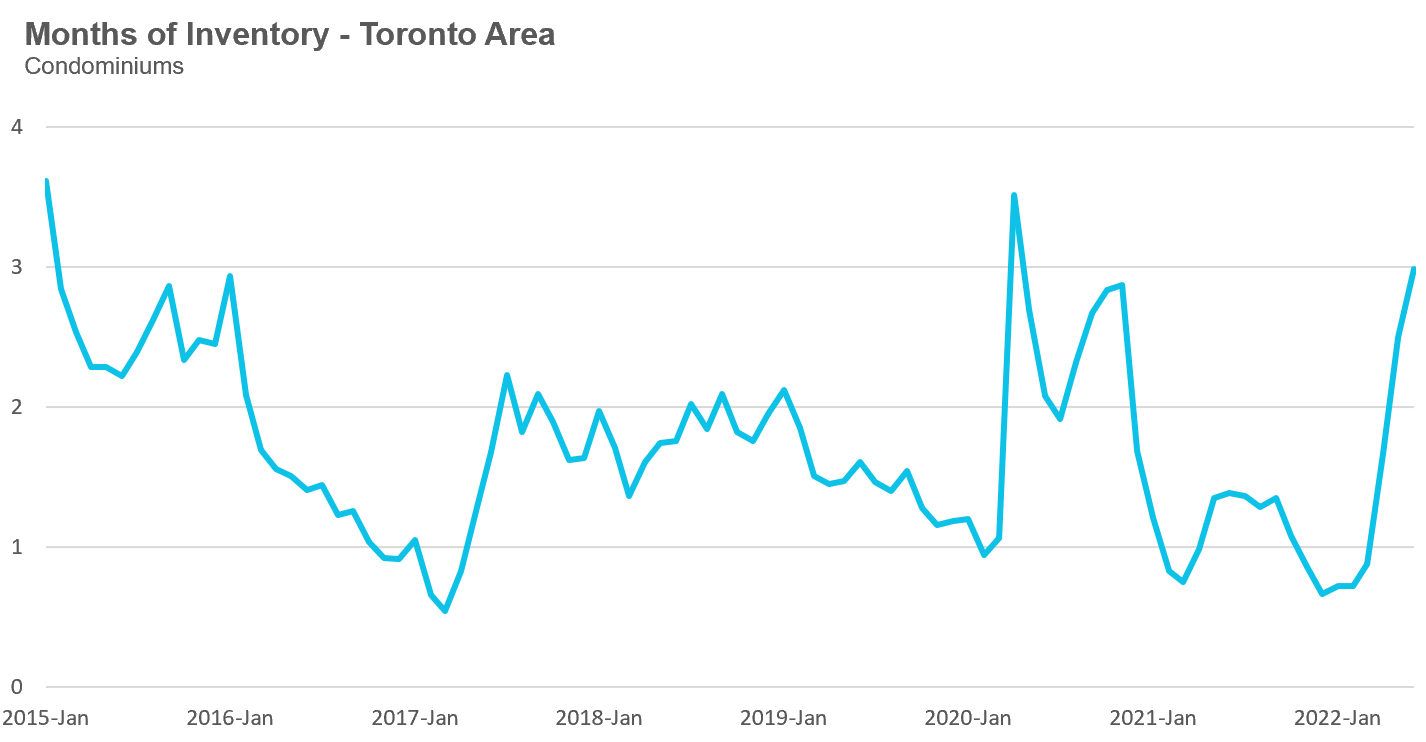
While below a very competitive 1 MOI a few months ago, inventory in the Toronto area has increased to 2.3 MOI in June. The fact that the MOI has been rising rapidly since March is a sign that the market is cooling down.
The share of houses selling for more than the owner’s asking price declined to 40% in June.
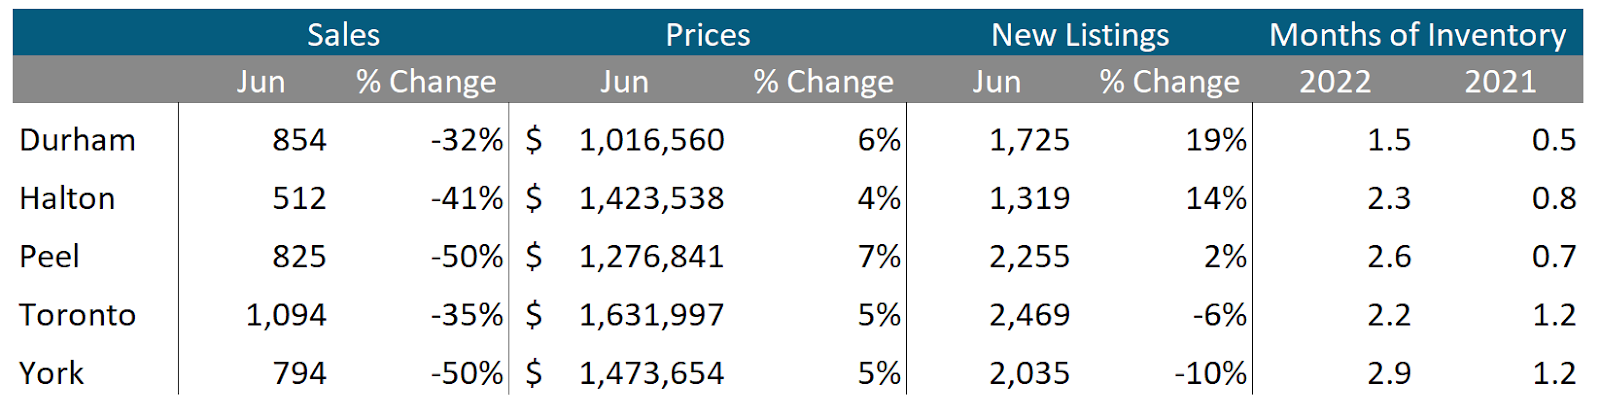
The average price for a house declined month-over-month to $1,373,325 in June 2022 and is well below the peak of $1,679,429 reached in February. Compared to last year, the average price in June is up 5%.
The median house price in June was $1,200,000, up 5% over last year, but below the peak of $1,485,000 reached in February.
The median is calculated by ordering all the sale prices in a given month and then selecting the price that is in the midpoint of that list such that half of all home sales were above that price and half are below that price. Economists often prefer the median price over the average because it is less sensitive to big increases in the sale of high-end or low-end homes in a given month which can skew the average price.
Condo (condominiums, including condo apartments, condo townhouses, etc.) sales in the Toronto area in June 2022 were down 40% over last year and well below pre-Covid sales volumes for the month of June.
New condo listings were down 1% in June over last year and ahead of historical listing volumes for the month of June.
The number of condos available for sale at the end of the month, or active listings, was up 30% over last year.
Condo inventory levels have been rising rapidly since March, reaching 3 months of inventory in June.
The share of condos selling for over the asking price declined to 36% in June.
The average price for a condo in June fell to $766,839, down from the peak of $840,444 in March. The average price is up 9% over last year. The median price for a condo in June was $705,000, up 10% over last year, but down from $777,000 from the March peak.

Houses
While average prices were up on a year-over-year (YOY) basis across all five regions in the GTA, sales were down significantly and inventory levels were well ahead of last year’s level, indicating some market slowing.
Condos
While condo sales were down across the GTA, average prices continue to be up over last year in all five regions. Current MOI levels are well above 1 across the GTA, signalling a slowing market.
See Market Performance by Neighbourhood Map, All Toronto and the GTA
Greater Toronto Area Market Trends
GET MORE DATA
This monthly Move Smartly Toronto Area Real Estate Market Report is powered by Realosophy Realty. Get the same up-to-date Toronto area market data on realosophy.com and additional information on every home for sale, including building permit history, environmental alerts and more when you buy a home with Realosophy Realty.