

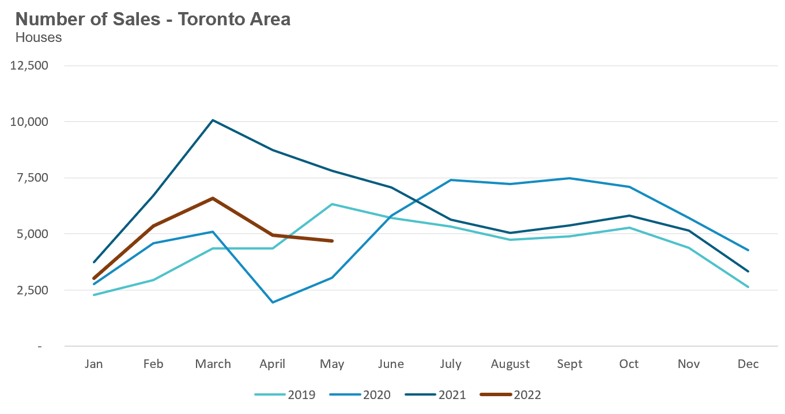
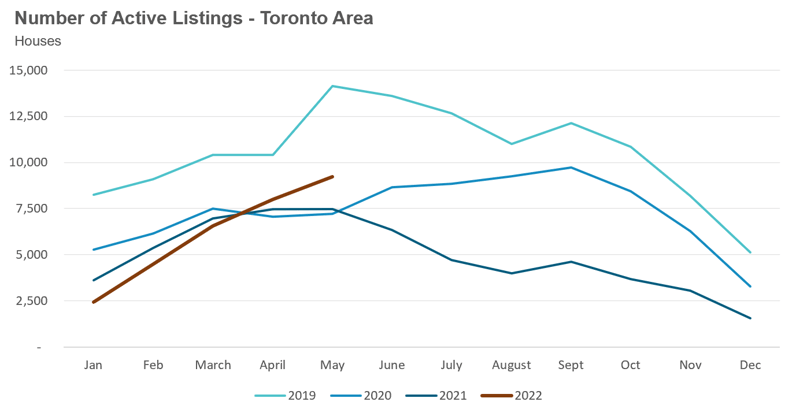
The Toronto Regional Real Estate Board reported that the Greater Toronto Area saw a total of 7,283 home sales for the month of May as seen in this chart below. This is the lowest sales volume for the month of May in over twenty years, aside from May 2020 when sales plummeted due to the initial COVID-19 lockdown.
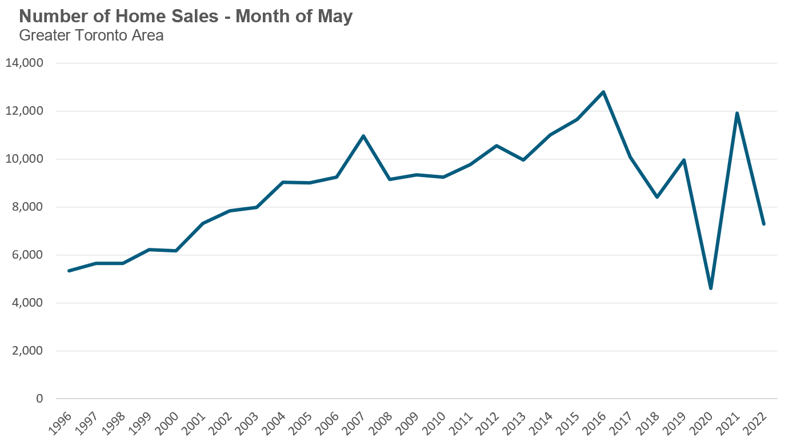
Looking at this chart above, it’s worth briefly touching on the previous downward trend we saw in sales after 2016 when the Toronto area housing market experienced a housing bubble that peaked in the first quarter of 2017 with sales falling sharply after that. Sales continued to slump in 2018 because the federal government introduced a stress-test on uninsured mortgages which took some buyers out of the market as they adjusted to a tighter lending environment. Sales rebounded in 2019 before plummeting when the province went into its first lockdown due to the COVID-19 pandemic.
This time, one of the big factors behind the 20-year low in sales volumes last month are the rapidly rising interest rates and the expectation that rates will continue to increase in the months ahead. Notably, this factor is a bit different when it comes to the timing of its impact as the Bank of Canada itself acknowledges.
“When we adjust our policy interest rate at the Bank, we don’t expect immediate results. It usually takes 18 to 24 months to see the full effects.”
- The Bank of Canada
The sudden decline of sales and prices in Toronto’s housing market over the past few months has many people comparing today’s market to a similar decline in house prices Toronto experienced in 2017.
So how does the situation today compare to what we experienced then?
The Toronto area housing market experienced a housing bubble in 2015 and 2016 in which the low-rise suburban market saw the most rapid price appreciation, much as we’ve seen during the more recent housing market boom seen during the pandemic after the initial period of the first lockdown in 20220.
The bubble then peaked during the first quarter of 2017 just before the province of Ontario introduced a foreign buyer tax.
It is important to note that in this case, consumer attitudes about this new tax proved as potent (if not more) than the tax itself — as buyers started to step out of the market and sellers rushed in to sell their home a month before the tax was implemented. This behaviour was no doubt spurred by worries about what had happened a year previous in British Columbia (BC) where the implementation of a foriegn buyer tax led to a decline in house prices in the Vancouver area.
In Ontario, these worries became a self-fulfilling prophecy as the market became flooded with new listings, virtually overnight just as many buyers moved to the sidelines expecting prices to be lower in the future. Many of the people selling their homes at the time found themselves in the stressful position of needing to sell their current home in order to finance the recent purchase of another home at the much higher prices the market was experiencing only weeks earlier. This resulted in a sharp decline in prices between March and July of 2022 with prices plateauing after that. You can read more about this entire period in more detail in my report A Sticky End: Lessons Learned From Toronto's 2017 Real Estate Bubble.
The trends we are seeing in the Toronto area housing market today have a number of similarities to what happened in 2017.
Toronto’s housing market was incredibly competitive during the fourth quarter of last year and moving into the start of this year with more than 8 out of 10 homes receiving multiple offers and selling for above the seller’s asking price.
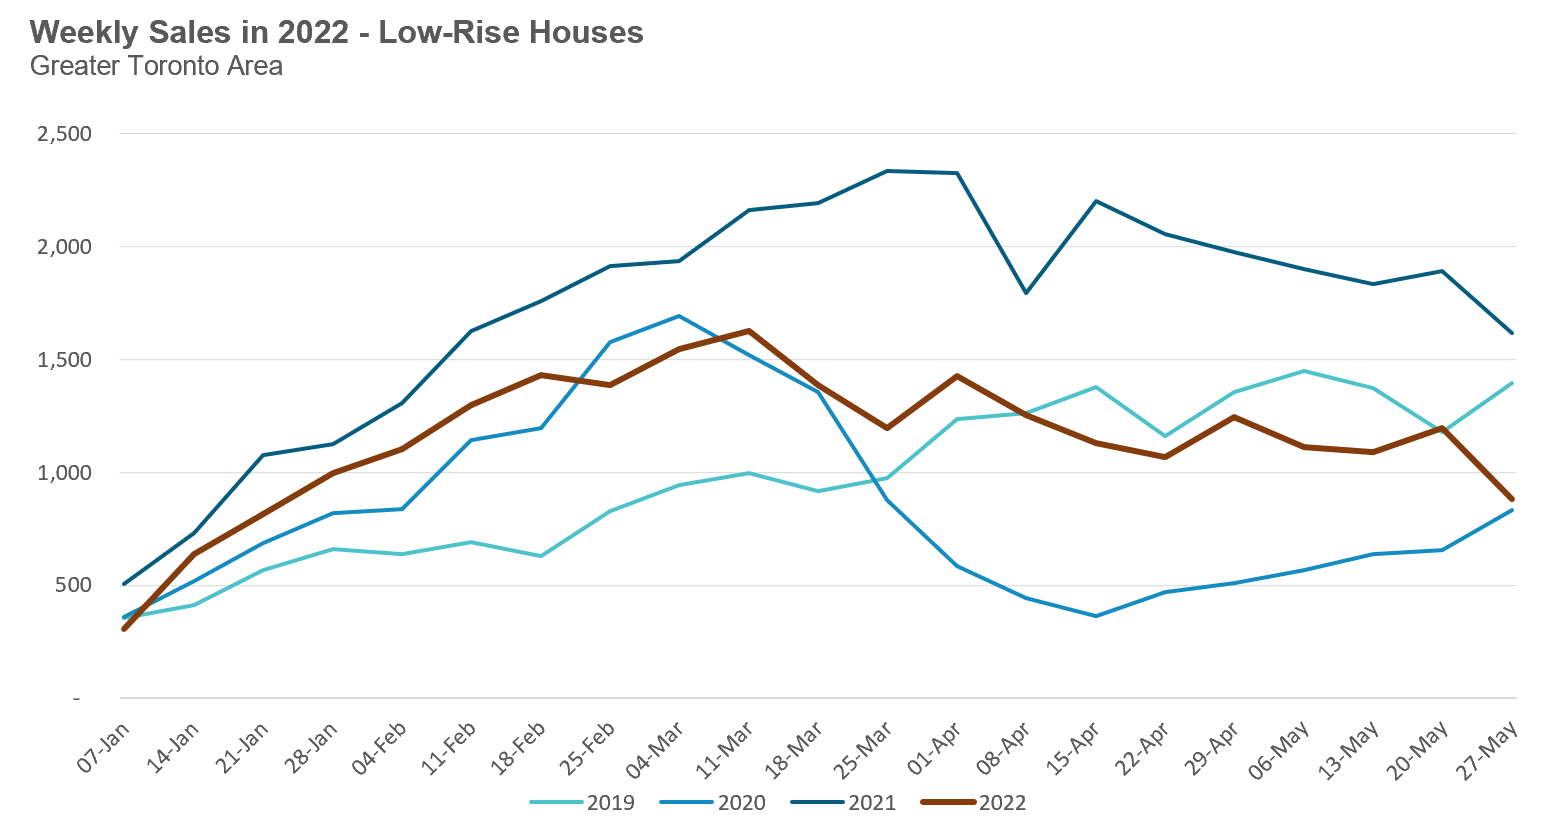
But then demand gradually started to cool down in late February — homes started getting fewer showings and receiving fewer offers on their offer night than similar homes had received just weeks earlier. As we see in the chart below, since early March of this year, weekly sales volumes have been trending down when we would normally expect to see sales volumes trend up as we move into the spring market.
In last month’s report, I discussed some of the factors that are likely leading to the decline in the number of sales we’re seeing.
Much as we saw in 2017, this decline in demand from home buyers has put a lot of pressure on home sellers who need to sell their current home in order to take possession of the home they just purchased (given how competitive the housing market has been for so long, most people in the Toronto area buy their next home first then list their current home for sale).
Given this need, with every passing week, more sellers were willing to take a price $20 to $30K below what a similar home had sold for weeks earlier. Once this trend continues long enough, we start to see home prices down by over $200K in just months. The chart below shows the average sale price for low-rise houses each week since the start of the year.
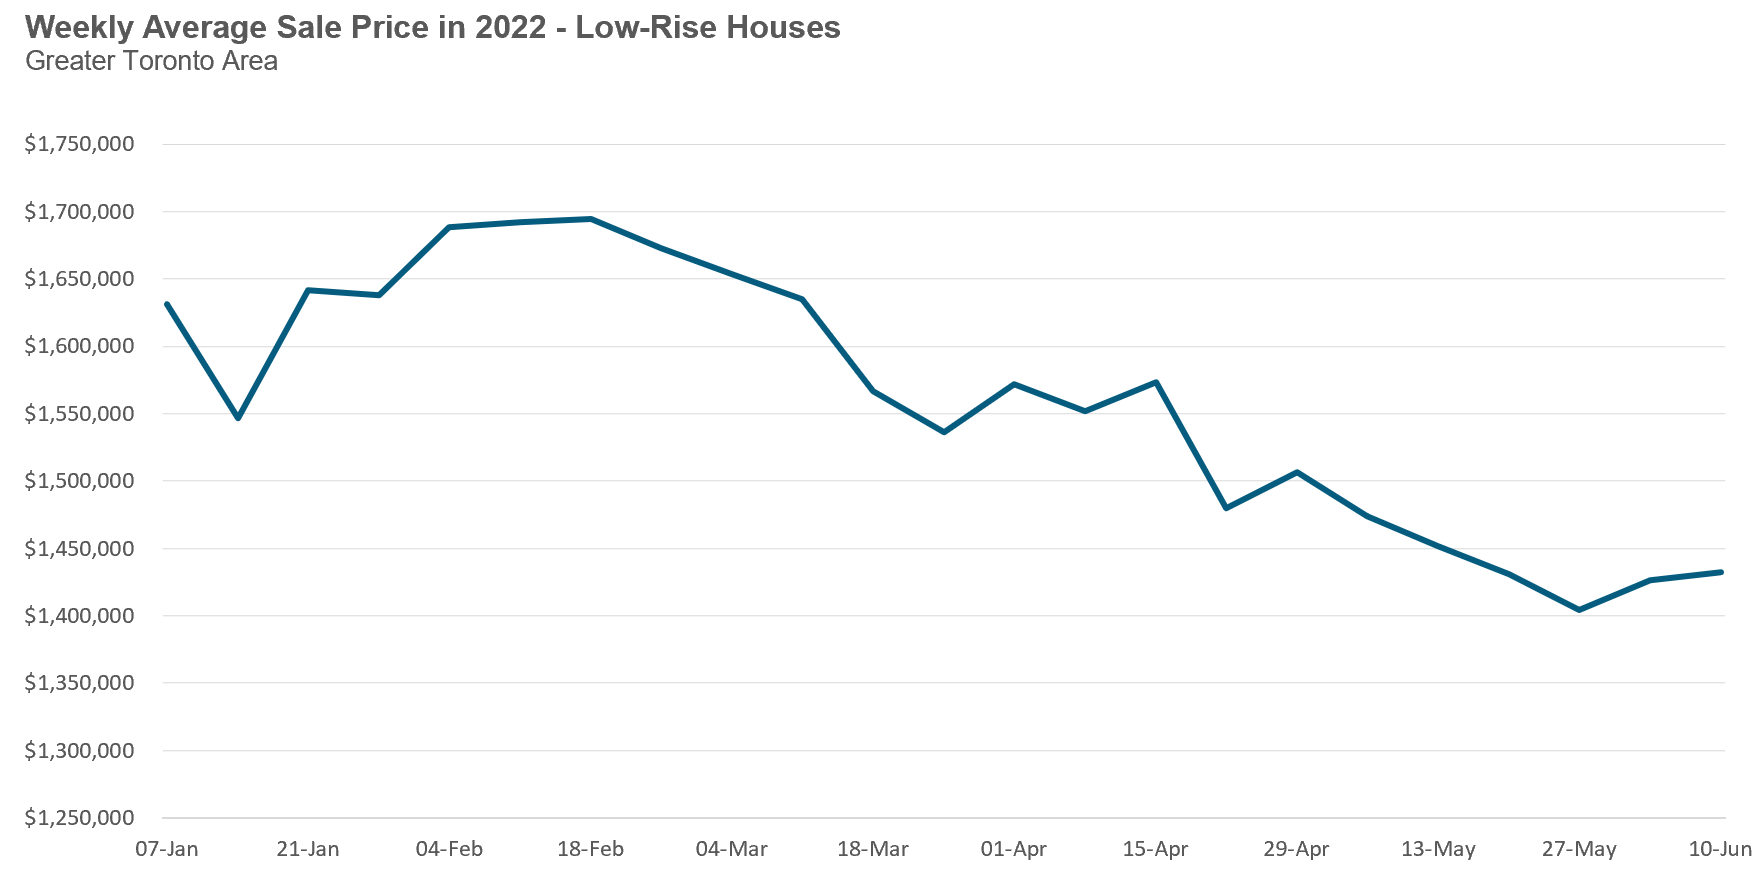
As discussed earlier, this sharp decline in sale prices is very similar to the trend we saw in 2017.
I’ve seen a number of real estate agents who have been suggesting that just like 2017, we’ll see home prices plateau by the summer and things will be “back to normal” by the fall market. While this of course is possible, I personally would not jump to the conclusion that this year’s market will end up like that of 2017 just because there have been similarities in these past few months.
This is a different time and the economic and housing risks ahead are considerably greater today than they were 5 years ago.
Canada’s inflation rate is much higher than it was in 2017 and Canadian households are far more leveraged today as home prices have continued to climb — and now, interest rates are increasing at a rate we have not seen in decades.
All of these factors, along with global factors like the war in Ukraine which has been cited for rising fuel and food prices globally, are making today’s housing market considerably more vulnerable than it was in 2017 when general economic conditions were far stronger.
Over the past two years, the low-rise suburban housing market has seen a lot of media attention due to skyrocketing demand and prices driven by the “urban exodus” triggered by the COVID-19 pandemic.
The suburban condo market has been largely overlooked because it makes up a relatively small share of total sales each month. But drilling down into some of the trends in the suburban condo prices reveals some interesting — and overlooked — trends.
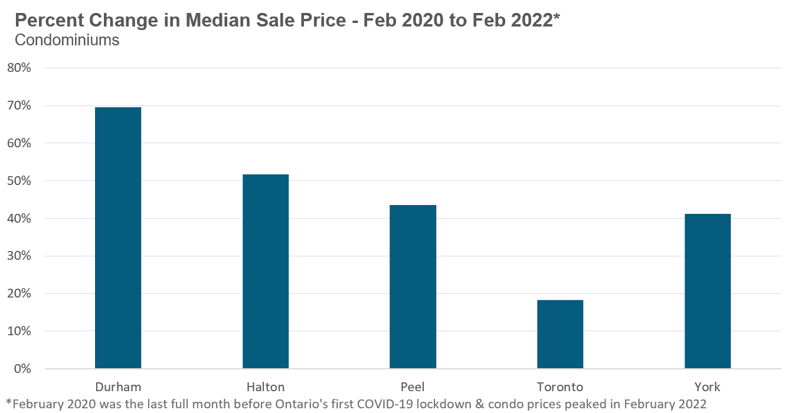
This first chart compares the median sale price for condominiums (apartments and condo townhomes) for February 2020 (the last month before the COVID-19 lockdowns) and February 2022, the approximate peak for this cycle.
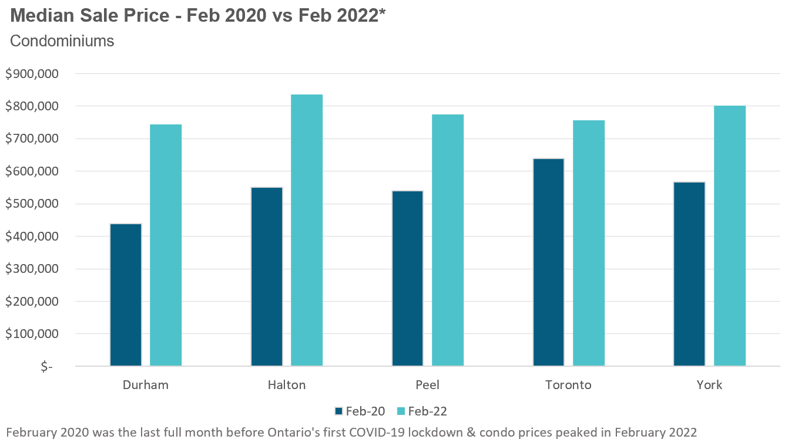
The first thing that stands out is that condo prices in the City of Toronto were higher than the other four regions in 2020, but since then, median condo prices in Halton, Peel and York have surpassed Toronto while Durham prices are just behind Toronto.
Condo prices surged by more than 40% over the past two years in York and Peel, more than 50% in Halton and were up 69% in Durham. In comparison, the City of Toronto saw condo prices rise by 18% over this two year period.
Since February 2022, the condo market has experienced very similar dynamics to the ones we are seeing in the low-rise market. Sales and prices are declining far more rapidly in the suburbs than in the City of Toronto. The chart below shows the change in the median sale price between February and May of this year.
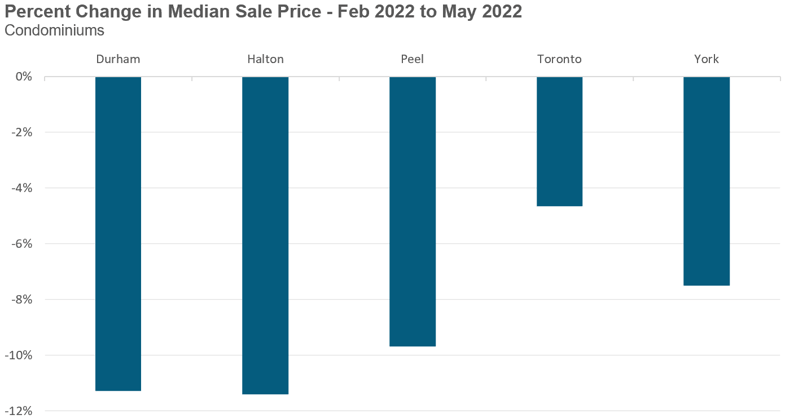
While we typically don’t compare median price changes on a month-over-month basis if they have not been adjusted to account for seasonal differences, it’s worth noting that median prices don’t typically decline as we move into the spring market.
The decline we are seeing in condo prices is likely due to the same factors driving the decline in house prices. Rising interest rates have pulled many buyers out of the market while current sellers who have purchased a house and now need to sell their current condo find themselves selling in a slower market and are more willing to accept a lower price for their condo to ensure they can close on the property they just purchased, a trend I discussed in last month’s report.
In the months ahead, it will be critical to keep a close eye on the changing dynamics of the Toronto area housing market by house type and geographic location because regional and house type trends may diverge over time.
House sales (low-rise detached, semi-detached, townhouse, etc.) in the Greater Toronto Area (GTA) in May 2022 were down 40% over the same month last year and well below historic levels for the month of May. It’s also worth noting that sales also declined on a month-over-month basis when compared to April. Normally, we expect sales to trend up from April to May so the sales trends in 2020 and 2021 below are not typical for the housing market.
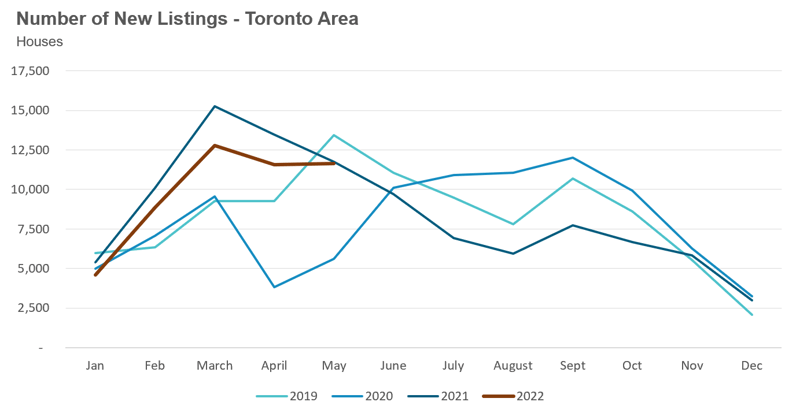
New house listings in May were flat when compared to last year, but well below historic new listing volumes for the month of May.
The number of houses available for sale (“active listings”) was up 23% when compared to the same month last year, but still 35% below pre-Covid levels in 2019.
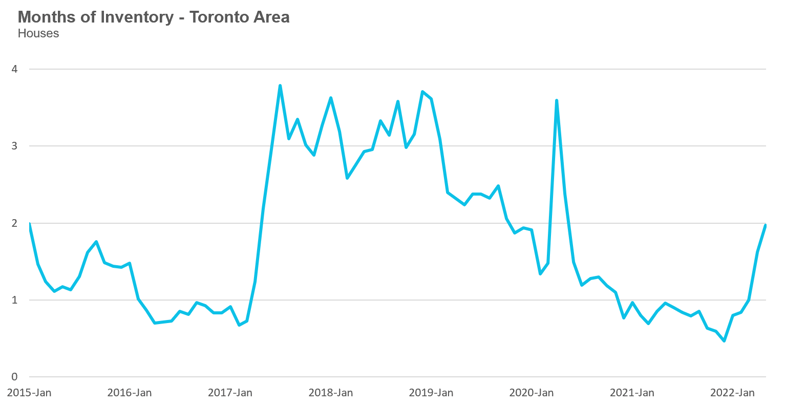
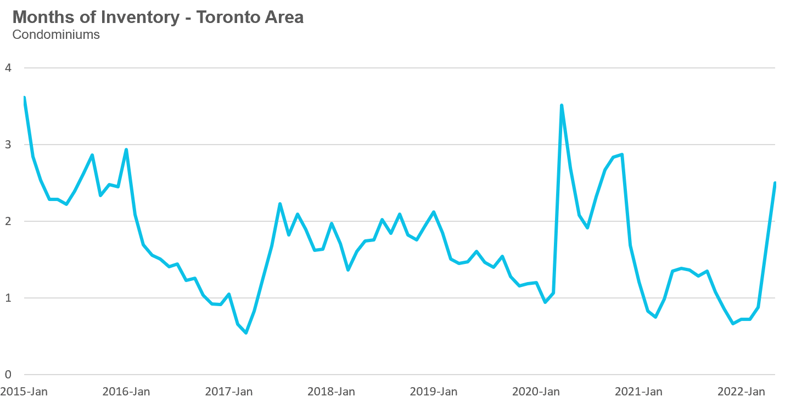
The Months of Inventory ratio (MOI) looks at the number of homes available for sale in a given month divided by the number of homes that sold in that month. It answers the following question: If no more homes came on the market for sale, how long would it take for all the existing homes on the market to sell given the current level of demand?
The higher the MOI, the cooler the market is. A balanced market (a market where prices are neither rising nor falling) is one where MOI is between four to six months. The lower the MOI, the more rapidly we would expect prices to rise.
While the current level of MOI gives us clues into how competitive the market is on-the-ground today, the direction it is moving in also gives us some clues into where the market may be heading.
While below a very competitive 1 MOI just two months ago, house inventory in the Toronto area increased to 2 MOI in May.
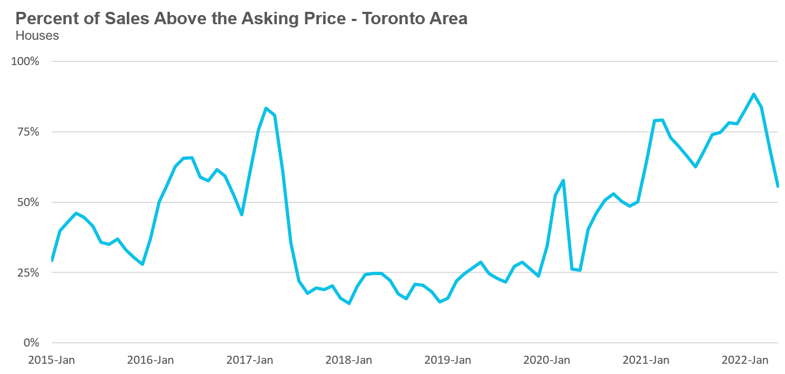
The share of houses selling for more than the owner’s asking price declined to 56% in May.
The average price for a house declined month-over-month to $1,444,169 in May 2022 and is well below the peak of $1,679,429 reached in February. Compared to last year, the average price in May is up 10%.
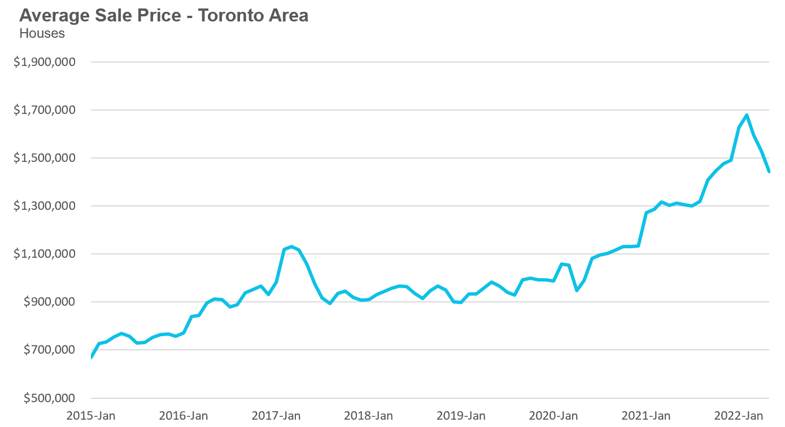
The median house price in May was $1,251,000, up 10% over last year, but below the peak of $1,485,000 reached in February.
The median is calculated by ordering all the sale prices in a given month and then selecting the price that is in the midpoint of that list such that half of all home sales were above that price and half are below that price. Economists often prefer the median price over the average because it is less sensitive to big increases in the sale of high-end or low-end homes in a given month which can skew the average price.
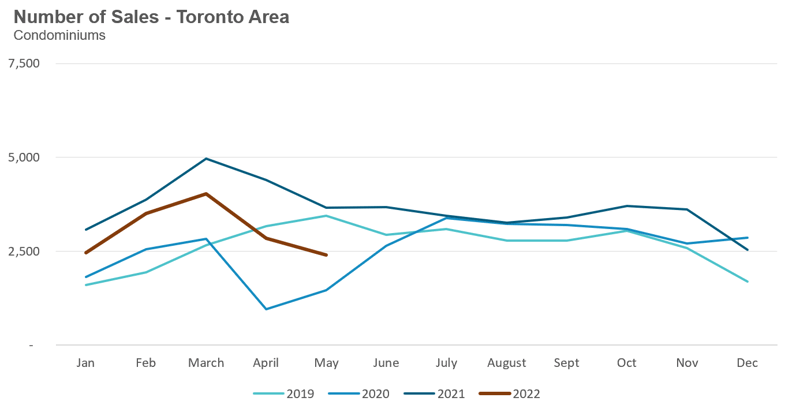
Condo (condominiums, including condo apartments, condo townhouses, etc.) sales in the Toronto area in May 2022 were down 35% over last year and well below pre-Covid sales volumes for the month of May.
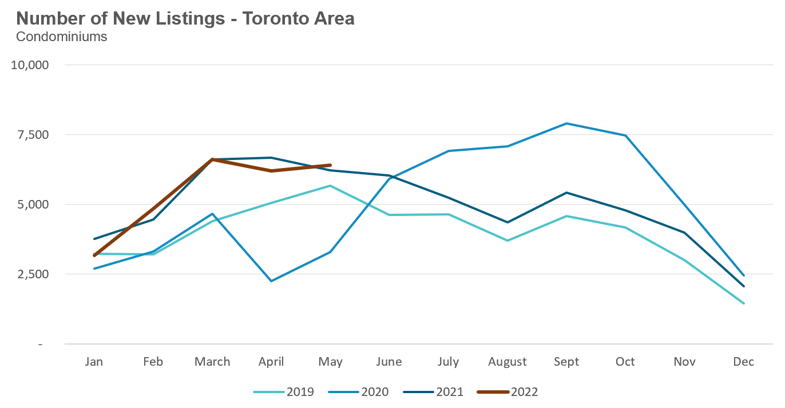
New condo listings were up 3% in May over last year and well ahead of historical listing volumes for the month of May.
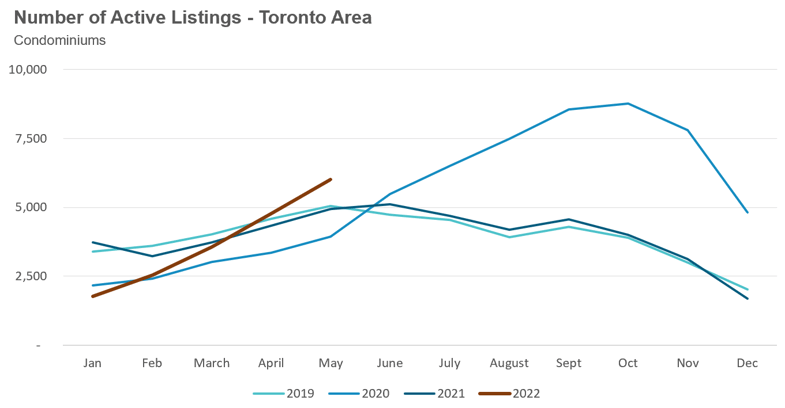
The number of condos available for sale at the end of the month, or active listings, was up 21% over last year.
The MOI increased to 2.5 in the month of May.
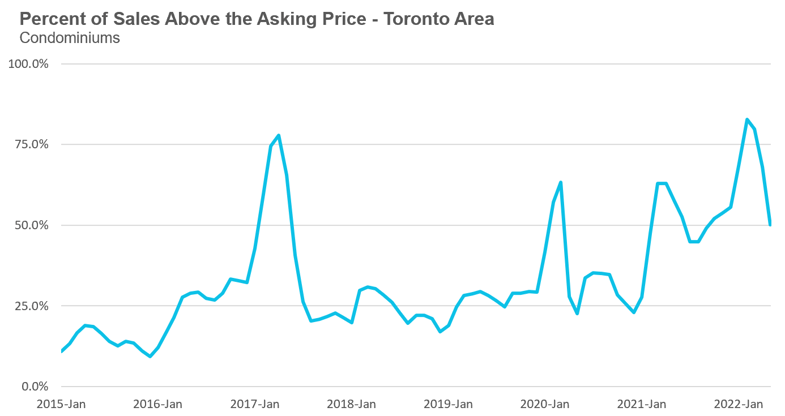
The share of condos selling for over the asking price declined to 50% in May.
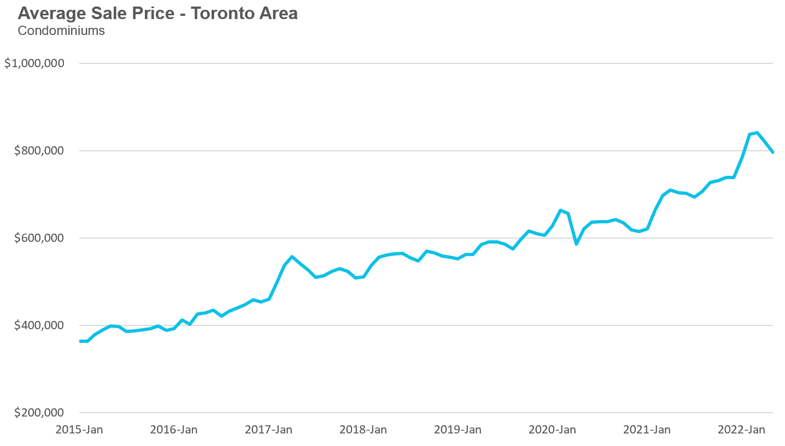
The average price for a condo in May fell to $795,409, down from the peak of $840,444 in March. The average price is up 13% over last year. The median price for a condo in May was $720,000, up 13% over last year, but down from $777,000 from the March peak.
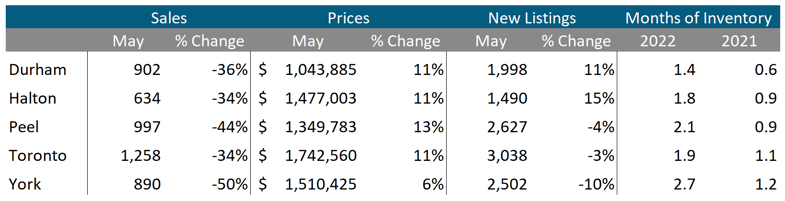
Houses
While average prices were up on a year-over-year (YOY) basis across all five regions in the GTA, sales were down significantly and inventory levels were well ahead of last year’s level, indicating some market slowing.
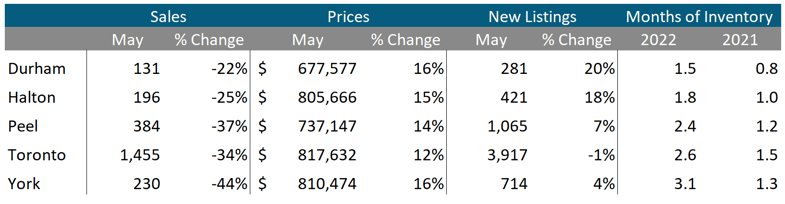
Condos
While condo sales were down across the GTA, average prices continue to be up double digits in all five regions. Current MOI levels are well above 1 across the GTA, signalling a slowing market.
See Market Performance by Neighbourhood Map, All Toronto and the GTA
Greater Toronto Area Market Trends
GET MORE DATA
This monthly Move Smartly Toronto Area Real Estate Market Report is powered by Realosophy Realty. Get the same up-to-date Toronto area market data on realosophy.com and additional information on every home for sale, including building permit history, environmental alerts and more when you buy a home with Realosophy Realty.
