

“This is the way the bubble ends: not with a pop, but with a hiss. Housing prices move much more slowly than stock prices. There are no Black Mondays, when prices fall 23 percent in a day. In fact, prices often keep rising for a while even after a housing boom goes bust.”
- Paul Krugman, "That Hissing Sound", The New York Times
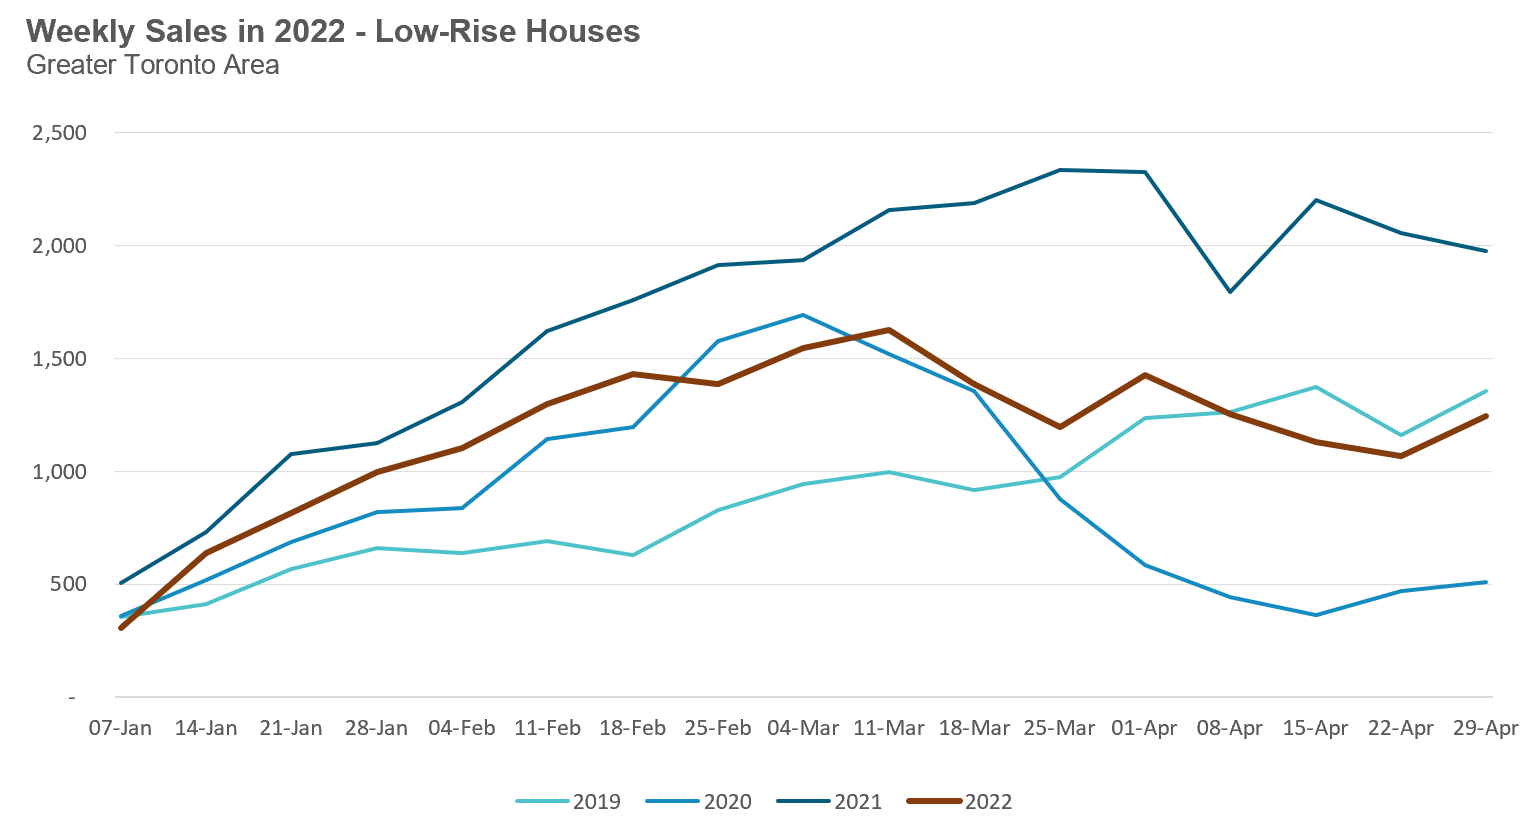
As discussed earlier in this report, one of the big drivers behind the decline in prices we are seeing for low-rise homes in the Toronto area is that buyers are pulling out of the market.
The best way to see this trend is to look at the number of home sales on a weekly basis.
Looking at this chart below for all of the Greater Toronto Area, we can see that low-rise house sales peaked in early March and have been on a downward trend since then. As discussed, this is a surprising trend during what is normally a busy time (see ‘It’s Spring Market Time So Why Are Toronto Home Sales Falling’ section above).
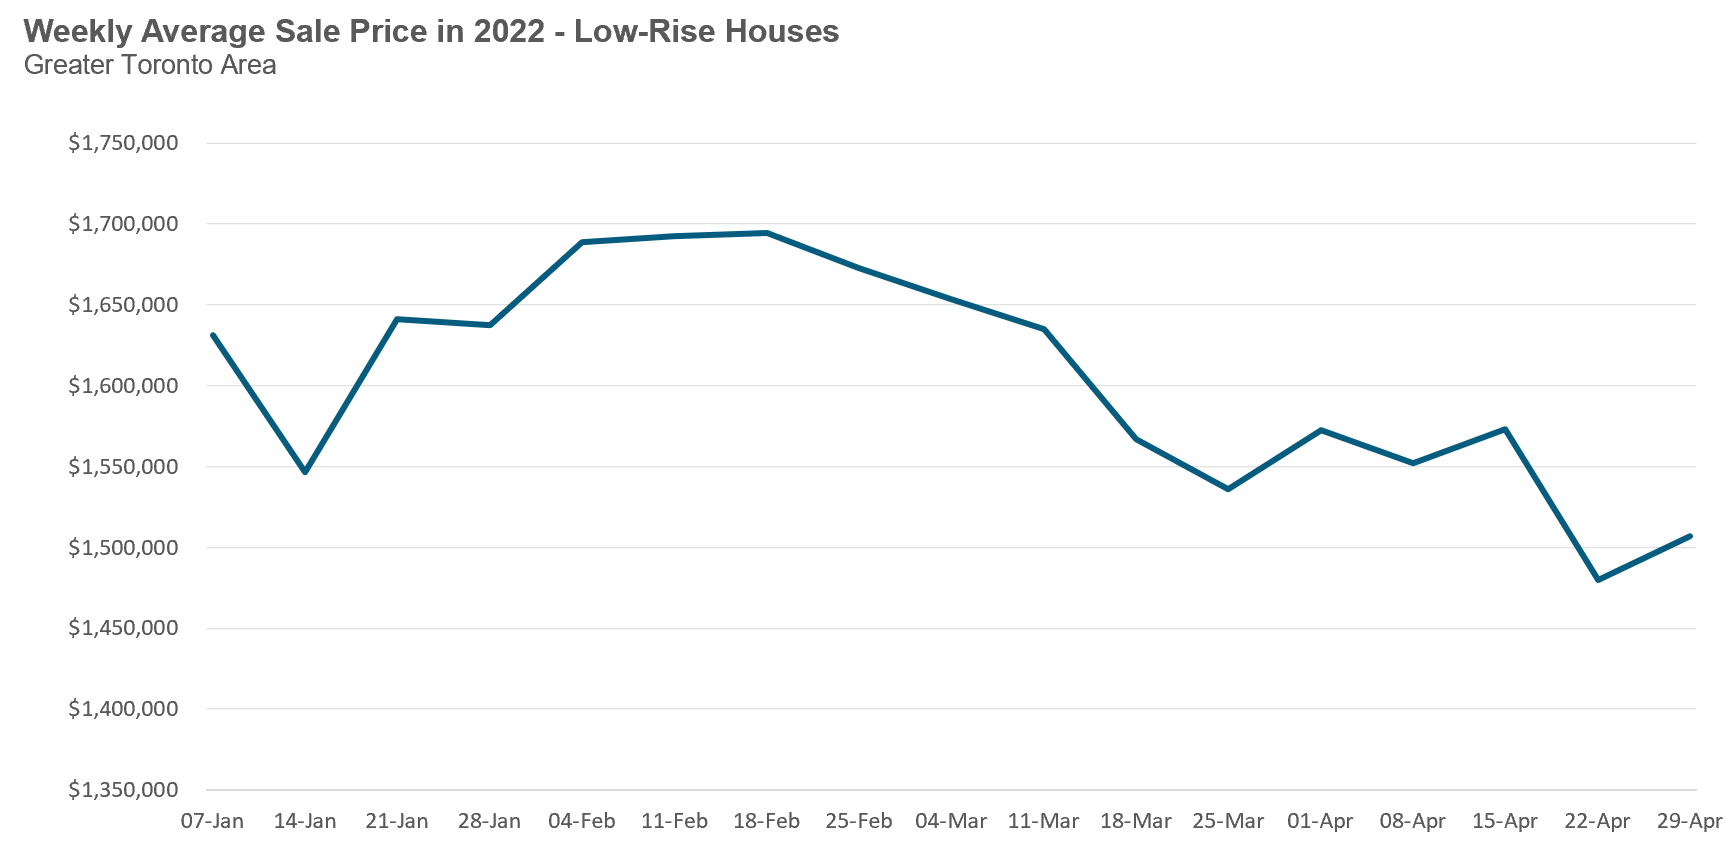
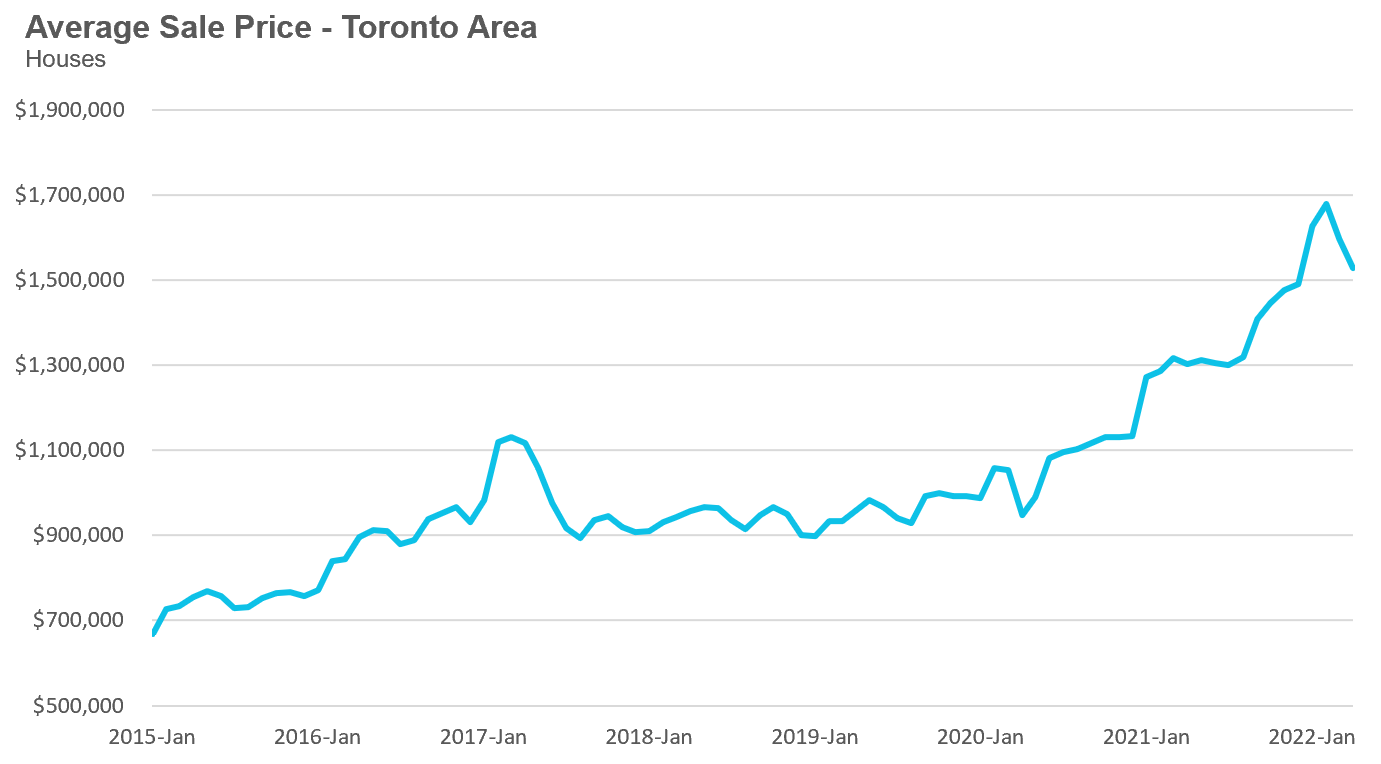
While sales were still trending up in early March, we can see from this next chart that average house prices began to trend down in late February. As discussed earlier in this report, this corresponds with the observations I shared in my March market report about the low-rise market beginning to cool down in mid to late February.
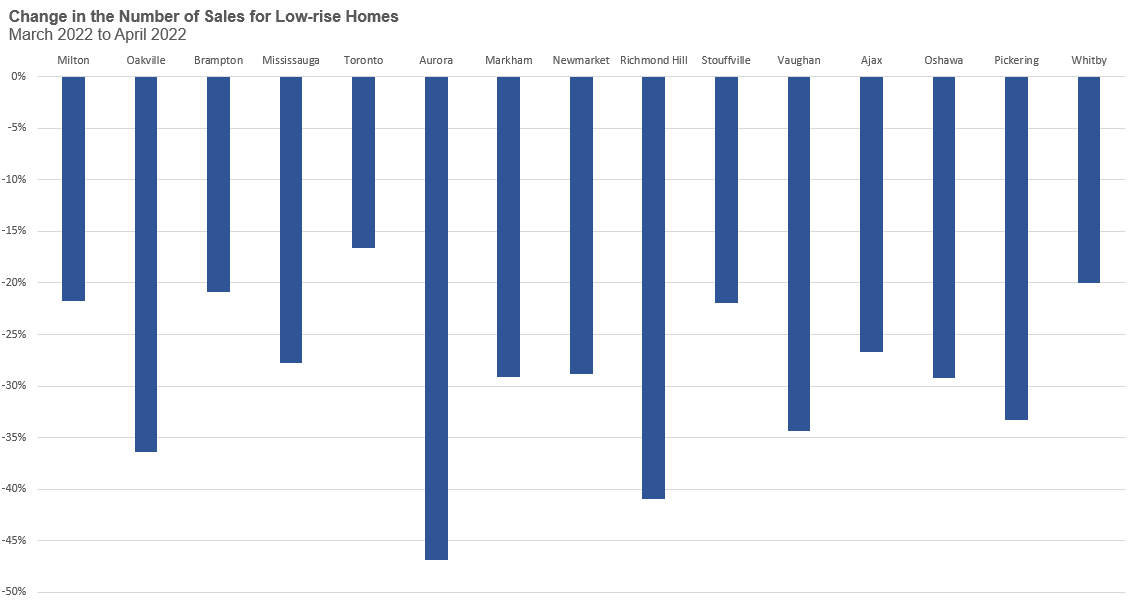
Over the past ten years, home sales across the Greater Toronto area have increased by an average of 8% between March and April. We can see from the chart below that a number of municipalities in the Toronto area are now seeing sales fall by more than 25% over the past month.
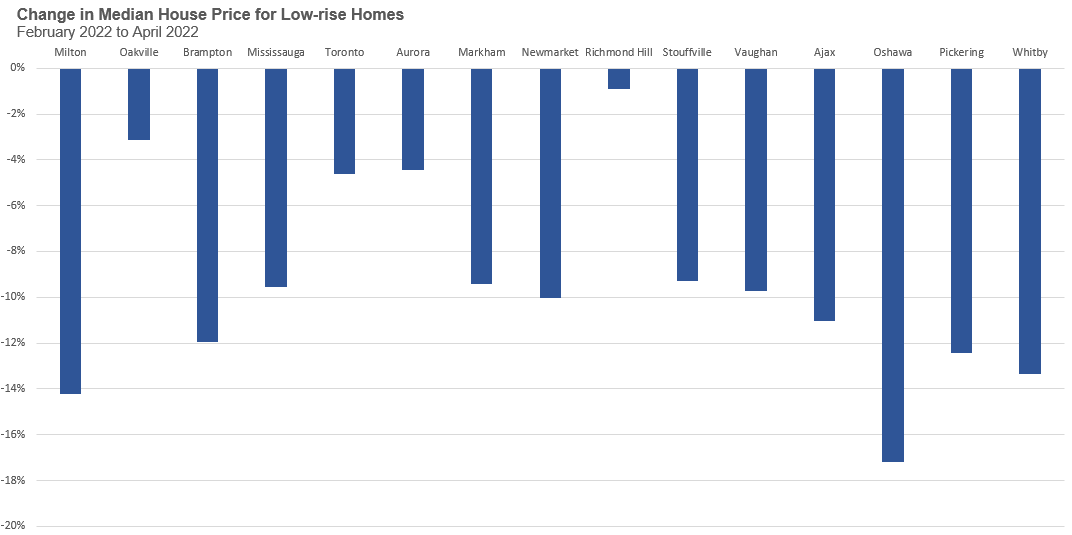
Since house prices peaked in February of this year, in the next chart below, I’m now going to compare the change in median house prices over the past two months. We typically don’t compare changes in median prices on a month-over-month basis because seasonal differences can impact prices. That being said, over the past ten years, median and average prices haven’t changed very much between February and April, and where they have, they’ve trended up slightly.
It’s also worth noting that while we typically compare house price changes on a year-over-year basis, doing so in a slowing market can be very misleading. Median house prices are actually up 18% over last year which suggests prices are trending up, but on the ground we can see that prices have actually been trending down the past couple of months.
It’s difficult to explain all of the regional differences we are seeing in the change in sales and prices particularly as we are only looking at a couple of months of data.
But the one trend that is starting to stand out is how the City of Toronto has performed relative to the suburban market — urban houses have performed better than suburban houses; even within the City of Toronto, the areas that tend to be slower are the neighbourhoods that are further from the downtown core, moving towards the suburban markets.
The urban housing market has performed better in part because house prices in these areas did not grow as much as they did in the suburban market (an illustration of the ‘the higher up, the further to fall’ phenomena). This means that when compared to suburban houses, urban houses are a better value today than they were before the pandemic. This is a trend that may continue as people return to their offices and gas prices continue to surge — and the urban exodus we saw during Covid-19 pandemic may begin to reverse.
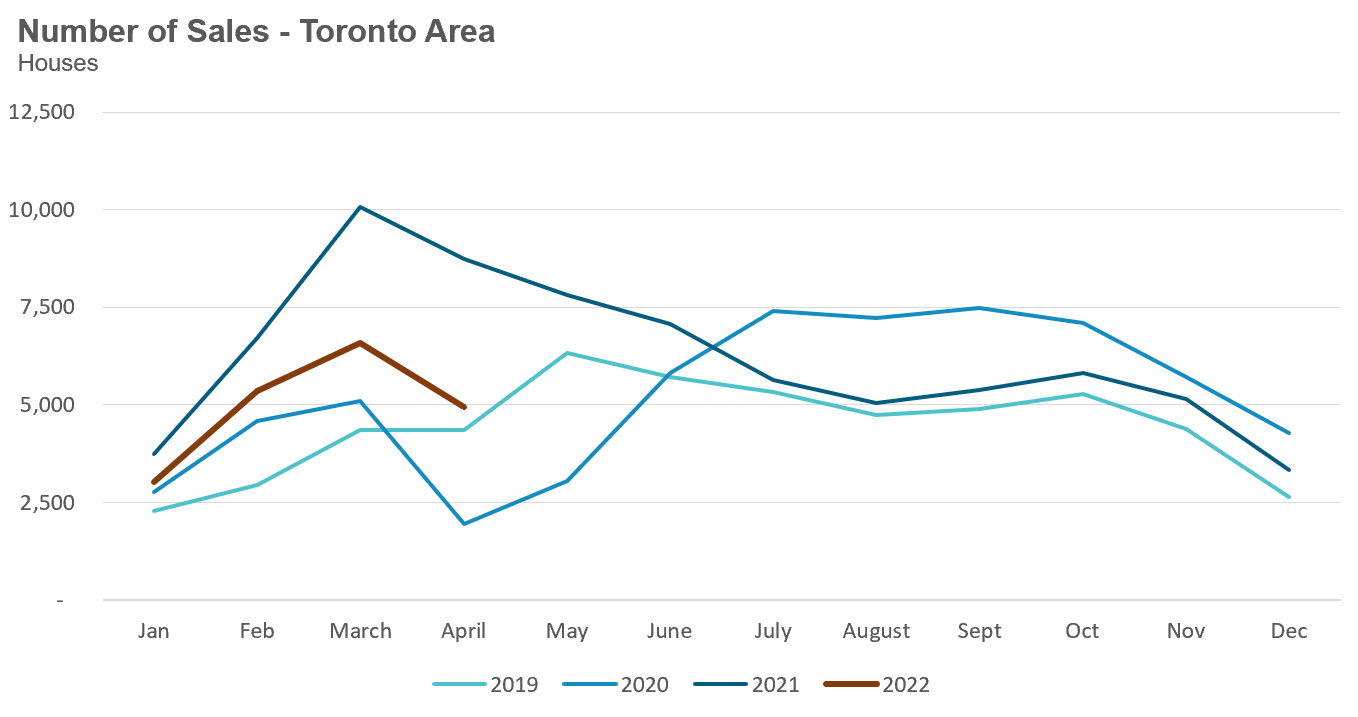
House sales (low-rise detached, semi-detached, townhouse, etc.) in the Toronto area (GTA) in April 2022 were down 44% over the same month last year, but slightly above levels for the same month in pre-Covid 2019. However, the more important trend is that house sales are trending down during a period when they should be trending up. The downward trend in sales in 2020 was due to initial lockdowns in Ontario due to the Covid-19 pandemic.
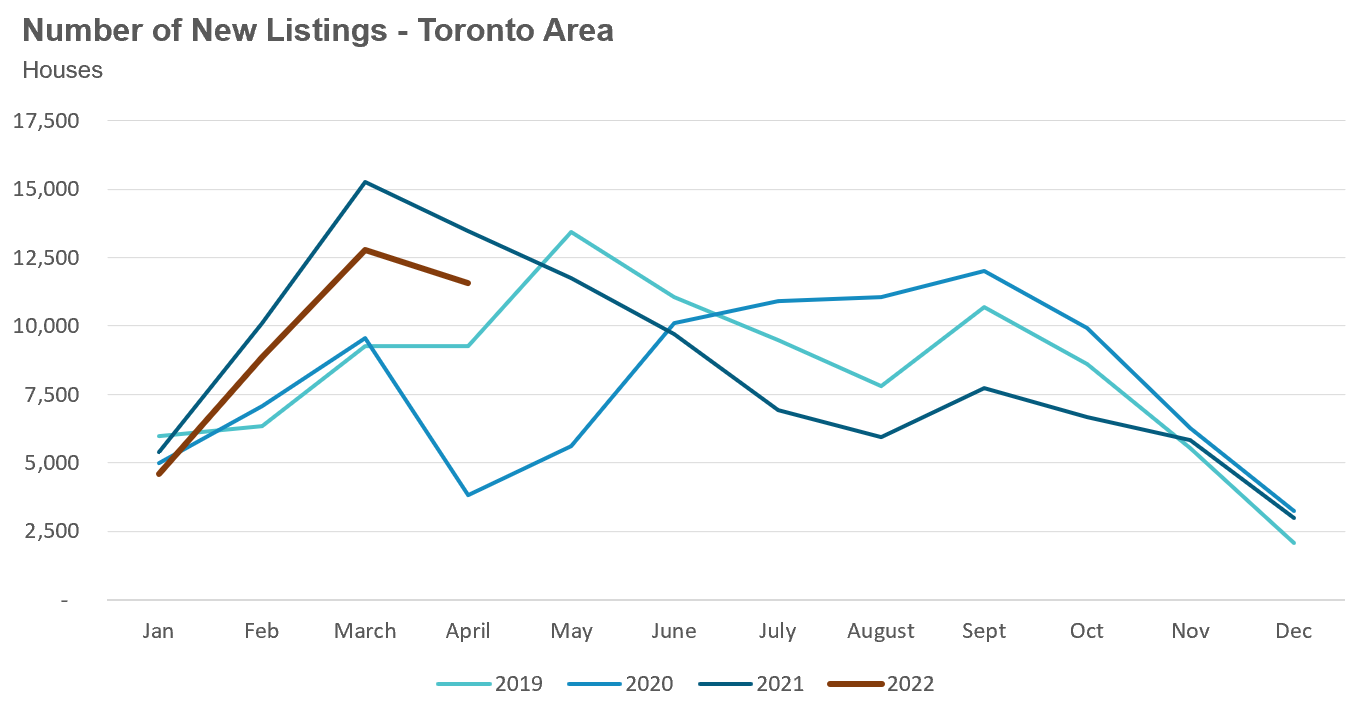
New house listings in April were down 14% over last year, but well above the volume seen in 2019 and 2020.
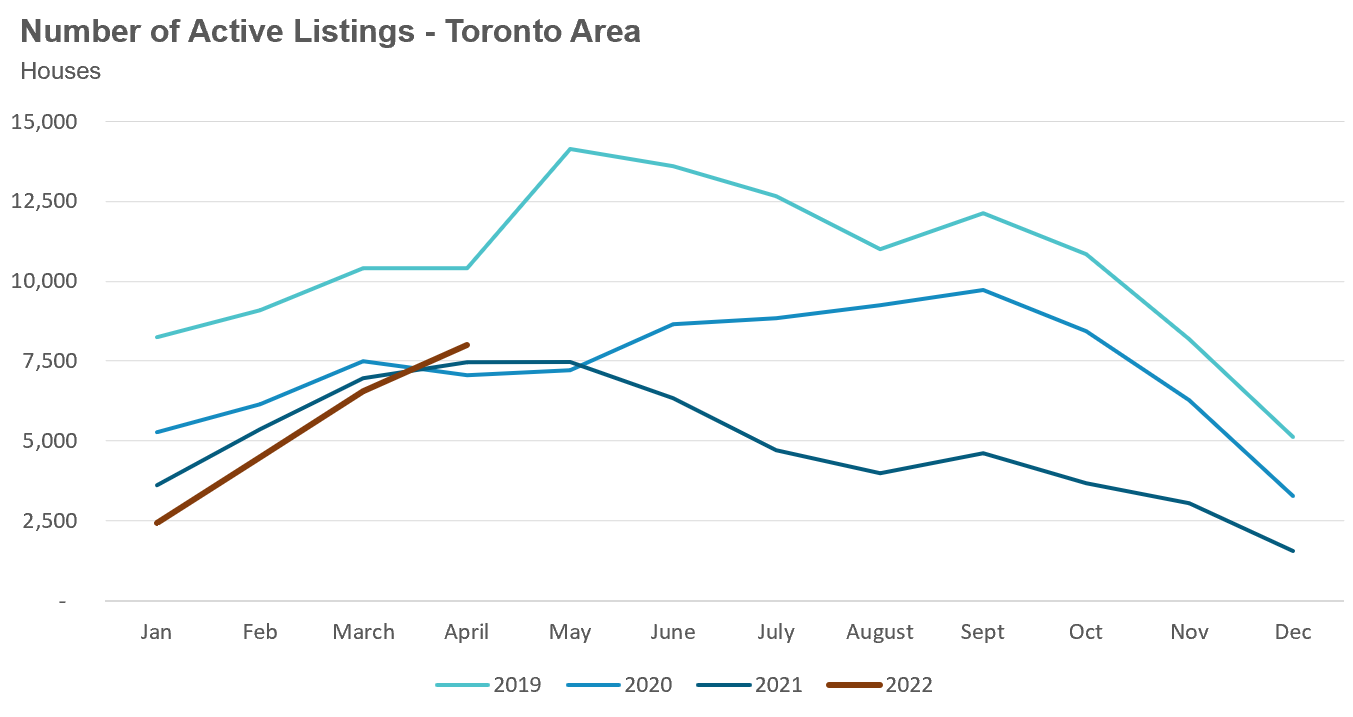
The number of houses available for sale (“active listings”) was up 7% when compared to the same month last year but still 23% below pre-Covid levels in 2019.
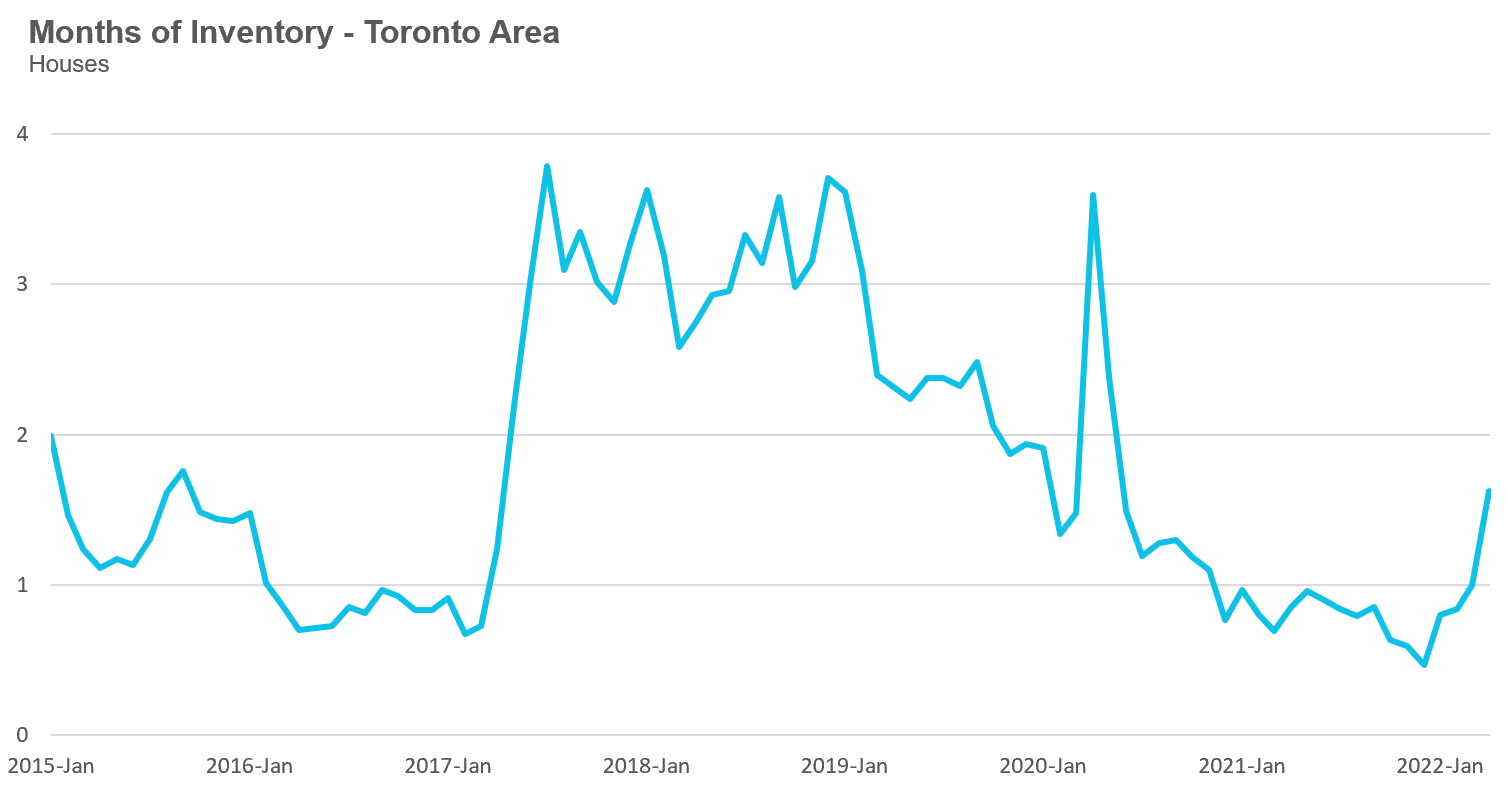
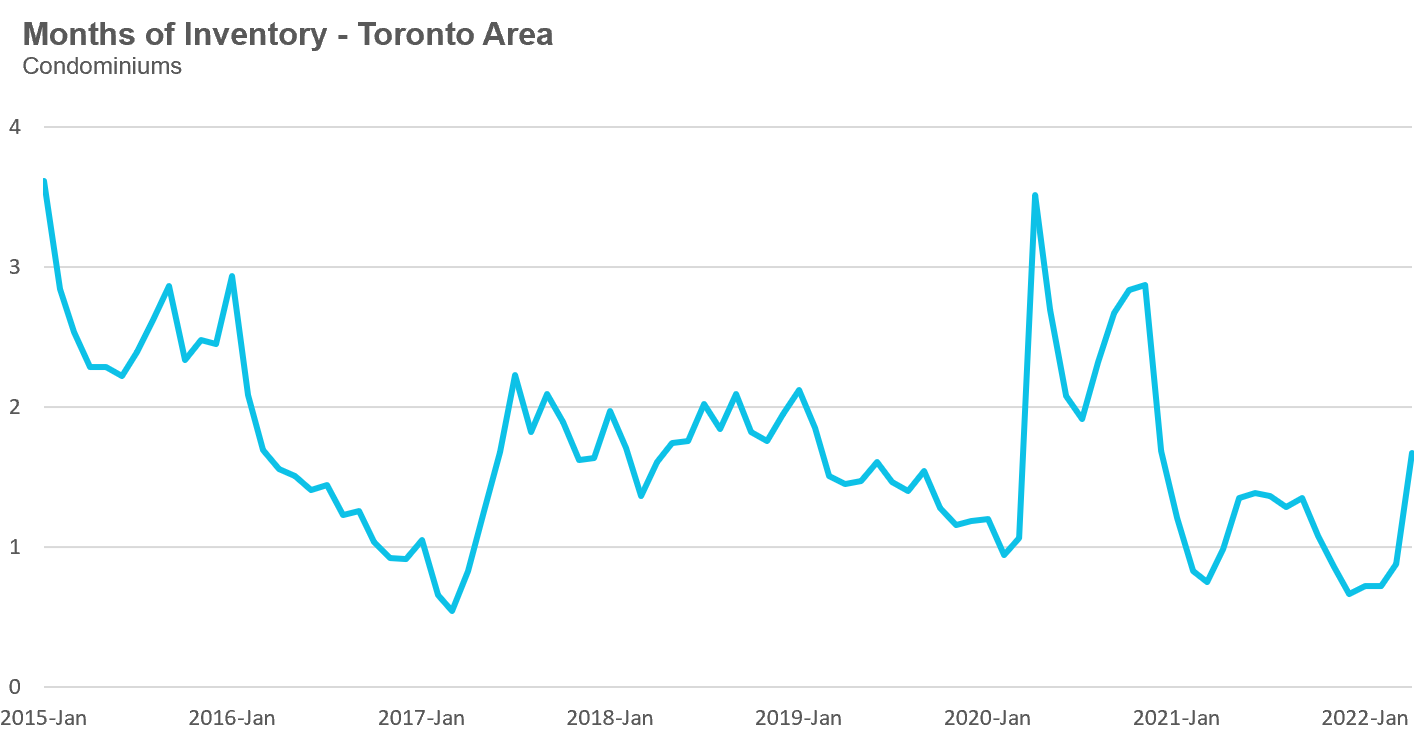
The Months of Inventory ratio (MOI) looks at the number of homes available for sale in a given month divided by the number of homes that sold in that month. It answers the following question: If no more homes came on the market for sale, how long would it take for all the existing homes on the market to sell given the current level of demand?
The higher the MOI, the cooler the market is. A balanced market (a market where prices are neither rising nor falling) is one where MOI is between four to six months. The lower the MOI, the more rapidly we would expect prices to rise.
While the current level of MOI gives us clues into how competitive the market is on-the-ground today, the direction it is moving in also gives us some clues into where the market may be heading.
While below a very competitive 1 MOI since last year, house inventory in the Toronto area increased to 1.6 MOI in April.
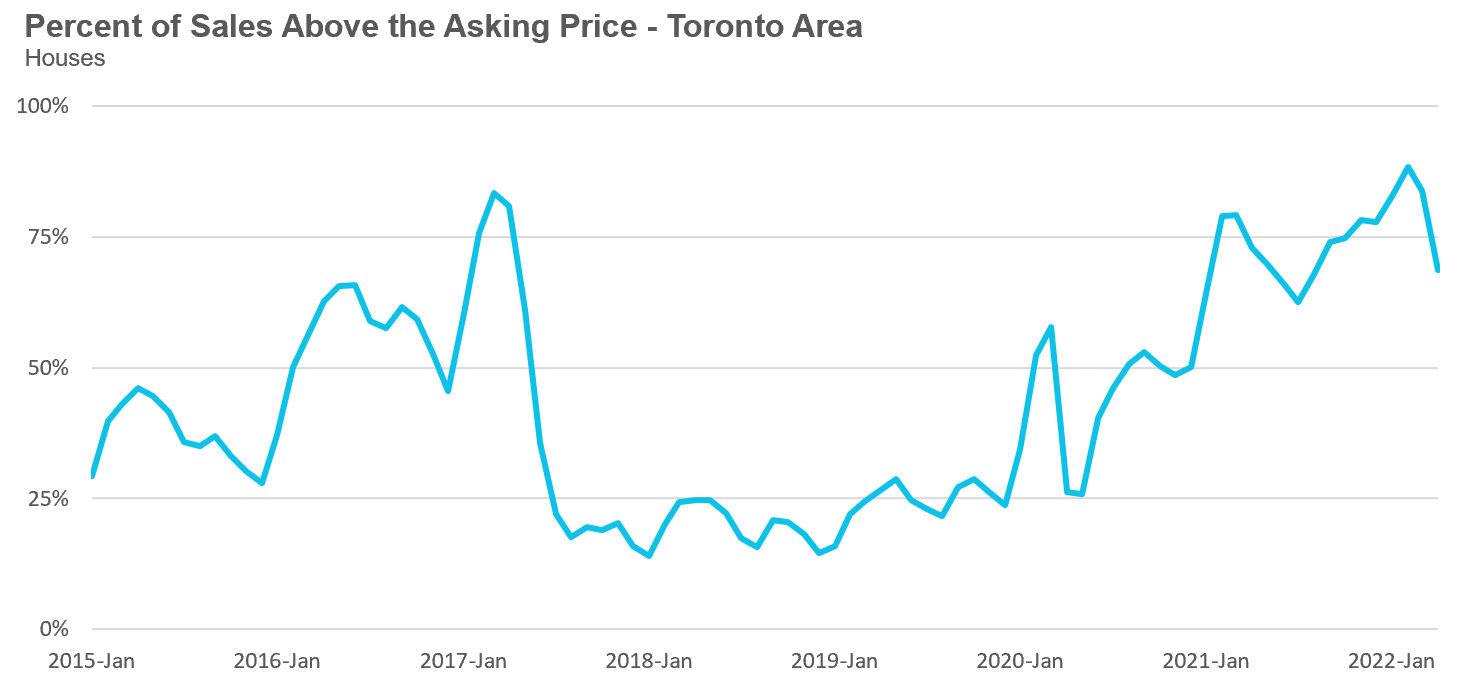
The share of houses selling for more than the owner’s asking price declined to 69% in April.
The average price for a house declined month-over-month to $1,527,743 in April 2022 and is well below the peak of $1,679,429 reached in February. Compared to last year, the average price in April is up 17%.
The median house price in April was $1,348,940, up 18% over last year, but below the peak of $1,485,000 reached in February.
The median is calculated by ordering all the sale prices in a given month and then selecting the price that is in the midpoint of that list such that half of all home sales were above that price and half are below that price. Economists often prefer the median price over the average because it is less sensitive to big increases in the sale of high-end or low-end homes in a given month which can skew the average price.
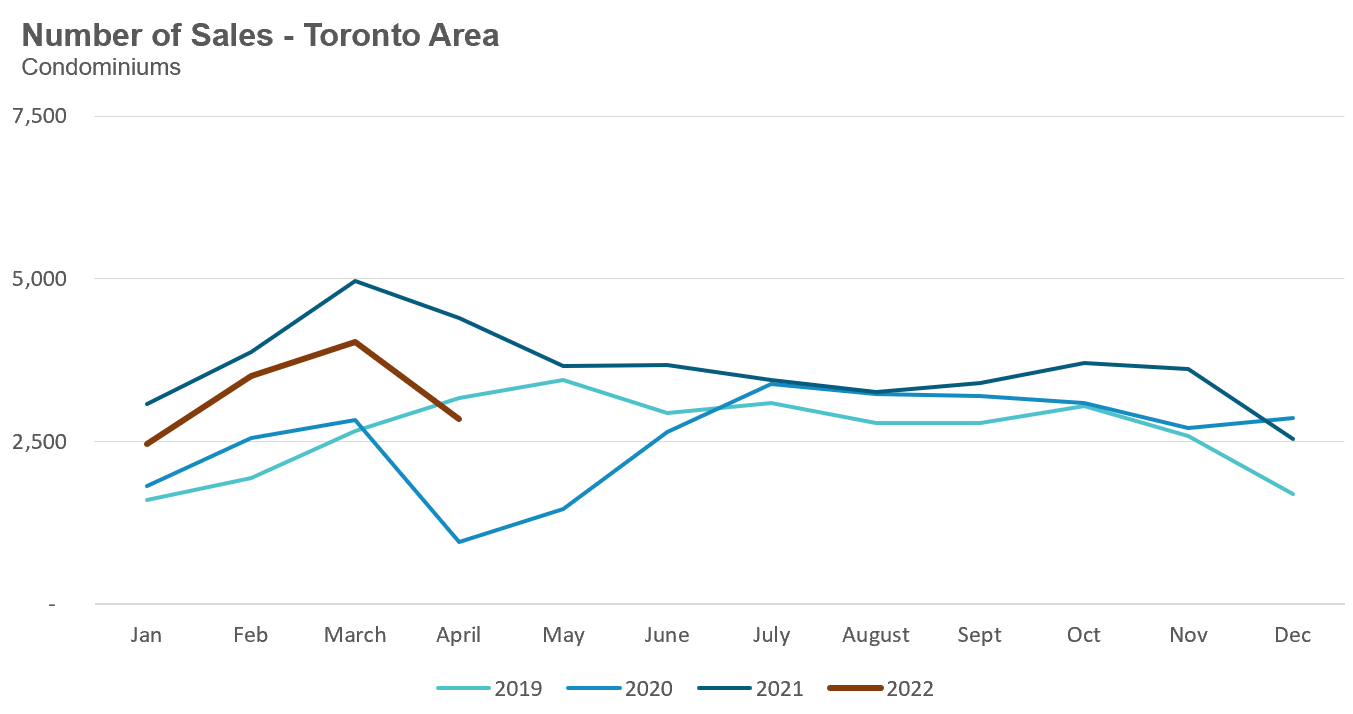
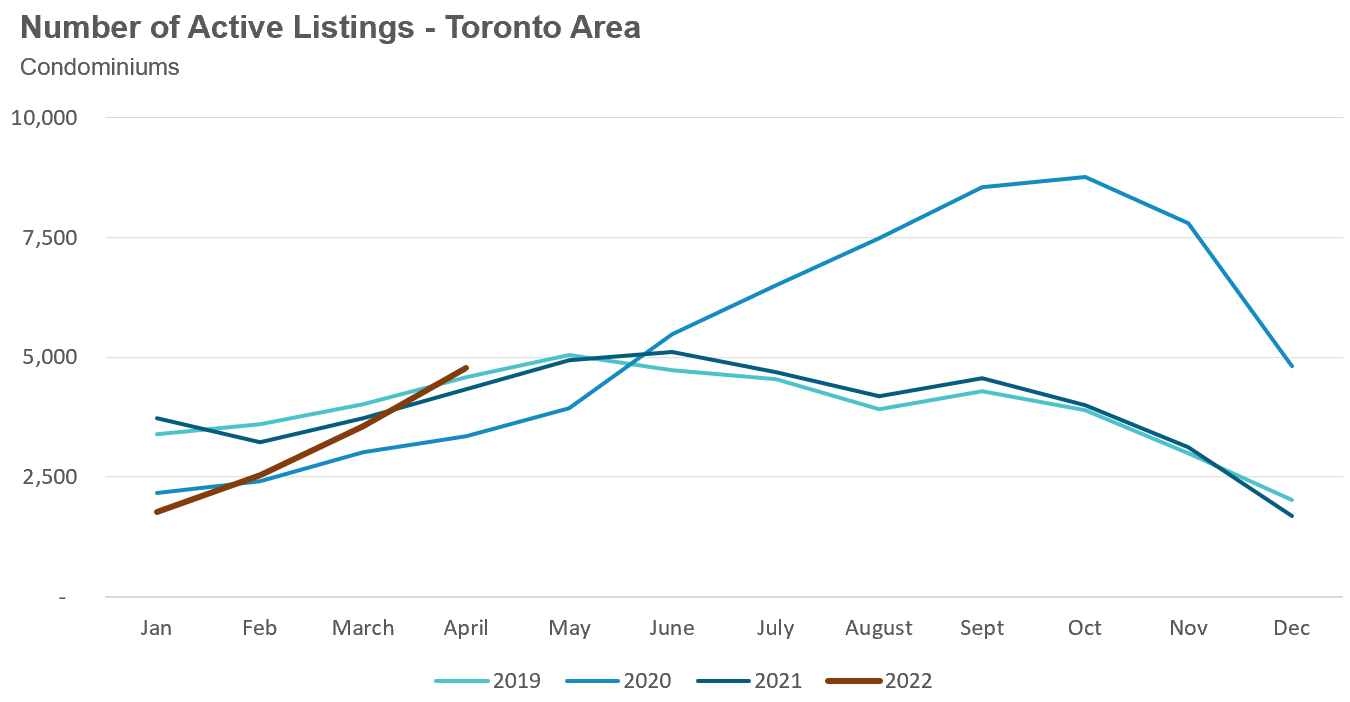
Condo (condominiums, including condo apartments, condo townhouses, etc.) sales in the Toronto area in April 2022 were down 35% over last year and below pre-Covid sales volumes in 2019.
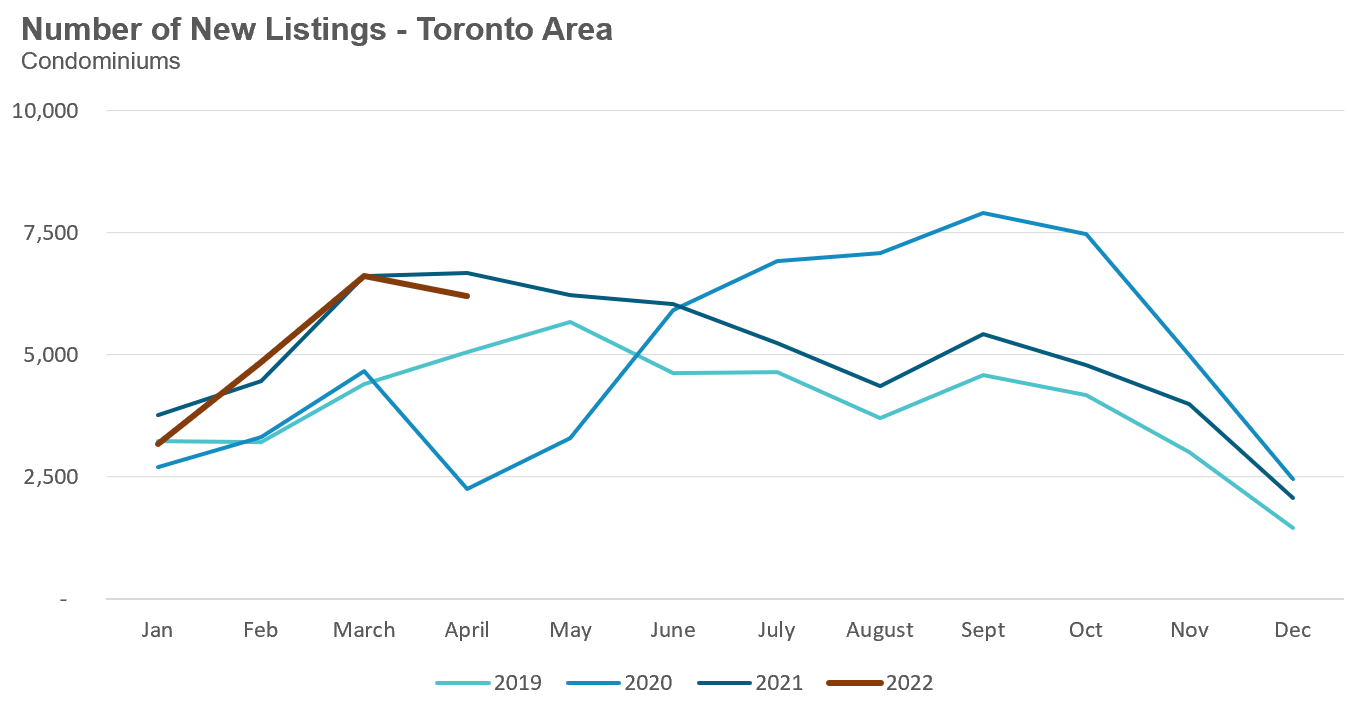
New condo listings were down 7% April over last year and well ahead of the listing volume in 2019 and 2020.
The number of condos available for sale at the end of the month, or active listings, was up 10% over last year.
The MOI increased to 1.7 in the month of April.
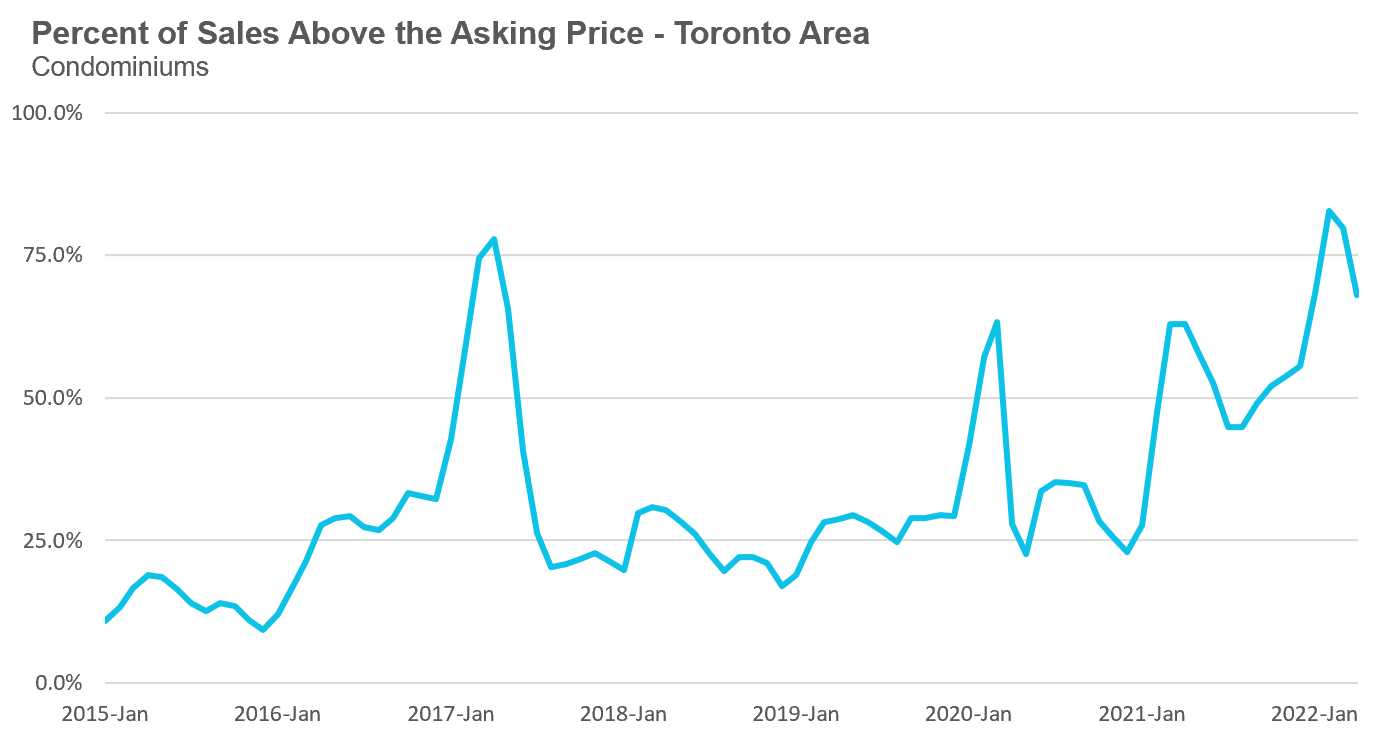
The share of condos selling for over the asking price declined to 68% in April.
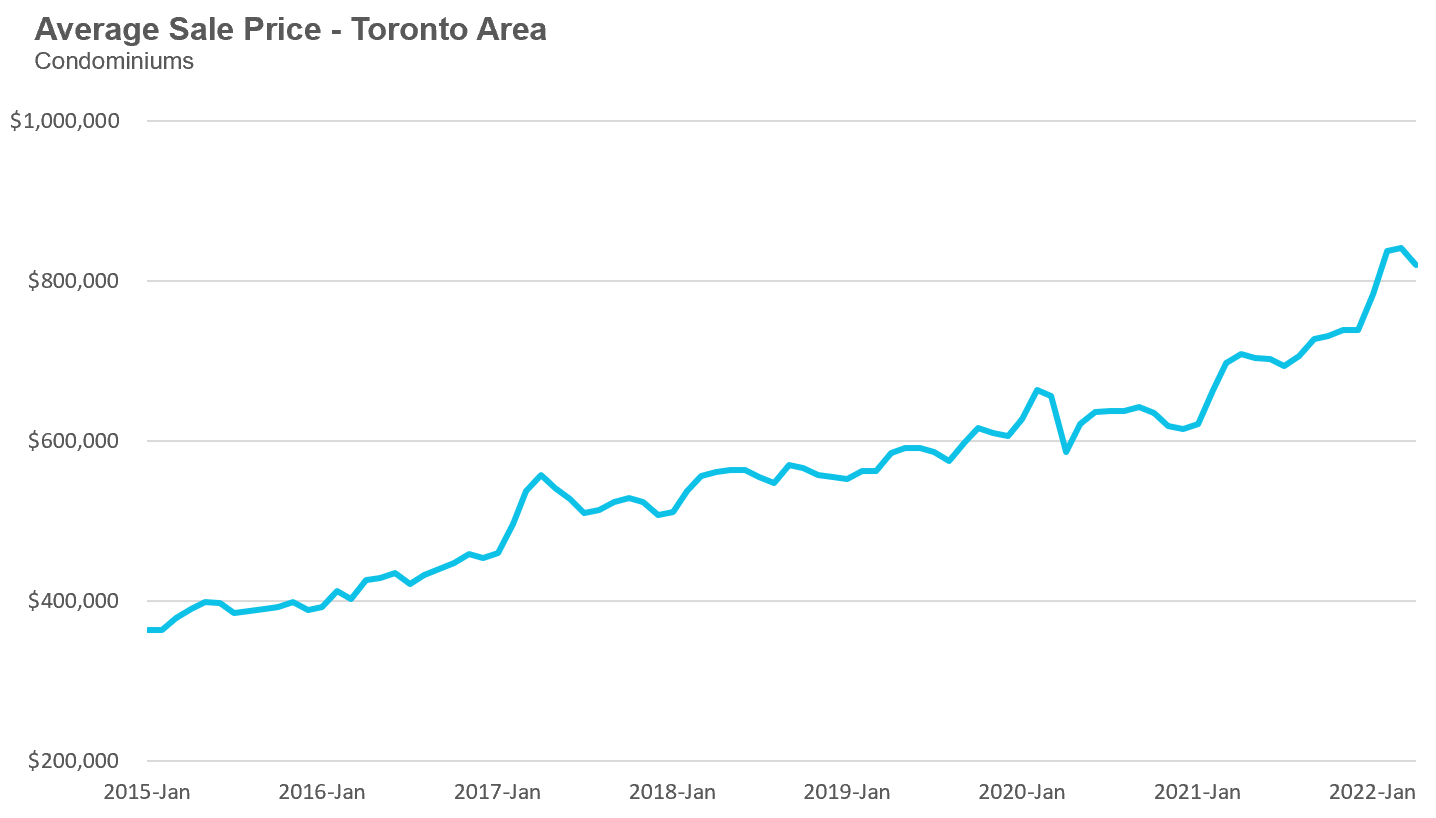
The average price for a condo in April fell to $819,698, down from $840,444 in March. The average price is up 16% over last year. The median price for a condo in April was $750,000, up 16% over last year, but down from $777,000 over last month.
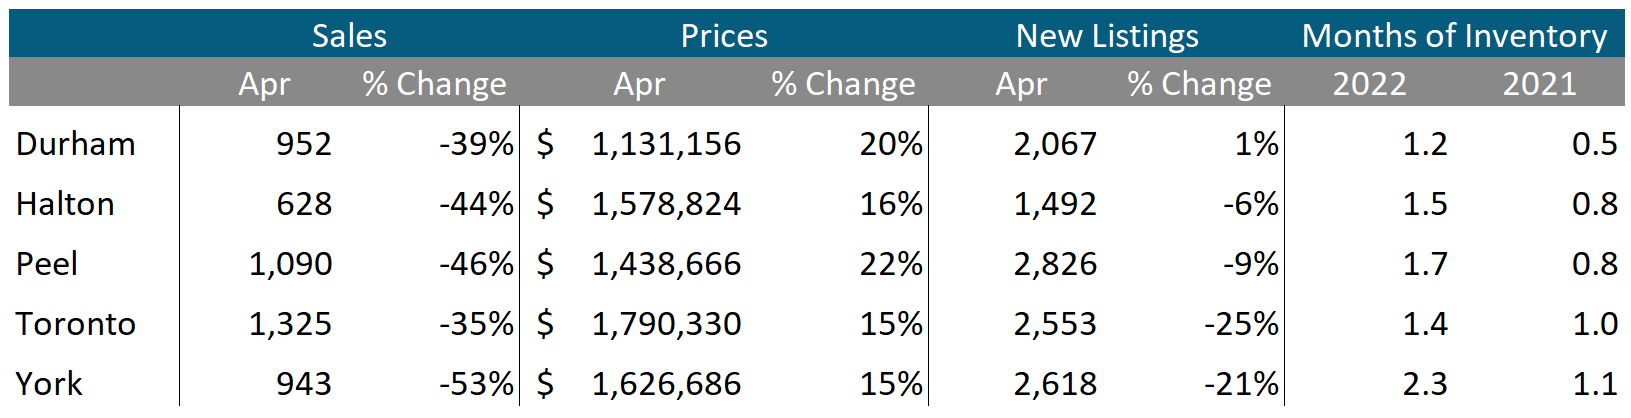
Houses
While average prices were up on a year-over-year (YOY) basis across all five regions in the GTA, sales were down significantly and inventory levels were well ahead of last year’s level, indicating some market slowing.
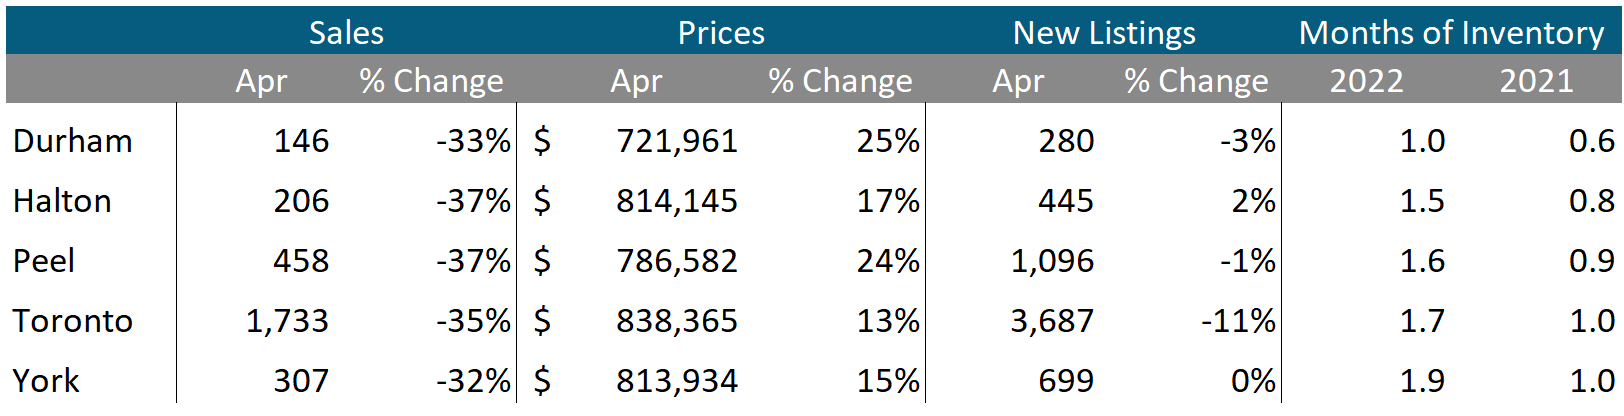
Condos
While condo sales were down across the GTA, average prices continue to be up double digits in all five regions. Current MOI levels are at or above 1 across the GTA signalling a slowing market.
See Market Performance by Neighbourhood Map, All Toronto and the GTA
Greater Toronto Area Market Trends
GET MORE DATA
This monthly Move Smartly Toronto Area Real Estate Market Report is powered by Realosophy Realty. Get the same up-to-date Toronto area market data on realosophy.com and additional information on every home for sale, including building permit history, environmental alerts and more when you buy a home with Realosophy Realty.
