What Makes it a Bubble?
How is Today’s Bubble Different from the 2017 Bubble?
How is This Bubble Going to End?
Keeping an Eye on the Market
House sales (detached, semi-detached, townhouse, etc.) in the Toronto area in January 2021 were up 36% over the same month last year.
Toronto’s Different Housing Markets
Average house prices in the Greater Toronto Area were up 16% in January but this aggregate trend is masking the different dynamics of the market based on house type and geography.
A House Bubble in the Burbs
Our feature story this month looks at the bubble-like conditions for suburban houses in the GTA. The year-over-year change in average price ranges from a low of a 29% increase in Peel Region to 35% in Durham Region.
Average prices in January were up 16% over the past two months alone with median prices up 14% during the same period.
Suburban Condos
The suburban condo market is showing signs of strength with sales surging over 50% in York, Peel and Halton. New listings were up as much as 34% in Peel but the additional supply wasn’t enough to cool the market.
Inventory levels remained low at roughly 1 month of inventory and prices were up approximately 5% over last year.
City of Toronto Houses
House sales in the City of Toronto were up 36% over last year while new listings were up 15%. Despite the strong demand and tight inventory levels (1.3 Months of Inventory (MOI)), Toronto’s housing market hasn’t seen the same froth as the suburbs.
House prices are still up an aggressive 15%, but this is still well below the 30%+ rate of growth in house prices in the suburbs.
City of Toronto Condos
Demand for Toronto condos has been exploding the past two months with sales up 82% in January 2021 over last year. New listings were up 49% in January, but strong demand pushed inventory levels down to just 1.3 MOI.
Average prices for condos in Toronto were down 6%, but this is a lagging indicator. The price declines in Toronto condos happened over the past six months, but this is the first time we are comparing today’s lower prices against the lofty prices reached in the first quarter of 2020.
On a month-over-month basis, Toronto condo prices have remained relatively flat, but may very well accelerate if demand continues to outpace supply.
What Makes it a Bubble? How is Today’s Bubble Different from the 2017 Bubble? How is This Bubble Going to End?
Toronto's Suburban Housing Bubble
Two months ago, I wrote about bubble-like conditions in Toronto’s suburban housing market.
At the time, house prices were appreciating by 15 to 20% per year and there were plenty of signs that things were going to get even hotter. Many houses for sale were receiving upwards of 20 to 30 offers from buyers and the prices that buyers were paying were starting to look irrationally high. When looking at the actual sales and inventory data, all signs were pointing to a market that was going to get hotter in the next few months with no signs of cooling.
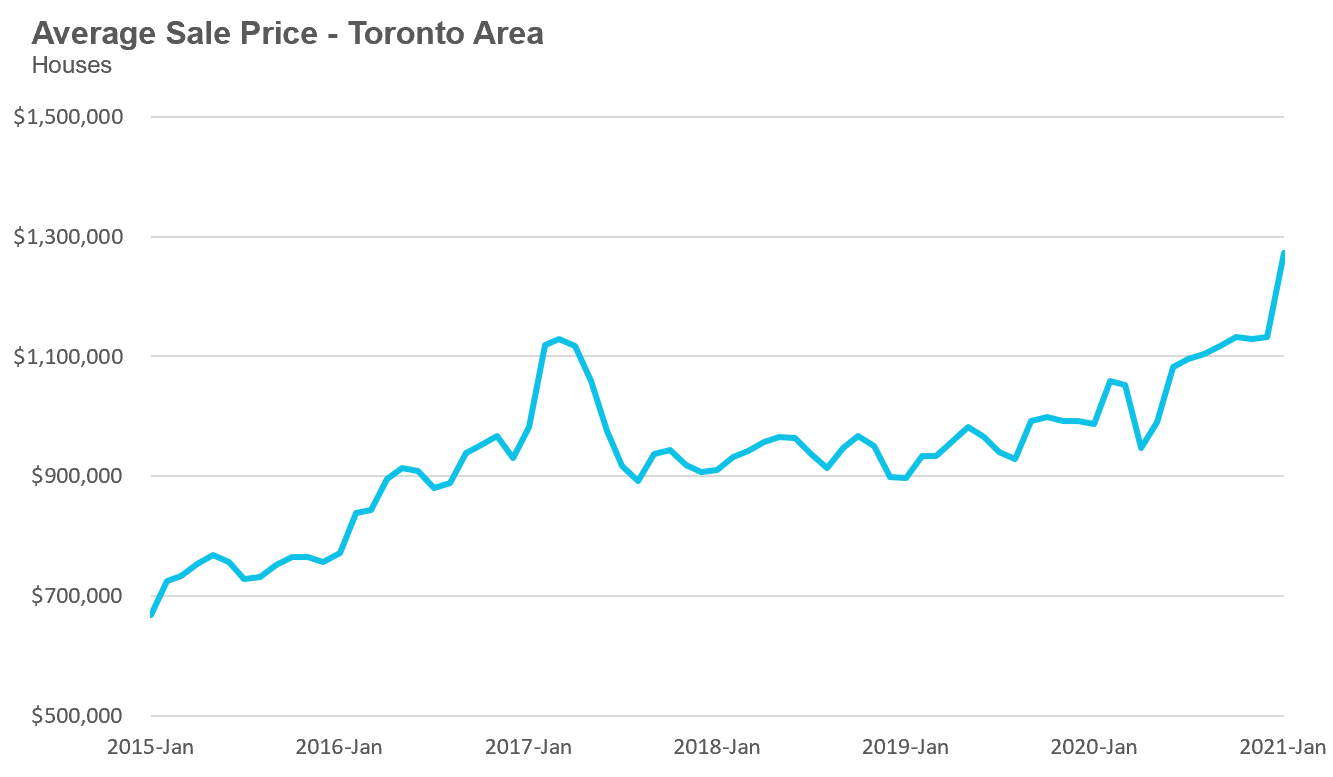
Unfortunately, this is precisely what happened. In the two months since that report, average sale prices for suburban homes have surged 16% from $1,052,940 in November 2020 to $1,221,092 in January 2021. Median prices are up 14% over the same period.
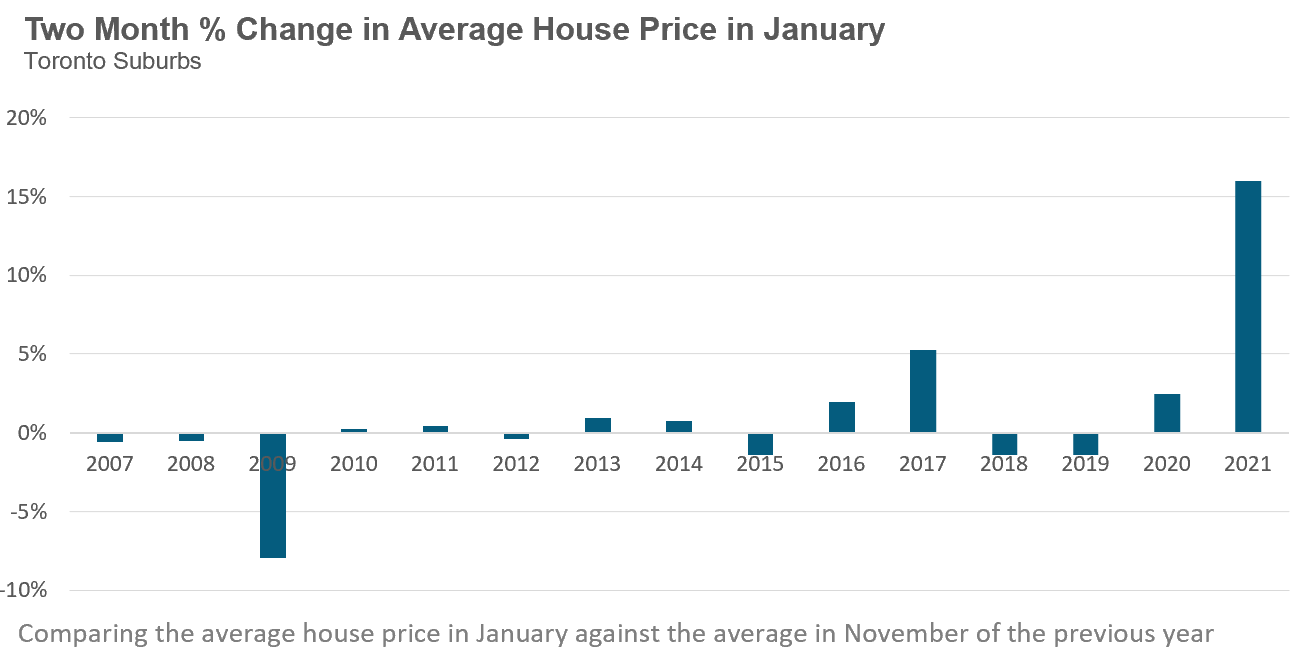
While we don’t typically compare house price changes on a month-over-month basis because seasonal differences can impact the average, it’s worth noting that average prices rarely change very much during the two months from November to January.
Below is a chart showing the 2 month change in average house price for suburban houses between November and January since 2007. You’ll note two outliers in the trend (aside from last month). The decline in 2009 was during the financial crisis and the 5% increase in 2017 was leading up to the peak of Toronto’s last real estate bubble.
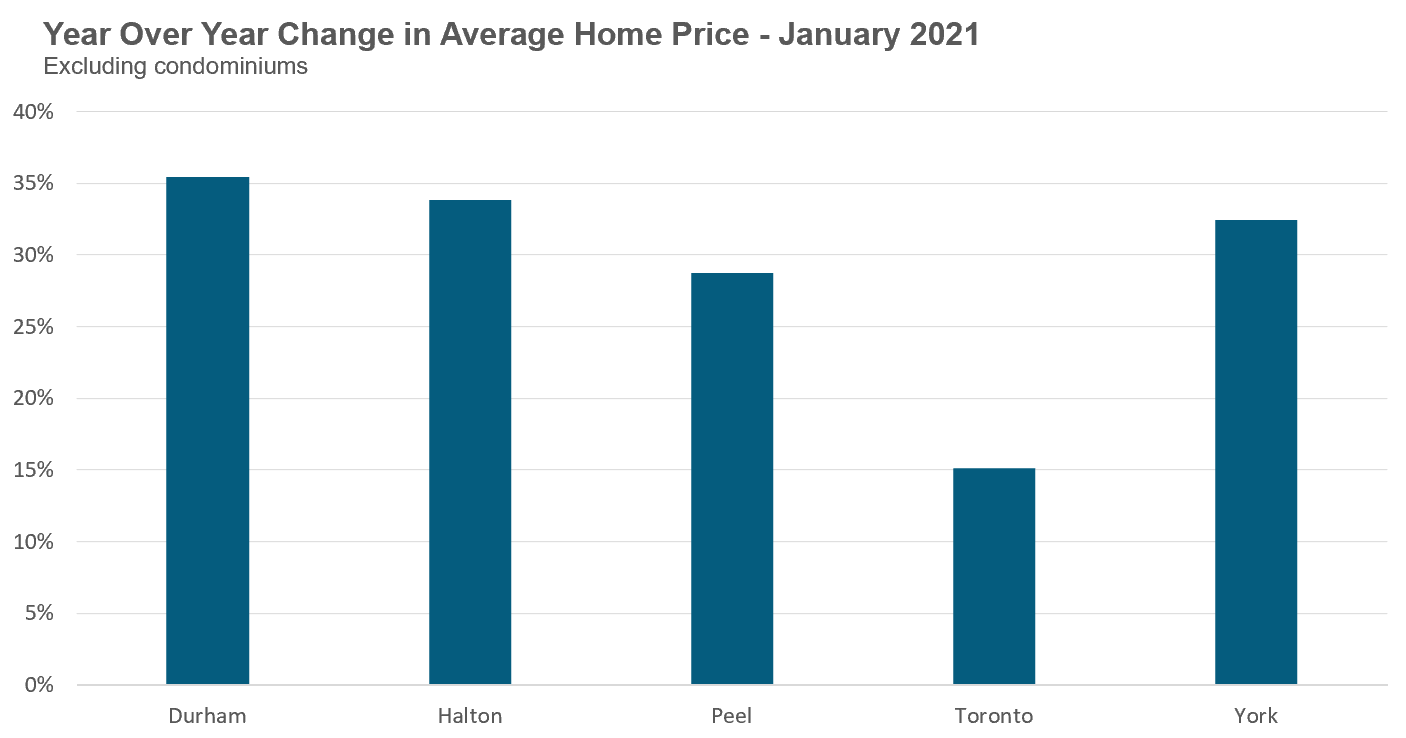
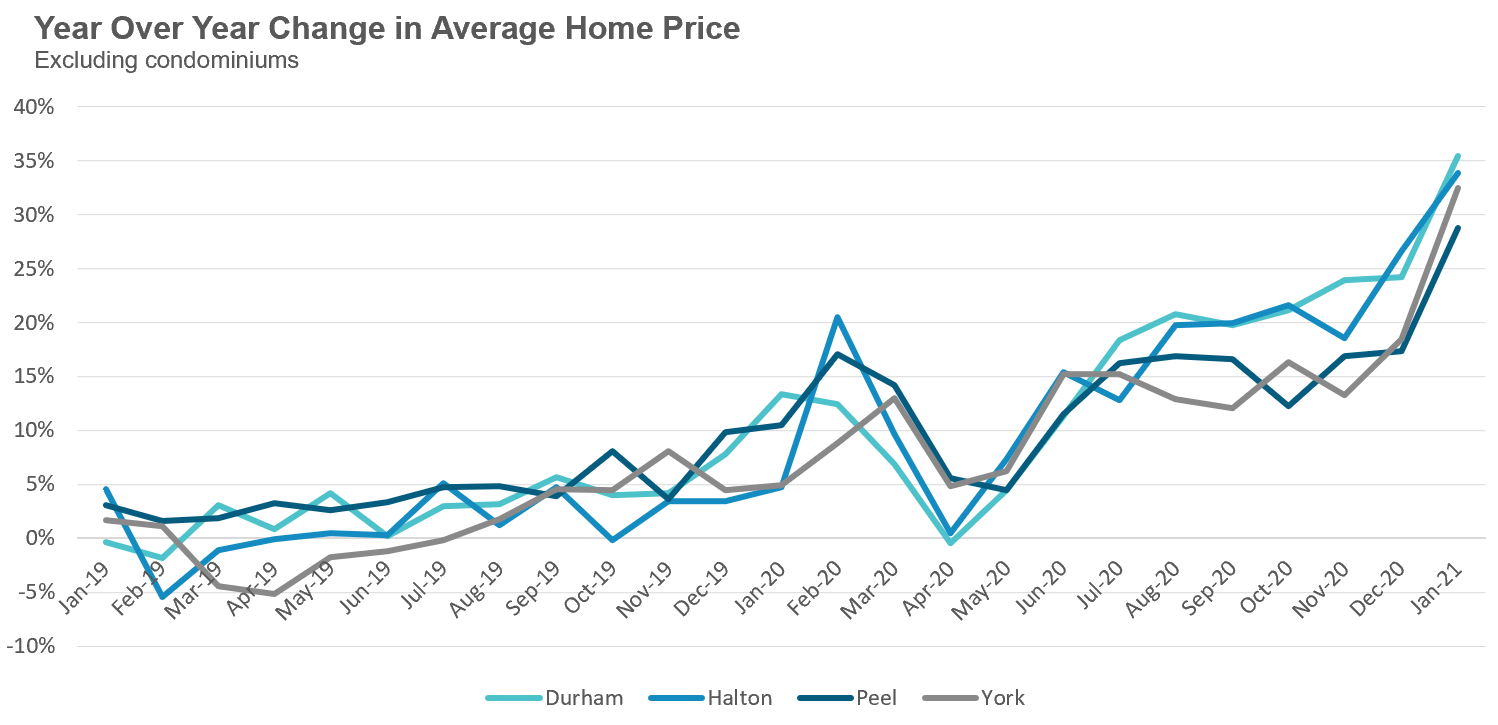
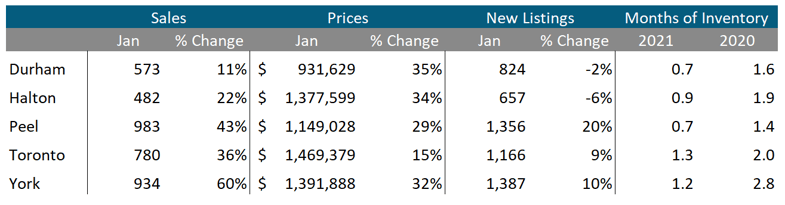
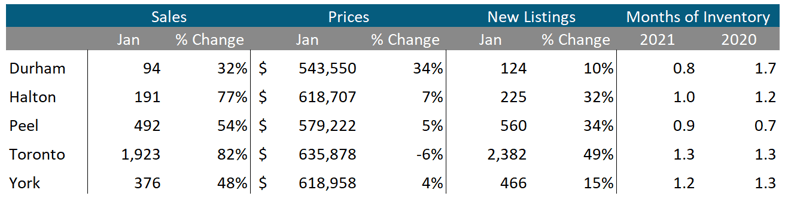
When comparing average sale prices in January 2021 on a year-over-year basis we see that average prices in Toronto’s suburbs were up by over 30% in Durham, Halton and York regions and by 29% in Peel Region. Prices in the City of Toronto were up a more modest 15%.
Suburban house prices have been accelerating since the first quarter of 2020 and after hitting a short pause during the spring lockdowns continued their trend up.
What Makes it a Bubble?
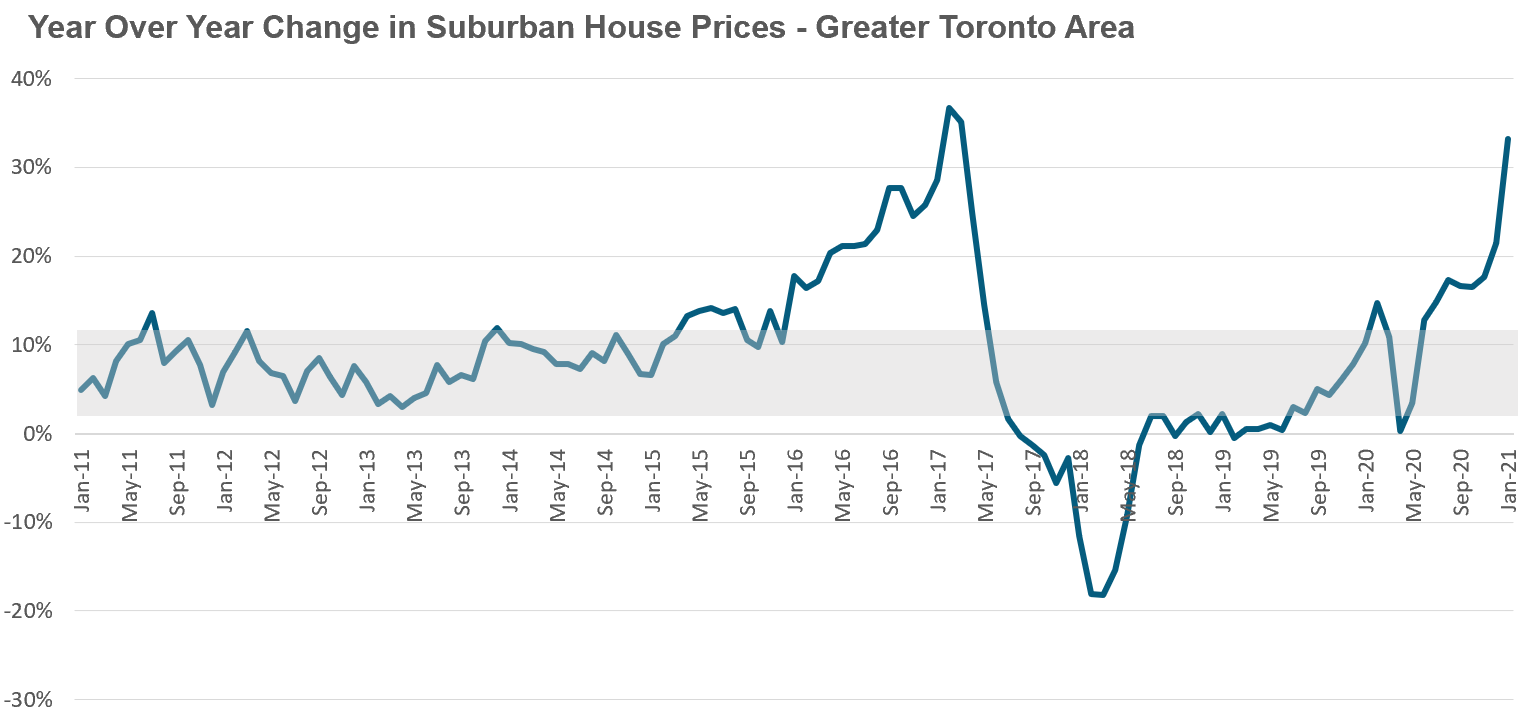
Let’s assume for a moment that the grey band represents the long term appreciation range for suburban house prices. Minor deviations from this range, like in late 2018 and early 2019 when price growth was below the range is not particularly alarming and can be caused by policy changes that tighten mortgage lending, for example.
How is Today’s Bubble Different from the 2017 Bubble?
In 2017, I published a report that argued that a key factor behind the acceleration in house prices in 2016 was a surge in demand from investors who were buying single family houses in the suburbs in order to rent them out.
Today’s bubble is quite different. Firstly, the demand for suburban houses to date appears to be, based on anecdotal observations, largely driven by end users rather than investors.
While COVID-19 cooled the market in the second quarter of 2020, it also supercharged the demand for houses in the suburbs once buyers reentered the market in June and July.
This demand surged because of a shift in preferences from home buyers and homeowners as a result of the need to work and school from home due to the pandemic; urban homes and small condominiums became less desirable and buyers suddenly wanted larger houses that had enough room for home offices and plenty of space inside and out for families to use.
This pandemic-induced demand introduced a new wave of buyers who were not previously looking to buy a home and their decision to leave the city amplified demand for houses in Toronto’s outer suburbs.
In fact, out of the top ten fastest appreciating neighborhoods in the GTA in 2020, nine were in the suburbs and four of them were in rural areas where lot sizes were frequently measured in acres not feet.
Another key factor driving demand was a decline in mortgage rates. In early 2020, buyers were paying just under 3% interest on their mortgage while today’s home buyers can get a mortgage in the 1.5% range. This drastic decline in borrowing costs has made the carrying costs of owning a home much lower - provided you have a down payment big enough to get into the market in the first place.
Another big difference with today’s suburban housing bubble is that the acceleration in house prices has been far more rapid than it was in 2016.
One way to see this is to consider how many months it took for house prices to appreciate by single digits to over 30%. In 2017, it took 25 months — this year it took just eight months.
While the single digit price growth in April and May 2020 was largely due to the COVID lockdowns, it’s still noteworthy that the market went from a virtual standstill with practically no price growth to over 30% growth in just eight months.
It is this rapid acceleration that has seen the return of a particular species of investors that haven’t been seen in some time - house flippers!
When I say house flippers, I don’t mean the type one might see on HGTV where enterprising real estate entrepreneurs buy a fixer upper, renovate it and then try to sell it for a profit.
I mean the type of flippers that buy homes, do absolutely nothing to them and then sell them 6 to 9 months later for a big profit.
This type of speculation is only possible because of the rapid acceleration in prices we have seen over the past few months. It’s very common to see these investors selling their properties for 20 to 25% more than what they purchased them for 6-9 months earlier - without doing any work to the property.
Because real estate is a highly leveraged investment (buyers only need to invest 5-20% of the value of the house as a down payment and borrow the rest), after deducting the transaction costs on these flips many of these investors are more than doubling their initial investment. .
I suspect that many of these flippers came about their windfall accidentally - they likely did not buy with the intention of flipping their properties in a very short period of time without doing any work to the property. In some cases, these flippers bought with the intention of renting the house, but when they were unable to find an acceptable tenant opted to cash out and sell their property. In other cases, they may have intended to renovate and flip, but decided it would be easier and more lucrative to flip the house without investing any money in it.
It’s also worth noting that properties being flipped (with or without renovations done to them) make up a relatively small share of the market today. In January 2021, roughly 6% of all the houses that were listed for sale in the suburbs were bought during the previous 12 months, up from 4% a year ago.
But I suspect this trend may accelerate as we head into the spring market for a couple of reasons.
Firstly, these first flippers made a significant amount of money in a very short period of time and that’s the spark that is needed to fuel more investors to want to do the same thing.
It’s helpful to consider economist Robert Shiller’s definition of a housing bubble to see how word of mouth and investor success stories amplify the exuberance in the market.
“A situation in which news of price increases spurs investor enthusiasm which spreads by psychological contagion from person to person, in the process amplifying stories that might justify the price increase and bringing in a larger and larger class of investors, who, despite doubts about the real value of the investment, are drawn to it partly through envy of others’ successes and partly through a gambler’s excitement.”
- Robert Shiller
The second reason is that we are in the middle of a booming housing bubble that investors believe the government will do everything in their power to keep going.
In a normal market, policy makers would typically be concerned to see house prices rising by over 30% per year and at a minimum would caution markets of the risks of this type of acceleration and that measures may be introduced in the future to cool the market.
In short, the message investors would normally get from governments is that they don’t like the trend they are seeing and they may step in to end it.
Things are quite different today. To start with, there appears to be absolutely no concern about the rapid acceleration we are seeing in house prices from our government or our central bank.
In December 2020, the Canadian Mortgage and Housing Corporation (CMHC) concluded that there was a low risk that house prices in Toronto were overvalued and a low risk of overheating and price acceleration. They came to this conclusion a month before suburban house prices in Toronto were up by more than 30% year-over-year.
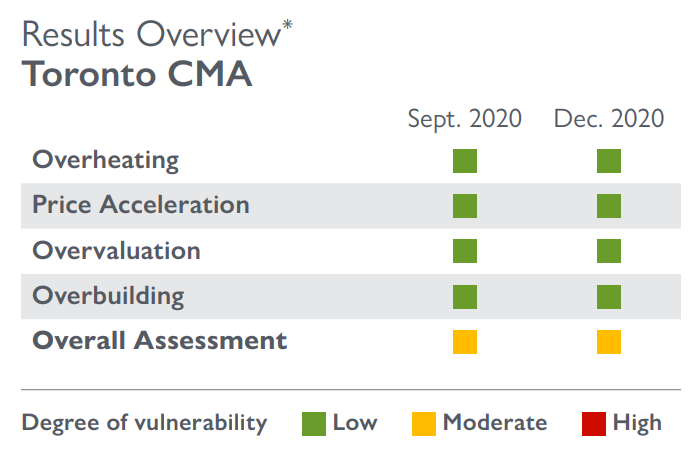
Now, in CMHC’s defence, Toronto’s housing market is made up of many different submarkets and not all are overheating. But to suggest that the risks in Toronto as a whole are low, when house prices in the suburbs were up more than 30% year-over-year a month after their report seems quite odd. What can the average home buyer take away from CMHC’s conclusions? That prices rising by 30% year-over-year in the suburbs is normal?
How is the Bubble Going to End?
Nobody has any idea how this is going to end as these things are unpredictable. That being said, I’ll share with you some thoughts on what the year ahead might look like.
Let’s tackle the most important question on the minds of most home buyers — are prices going to crash this year?
I think it’s unlikely that we’ll see prices fall in 2021.
To paraphrase economist Paul Krugman, housing bubbles don’t end with a pop but with a hiss.
What he means by that is that housing bubbles typically deflate slowly and the first signs of the bust is not a decline in prices but falling sales and rising inventory.
The suburban housing market is so far into seller's market territory that even if the number of homes for sale doubled overnight, this would not be enough to cause prices to fall - it would just slow down the rate of house price appreciation. For prices to fall, something dramatic would have to happen that would significantly cool the demand for houses and also lead to an increase in supply.
The astute reader may note that something like this did in fact happen in 2017.
While house prices in Toronto’s suburbs did fall quite rapidly in 2017, this was a relatively unique event where the introduction of a provincial foreign buyer tax led to considerable fear that home prices would fall. This caused buyers to suddenly pull out of the market just as sellers were rushing in to sell at the peak and this imbalance between demand and supply resulted in a sudden decline in prices.
This type of incident is far less likely to happen again.
This happened during a time when governments did not want to see house prices rising 30% per year and were introducing a policy designed to cool the market.
Things are different today.
Our federal government and the Bank of Canada are not concerned about the rapid acceleration in house prices and have made it quite clear that they want to keep the housing boom going and have plenty of tools at their disposal to ensure this happens.
If demand for houses begins to cool, they could follow through on their plans to relax the stress test, they could increase maximum amortization periods and they could push interest rates lower. Any one of these policy changes could bring buyers back to the market.
The one caveat to this of course is what if a rapidly cooling housing market is limited to Toronto’s suburbs while the rest of Canada’s housing market continues to boom? In a case like this, governments would be less likely to make any drastic policy changes to stimulate the housing market since doing so would overstimulate the rest of Canada’s housing markets.
So if a sudden crash in prices is unlikely to happen in the short term, what might happen?
The ideal outcome would be a gradual cooling down over the next 3 to 6 months.
We will hopefully see some of the heat come off of the housing market over the next few months as the number of new listings increases. The first two months of the year are traditionally the most competitive in the housing market because it’s when most buyers start their home search which means the number of buyers in the market is quite high, but the number of homes for sale is low.
That being said, I’m not convinced that the increase in new listings alone is enough to really cool the market. We’ll likely also need to see a decline in the demand for houses to see the market return to a more balanced level. A decline in demand can happen for any number of reasons including buyer fatigue, declining economic conditions and/or fears about the future outlook of the economy and/or housing market.
A decline in demand would take some of the heat out of the market and would ideally lead to an increase in inventory and a decline in the rate that house prices are appreciating.
As long as house prices are still rising one would hope that policy makers would not feel the need to stimulate the market by relaxing mortgage rules.
The Worst Case Scenario
Alternatively, if we see an increase in demand from real estate speculators looking to flip houses in a short period of time then the rapid acceleration we are seeing in house prices today could continue for some time.
As more and more investors jump into the market this will increase the demand for houses pushing prices higher making their investment returns a self-fulfilling prophecy -- at least in the short term.
Toronto’s housing market has all the key ingredients to make this a possible outcome:
1. Homeowners with plenty of cheap money to invest,
2. Overconfident investors who believe that home prices can only go up in the GTA.
3. A government and central bank that has made it clear they’ll do everything they can to keep the economy and housing market booming.
When I was in Dubai in 2017 to assess their housing market and policies, I heard firsthand how this type of speculative investing resulted in a more than 50% decline in prices in 2009-2010. As a result, the government began monitoring the share of properties being flipped in a short period of time and if the number surpassed a certain threshold it would trigger an automatic fee payable by the seller to discourage sellers from flipping.
This is definitely not the path we want to find ourselves on.
Keeping an eye on the market
While it’s difficult to say what direction the housing market will take over the next 6 to 12 months, there are two trends home buyers and sellers should be watching.
Firstly, you’ll want to keep a close eye on how house prices are changing on a month over month basis — not year over year.
The most common way to report changes in house prices is to compare the average price of homes in a given month this year against the average price for the same month in the previous year. The problem with focusing on year-over-year price changes right now is that even if prices remain constant over the next few months and stop increasing, the year-over-year change in prices will still be around 30%+ because we are comparing today’s elevated prices against last year’s much lower prices.
We don’t normally compare prices from one month to the next, but in rapidly changing markets you’ll want to keep a close eye on month-over-month changes to assess whether prices are levelling off or if they continue to accelerate.
My comparison of the average price change from Nov-Jan this year vs previous years is an example of the type of trend you want to keep an eye on.
The other important thing to keep an eye on is the percentage of properties being flipped in a short period of time. As I said above, if speculators start rushing into the market to make a quick profit then rapid price gains could end up being a self-fulfilling prophecy in the short-term.
While I’ll be keeping a close eye on the data behind these trends for future reports and will report any noteworthy observations, you too can keep an eye on these trends yourself.
If you are an active home buyer, you’ll want to look up the sales history for the homes you are interested in (you can see the entire sales history for houses on our website Realosophy.com). If you’re seeing more and more houses for sale that were bought within the past 12 months (without any material renovations done) then you know we are seeing an increase in speculative buying.
The other way to keep an eye on this trend is to listen to the stories your friends are sharing about investing in real estate.
I recorded a video titled Why a Dinner Party is the Best Barometer of a Housing Bubble where I discuss why word of mouth stories from friends talking about their successful real estate investments can actually tell you in real time what economists try to uncover through surveys years after a housing market goes bust.
If you start hearing more and more people talking about flipping houses in six months to make a quick six figure profit, buckle up because the road ahead for the housing market is likely to be a bumpy one.
House sales (detached, semi-detached, townhouse, etc.) in the Toronto area in January 2021 were up 36% over the same month last year.
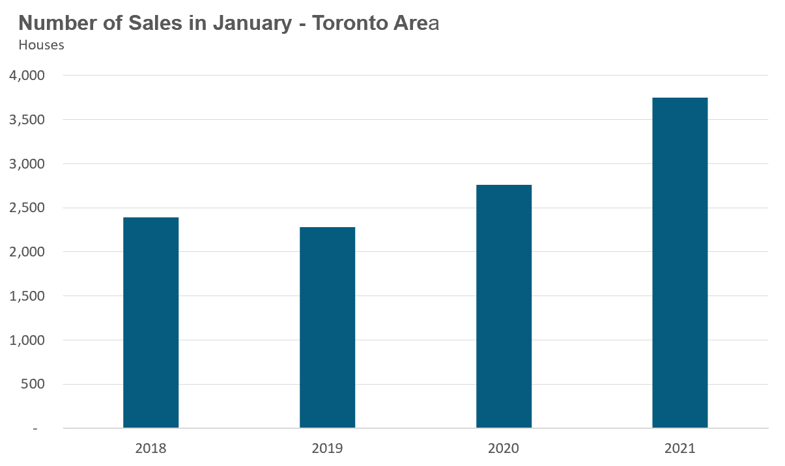
York Region showed the strongest growth in sales, up 60% over 2020.
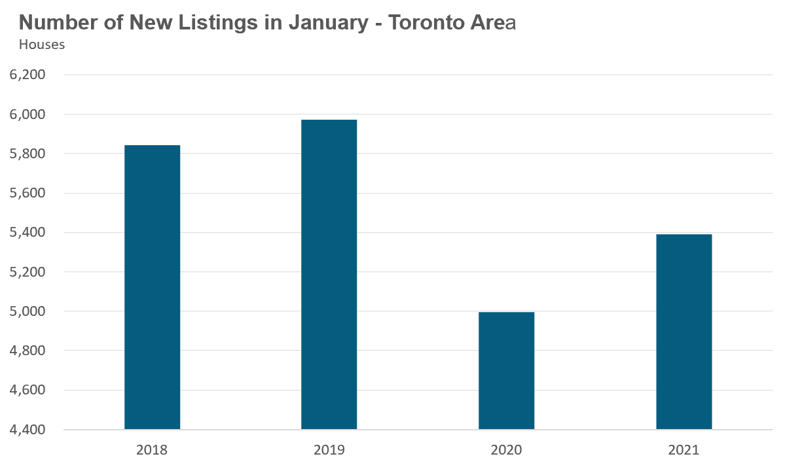
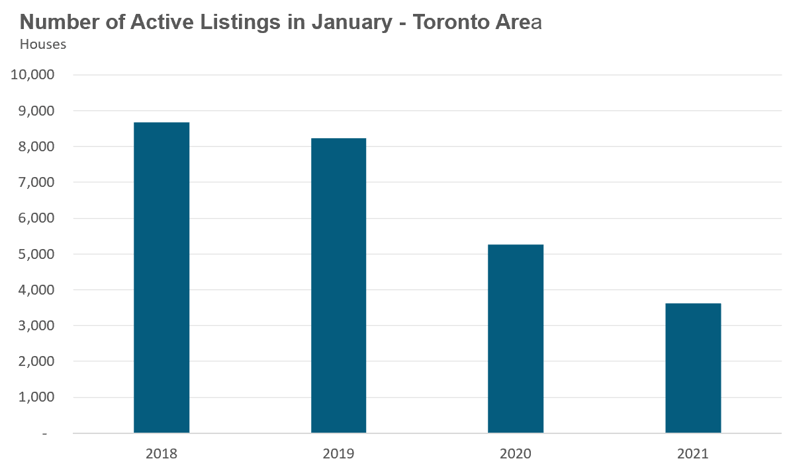
New listings did not keep up with the strong pace of demand. January saw an 8% increase in new listings over last year while the number of homes available for sale (“active listings”) was down 31% when compared to the same month last year.
The Months of Inventory ratio (MOI) looks at the number of homes available for sale in a given month divided by the number homes that sold in that month. It answers the following question: If no more homes came on the market for sale, how long would it take for all the existing homes on the market to sell given the current level of demand?
The higher the MOI, the cooler the market is. A balanced market (a market where prices are neither rising nor falling) is one where MOI is between four to six months. The lower the MOI, the more rapidly we would expect prices to rise.
The market remained very competitive in January with an MOI of just 1 month of inventory.
While the current level of the MOI gives us clues into how competitive the market is on the ground today, the direction it is moving in also gives us some clues into where the market may be heading. While the MOI is up slightly over last month, inventory is still deep in seller’s market territory.
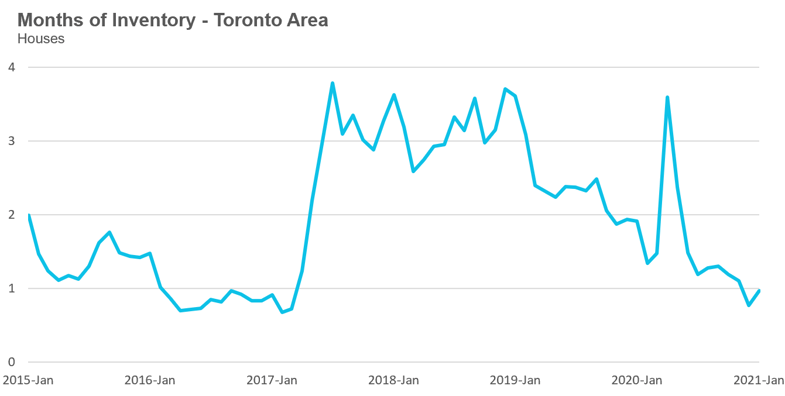
Strong demand coupled with very low inventory levels helped push average house prices up to another record high of $1.272M and up 29% over last year.
Median house prices are up by the same amount over last year.
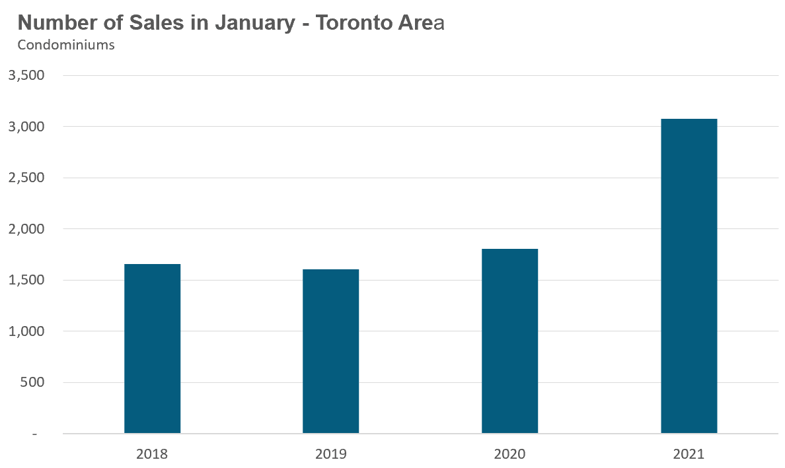
Condominium (condo) sales (condo apartments, condo townhouses, etc.) in January were up by 70% over last year led by an 82% increase in sales in the City of Toronto
New condo listings were up by 39% in January 2021 over last year while active listings were up 71% over last year.
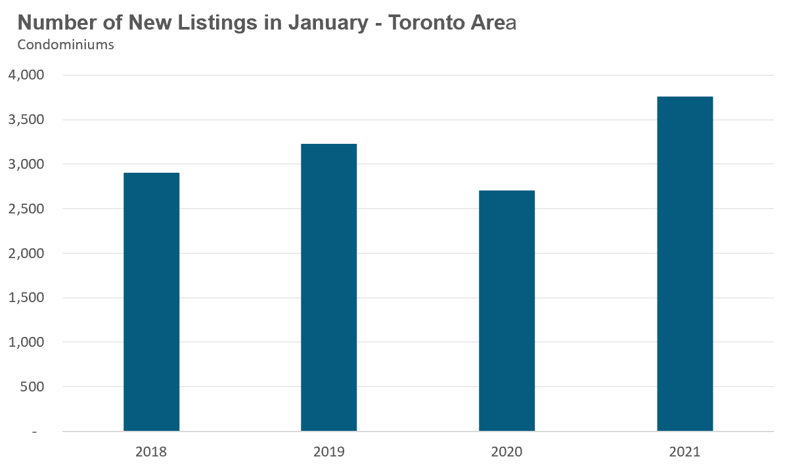
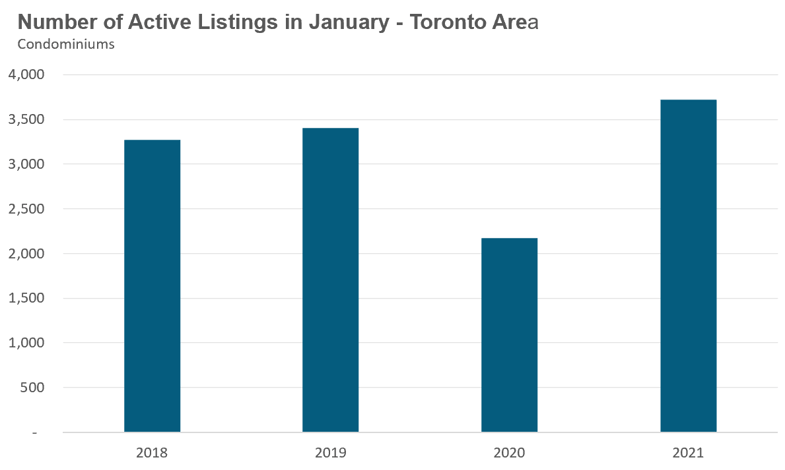
While active listings are still up over last year, the available inventory has been trending down since October when active condo listings peaked at 8,772.
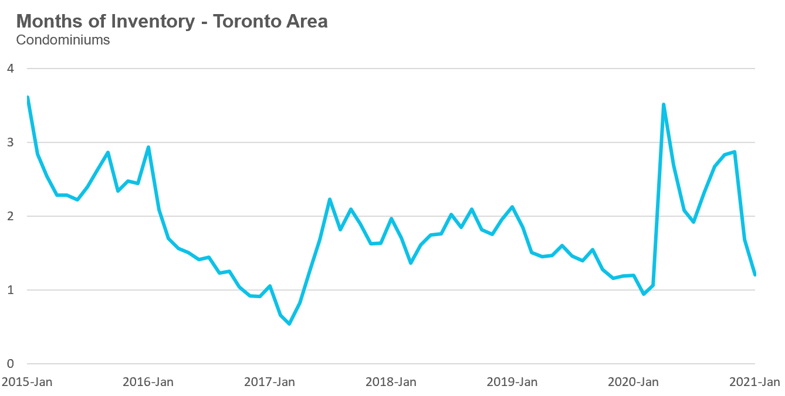
This decline in active listings is leading to a more competitive condo market with the MOI decreasing from just under 2.9 months in November to 1.2 in January.
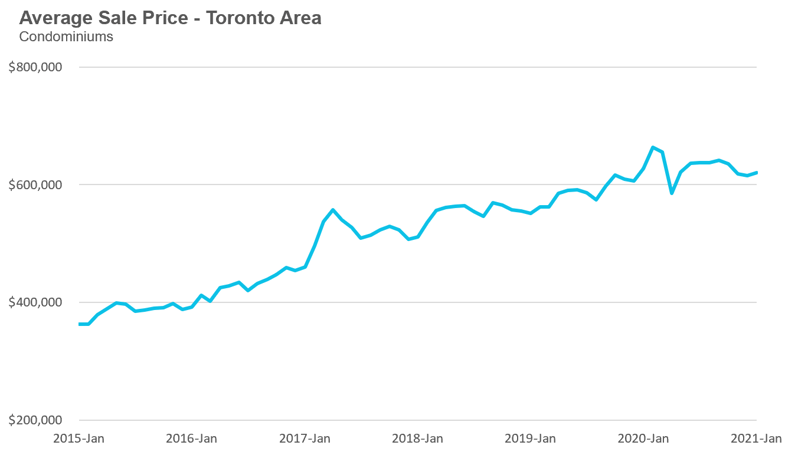
Toronto area condo prices are down 1% over last year. The decline in prices was due to the City of Toronto where prices were down 6% while suburban condo prices were up over last year.
The decline in Toronto condo prices should not be interpreted as a current trend. Condo prices in Toronto fell in the second half of 2020 but have been relatively stable over the past few months. We are seeing a decline in prices today because we are comparing today’s stable but lower prices against the peak prices reached during the first quarter of 2020.
Houses
Durham region saw only an 11% increase in sales but the strongest price growth (up 35%) because it has the most affordable and tightly supplied market with 0.7 MOI. Average prices were up 29%-35% in the suburbs while prices in the City of Toronto were up 15%. Despite the increase in new listings in Peel, York and Toronto inventory levels are at or below 1 month across the entire GTA.
Condos
Condominium (condo) sales saw a surge in sales in January across the entire GTA. Average prices were up across the suburban regions with the City of Toronto recording a 6% decline in average price.
Inventory levels are roughly at the same level as last year for all five regions.
Browse All Regional Market Trends for December 2020 on Realosophy.com:
Greater Toronto Area Market Trends
Durham Region Market Trends
Halton Region Market Trends
Peel Region Market Trends
City of Toronto Market Trends
York Region Market Trends
Market Performance by Neighbourhood Map, Toronto and the GTA