2020: The Year in Review COVID-19 Impacts on Toronto Real Estate

January2021_Monthly_Report_Cover
Download a PDF version of this guide.
Download Report

Chapters

1

2020: Year in Review — COVID-19 Impacts on Toronto Real Estate


2

2021: The Year Ahead — Heat & Hangovers for Toronto Real Estate

A Look Back at the CMHC Forecast

3

Digging Into the Data

Best Performing Neighbourhoods in Toronto & GTA — For Houses

Best Performing Neighbourhoods in Toronto & GTA — For Condos

4

House Statistics

House sales (detached, semi-detached, townhouse, etc.) in the Toronto area in December 2020 were up 62% above December 2019 volumes year-over-year.    

5

Condominium Statistics

Condominium sales (condo apartments, condo townhouses, etc.) in December were up by 68% over last year, but ended the year down 3% over last year for the year overall.

6

Regional Trends

Sales for houses and condos across the Greater Toronto Area were up in December. 

Get tomorrow's headlines, today. Sign up for special reports.

Bubble-Like Market in Q1

Any discussion about how Toronto’s housing market responded to the onset of the COVID-19 pandemic in 2020 has to start with how the market was performing before pandemic-induced lockdowns were introduced in mid-March.

As we paid relatively little attention to the reports of a new coronavirus coming out of China and impacting Italy in early 2020, the first quarter of 2020 in Toronto real estate had all the same signs of the boom times of speculative and irrational frenzy we saw several years earlier throughout the Greater Toronto Area (GTA). It was typical for houses to receive 20 to 30 offers on their offer night and to sell for significantly above market value.

Here are some of the media headlines describing the market at that time:

RBC fears Toronto’s housing market is headed for another round of froth
FOMO has returned to the Toronto housing market
Is Toronto’s housing market headed for a repeat of 2017? A supply shortfall is pushing house prices north, again

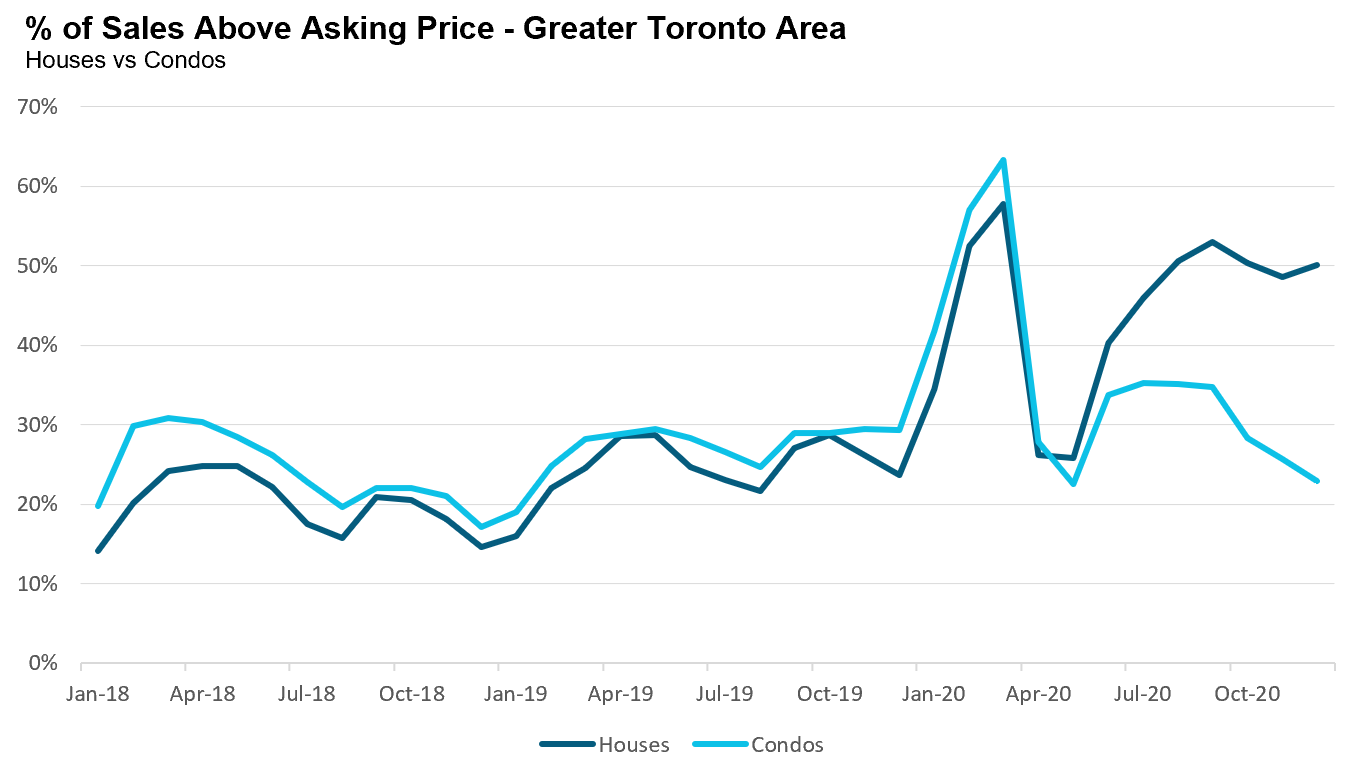
The best way to see this surge in exuberance is by looking at the % of homes that were selling for above the seller’s asking price. In 2018 and 2019, between 15-30% of houses and condos were selling for above the owner’s asking price. Then, in February and March of 2020, 50-60% of houses and condos were selling for more than the seller’s asking price.   Average prices were up 17% and 15% in February and March respectively.

1_PctAboveAsking

And then came COVID-19.

The Onset of Covid-19: First Lockdown in March

While the Province of Ontario went into a lockdown in mid-March, shutting down activity in the downtown core as office workers began to work from home and all residents were urged to stay at home as much as possible, we didn’t see the resulting impact on the real estate market until April when sales plummeted 67%; in May, sales were down 54%.

The market had, in effect, frozen. Few buyers were going out to look at houses and sellers had a very hard time selling their homes.

The Covid Forecasts

By May, most big banks and housing analysts had released their forecasts for Toronto’s housing market in light of the COVID-19 lockdowns and recession that was expected to follow. Most forecasts were expecting house prices to remain relatively flat or see a slight single digit decline. The Toronto Dominion (TD) Bank forecast of an 8% increase in house prices during the pandemic was the most optimistic.

The most pessimistic forecast came from Canada’s housing regulator, the Canadian Mortgage and Housing Corporation (CMHC), which predicted that house prices would fall by 9 to 18% from their pre-COVID-19 level.

The Bounce Back

By the time my colleagues and I decided to respond to the worried questions of real estate consumers by hosting a free, online summit in July to hear the views of top economists, housing analysts, and practitioners on where things might be heading, the market had already begun to bounce back unexpectedly quickly. Buyers re-entered the market in June, resulting in that month seeing only a 2% decline in sales compared to the previous year.

Next, the market for houses (excluding condos) returned to the frenzied pace we saw during the first quarter of 2020. By August, sales were up 40% over the previous year and more than 50% of houses were selling for more than their asking price.

This sudden rebound caught most economists and the real estate industry by surprise. There was still a considerable amount of economic uncertainty, Canada’s unemployment rate was still in double digits and hundreds of thousands of Canadians were deferring their mortgage payments. This type of economic environment Is typically not accompanied by a boom in the housing market.

Looking back, it’s clear that the rebound was driven by three main factors.

Firstly, when we look at the change in employment rates by hourly wage we see that this recession disproportionately impacted lower income earners vs. higher income earning households. The vast majority of buyers who hit pause on their home search in April never lost their job or saw their incomes decline, they just started working from home.

The second factor behind the surge in sales was pent-up demand. As noted above, Toronto’s housing market was unbelievably competitive in the first quarter of 2020 with demand far outpacing the supply of houses available. The buyers that hit pause in the second quarter with the onset of Covid-19 restrictions didn’t disappear — they were just waiting for the right moment to re-start their home search. The busy spring selling market was delayed for two months, resulting in inflated home sales in the summer which made year-over-year comparisons slightly misleading.

The third factor driving the rebound was a shift in what homeowners want in a home.     Working from home led many homeowners to value houses that had enough space for home offices, more space for kids to play in and bigger back yards.

This shift in preferences resulted in new buyers entering the market who were not looking to buy a home prior to COVID-19. This "urban exodus" saw many households sell their smaller downtown houses in favour of larger detached homes in the outer suburbs or beyond.    

This shift in buying behaviour had a bigger impact on the outer suburban markets where they were buying vs. the downtown markets they were selling in since there are relatively fewer sales in many of the outer suburban areas so even a slight increase in demand can overheat those markets.      

Decline in Rents

Given that this recession had a disproportionate negative impact on lower income earners, it’s no surprise that the rental market was hit much harder than the resale market.

By October, there were over 12,000 condominium units available for lease in the GTA — more than 3 times the number of units available the year before. In my October 2020 report, I looked at the key factors driving this surge in rental inventory and the number one factor was tenants simply moving out of their units.

In some cases, they moved because of lost jobs or income which reduced their ability to pay rent; however, in other cases, they moved back home with family due to other COVID-19 impacts. Pre-COVID, a downtown condo offered its renter a short walk to their office or school and a vibrant culture and nightlife.

After the onset of COVID, a 500 sq. ft. condo suddenly felt a bit too small to live and work in at all hours. The absence of the need to commute to work or school as such activities moved online and the city lifestyle that previously made up for the lack of space added to this push, as did concerns about the risks of COVID transmission in shared spaces like elevators and public lobbies, and in the case of those sharing with roommates, kitchens and other sharing living spaces within units.

Others sought also to mitigate the negative effects of isolating alone in lockdown as opposed to living with family. As a direct impact of COVID-19, average condo rents in the old City of Toronto (downtown) fell by a remarkable 19% by December and 10% in the GTA, something that could hardly be imagined prior to the pandemic, when high demand and high rents characterized the rental market.    

Condo Market Rebound

While demand for low-rise houses in the GTA surged in the second half of 2020, the downtown condo market in Toronto was sluggish. Inventory surged and prices fell by roughly 10% from their peak during the first quarter of 2020.

Downtown condo apartments were slow to sell with many units getting only 2 to 3 showings a week, a stunning turnaround for what was the hottest segment of the market only months earlier.

In November, our sales team at Realosophy Realty noticed a sudden surge in interest from condo investors who were eager to capitalize on the recent price declines in downtown condos. This resulted in a surge in condo sales in December (up 75%) and Months of Inventory (MOI) levels tightening from 2.9 in November to 1.7 MOI in December.

This surge in investor demand is interesting given that the rental market remains sluggish and rents remain down. But investors tend to be an optimistic bunch and they believe that the rental market, and rents, will be back to normal in no time and that condo prices will also rebound in 2021, so they are motivated to buy for less now while they can.

The Mortgage Deferral-Cliff has Come and Gone

As part of the response to the unprecedented economic shutdown necessitated by the onset of COVID-19 in March, banks allowed homeowners who were negatively impacted financially to defer their mortgage payments for up to six months. By the end of May, 12% of all mortgages were in deferral and CMHC predicted that this number could reach as high as 20% by September.

By October/November, the hundreds of thousands of households that deferred their mortgage payments for six months would have to start re-making payments again, resulting in what has been termed a “deferral-cliff”. The concern in the summer months was whether households would be able to start making their payments again or whether banks would need to starting working with financially distressed households, unable to hang onto their homes.

But by the end of the year, it looked like the deferral cliff wasn’t much of a cliff after all. The big banks reported that the vast majority of households that were deferring their mortgage payments were back on track with their payments after the deferral period ended.  

It turned out that some households deferred their mortgage payments as a precaution due to the fear of — rather than the actual experience of — financial hardship.  

Bubble-Like Conditions for Houses

As I noted in my December 2020 report, the market for single-family houses (not condo s) is showing alarming bubble-like symptoms reminiscent of what we saw in 2016 and 2017 in the GTA.

Not only is the GTA’s suburban housing market very competitive today with prices up more than 20% in some regions, like Durham and Halton, but the market keeps getting hotter with every month that passes.

It’s the combination of the velocity (a hot housing market today) and the acceleration in the market (a market that keeps getting hotter) that is concerning.

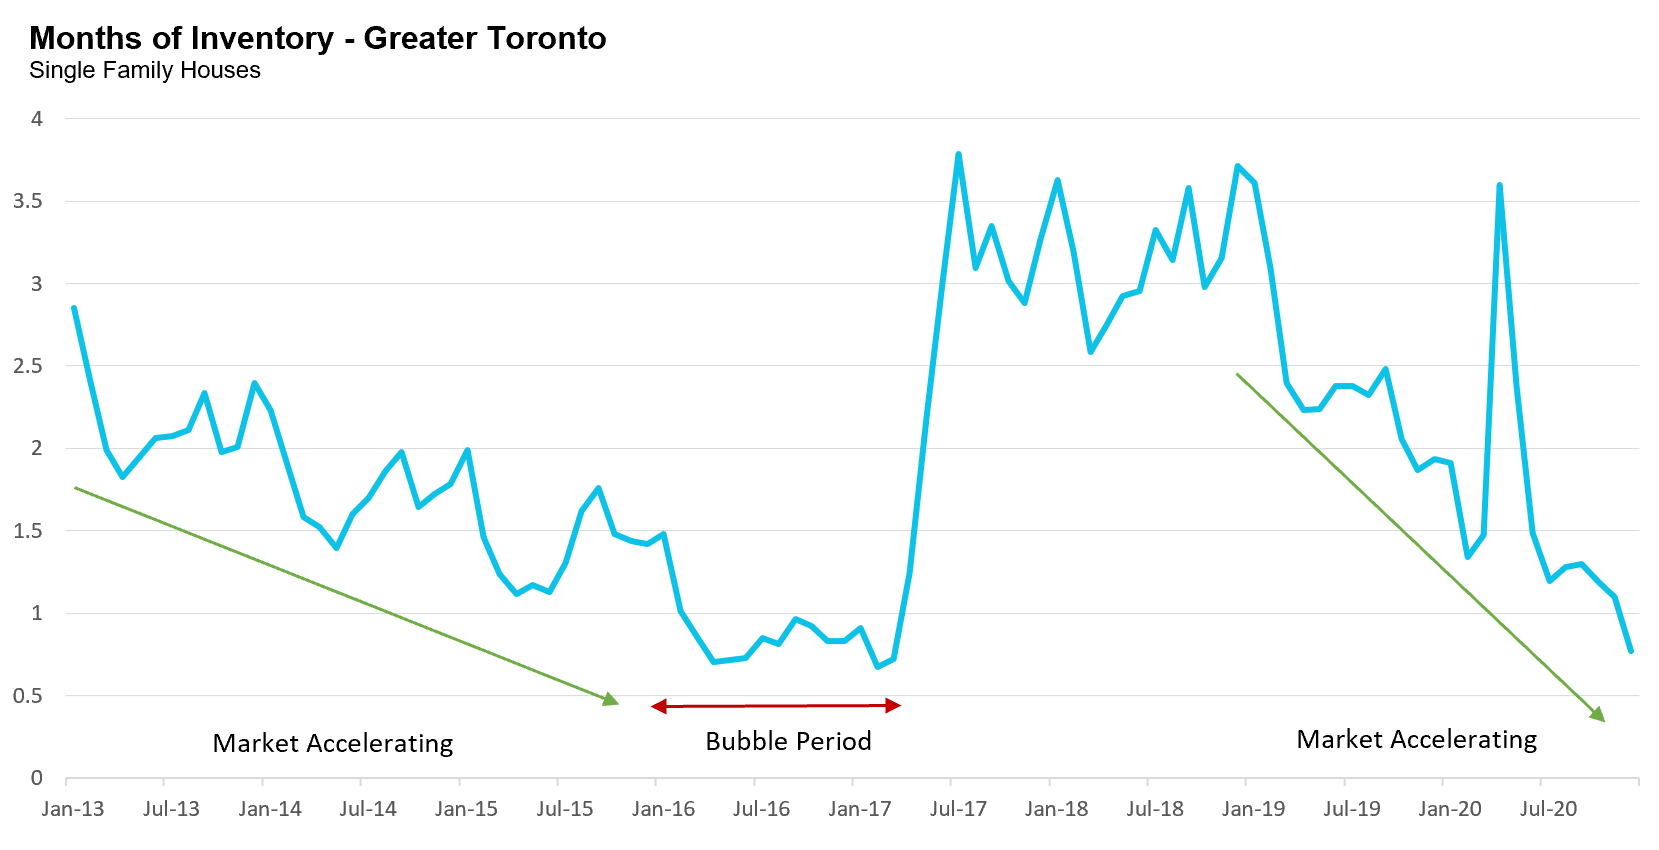
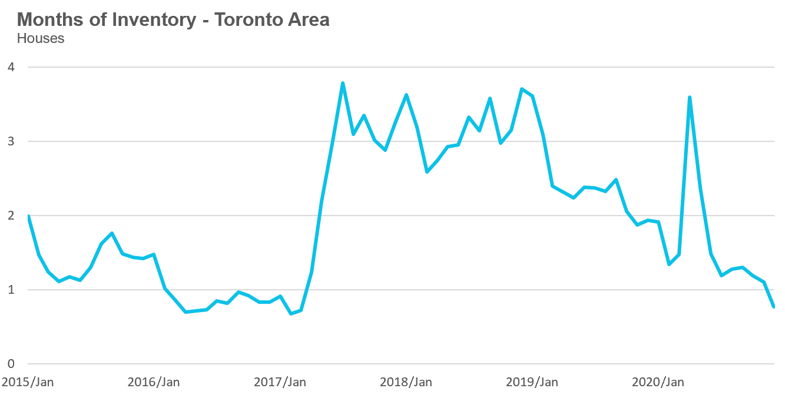
After GTA home prices fell in 2017, the GTA housing market remained relatively stable for 18 months with roughly 3 months of inventory. But since 2019, inventory has plummeted from 3.6 MOI in Jan 2019 to under one month in December 2020.

2_MOI_YearAhead

MOI levels are important because they are highly correlated with changes in house prices. We can see this by plotting the year-over-year change in average prices against the inverse of MOI (to make the relationship positive rather than negative) which is called the Sales-to-Inventory ratio.

3_PriceMOI

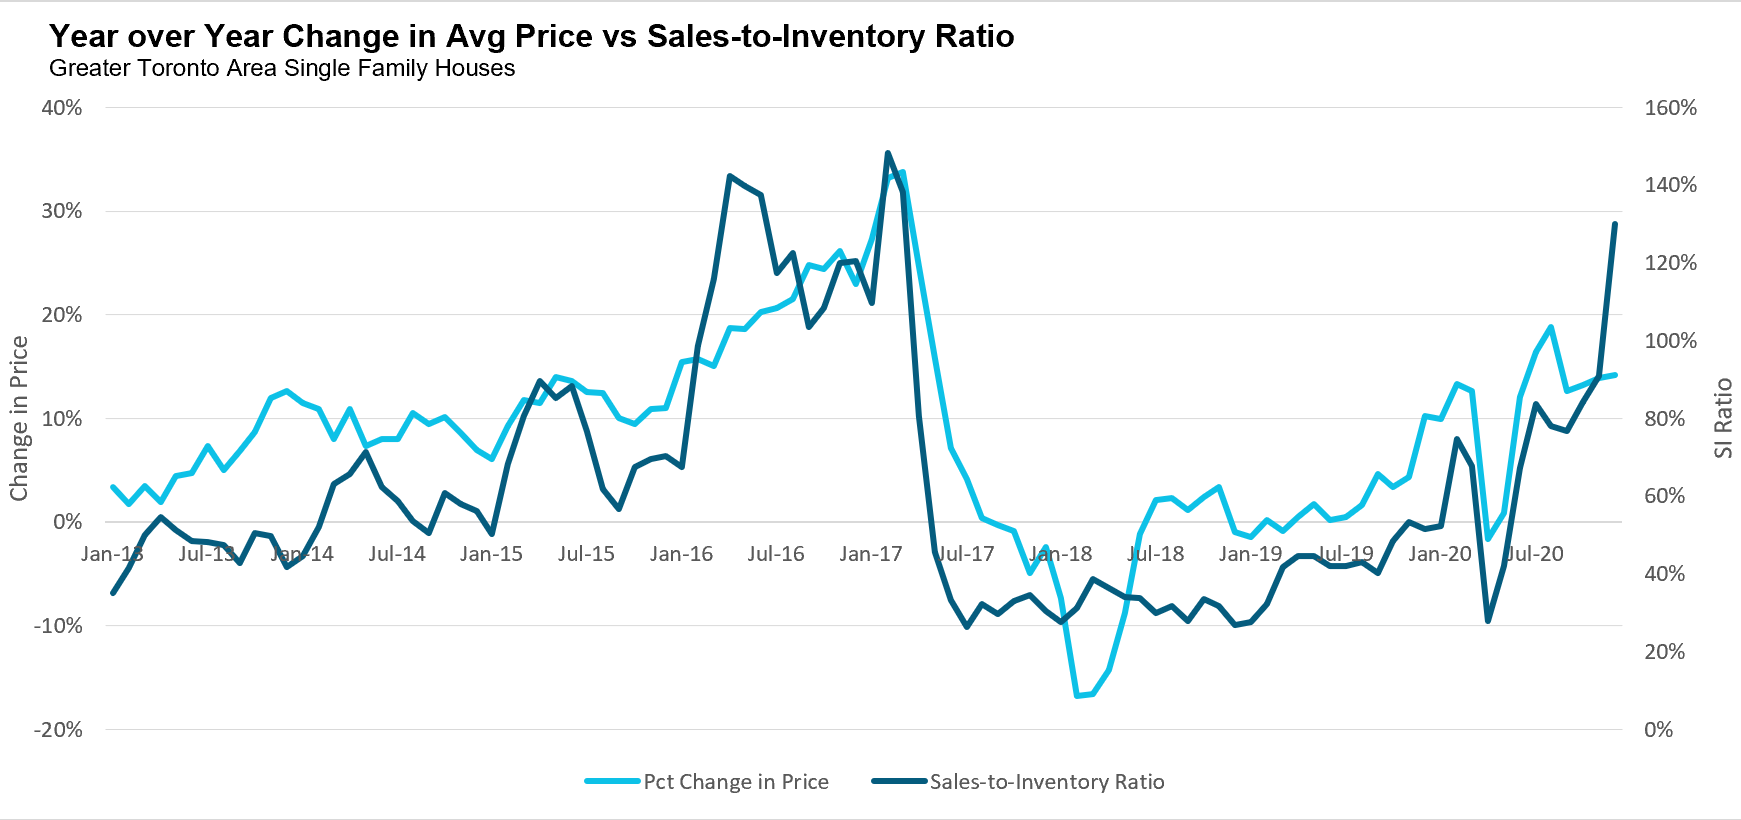
This tight level of supply is resulting in 50% or more of houses selling for more than their asking price. The last time this happened was in 2016.

All early indicators point to a market that will continue to heat up as we move into the first quarter of 2021 market.

We are even seeing alarming signs of homeowners flipping houses for 25-30% more than they purchased them six months earlier – in the summer of 2020 without doing any renovations. We haven’t seen this type of speculative behaviour in Toronto since the late 1980’s.

If these trends continue, it could lead to an even more rapid acceleration in house prices fueled by extrapolative expectations rather than market fundamentals.

Will Investor Demand for Condos Stick?

The post lock-down rebound in the condo market was far softer than what we saw for houses, with the suburban condo market performing slightly better than the downtown condo market.

But as noted above, during the last six weeks of 2020, we saw a significant rebound in interest from condo investors looking to capitalize on the decline in condo prices with the hope that the rental and resale market will rebound in the near future.

Where the condo market goes from here will largely depend on what the rental market looks like in the first quarter.

If the rental market, both inventory levels and rents, remains stable (i.e., avoiding declines) then I expect investor demand to continue into 2021, effectively setting a floor on resale condo prices - something I discussed further in this BNN Bloomberg interview.

But if the rental market continues to soften, I suspect this may push investors back to the sidelines.

While inventory levels have declined slightly, prices continue to trend down.

4_CondoRentalInventory

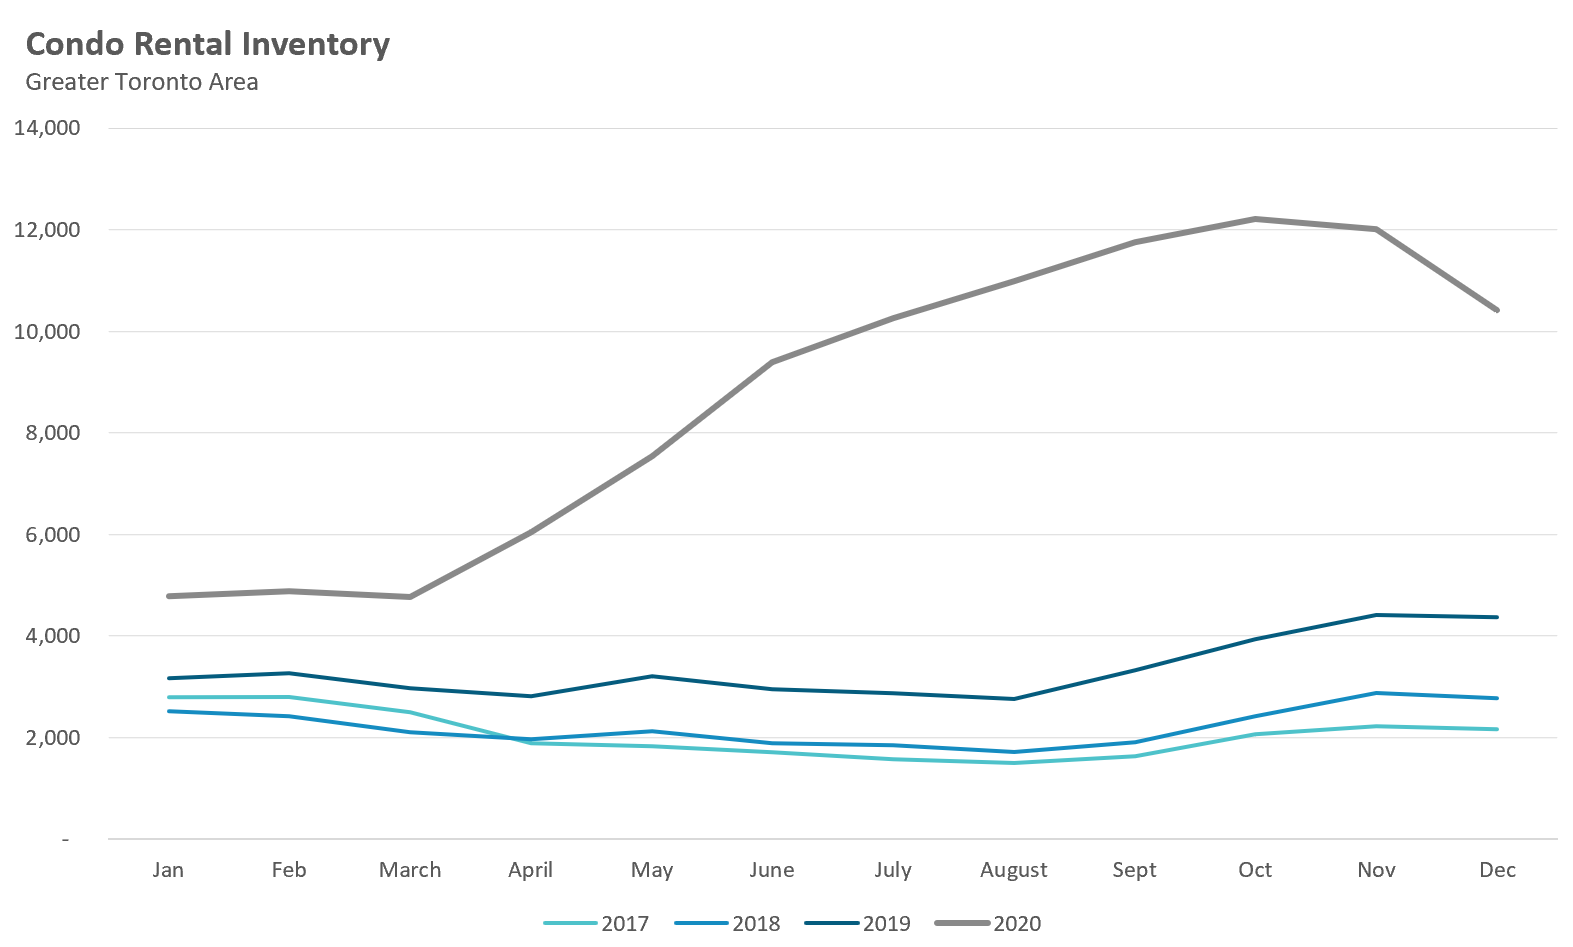
Even with the recent decline in condo prices, it takes a lot of confidence to invest in a condo that is priced at 2019 levels when rents are at 2013 levels and falling.

A Look Back at the CMHC Forecast

As mentioned above, shortly after the onset of COVID-19 early in 2020, CMHC came out with the most pessimistic forecast for Toronto’s housing market expecting a sustained decline in both house sales and prices.

CMHC’s forecast range included an upper (optimistic scenario) and lower (worse than expected) bound. The charts below compare CMHC’s upper and lower bounds for the GTA for its entire forecast horizon against actual sale and price levels so far.

Note that CMHC sales are based on seasonally adjusted annual rates while actual sales are based on actual sales over the pervious twelve months.

5_CMHC_Sales


6_CMHC_Prices

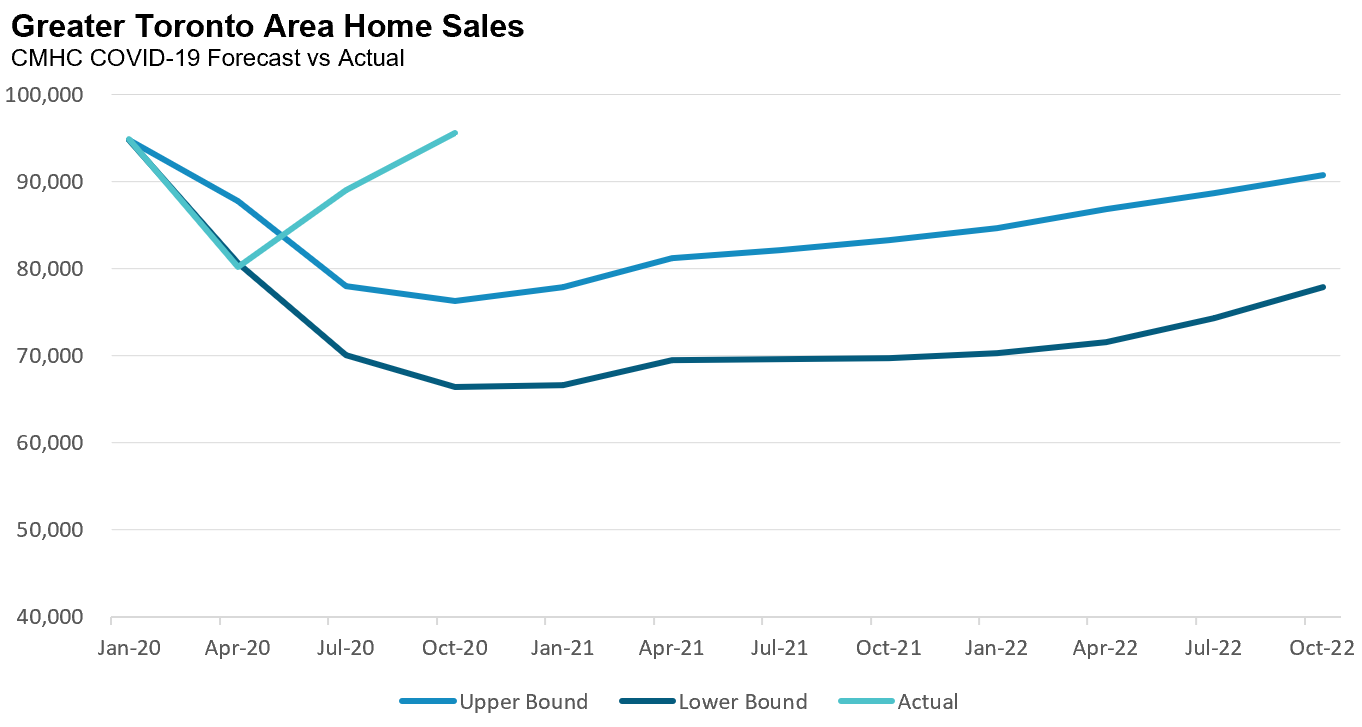
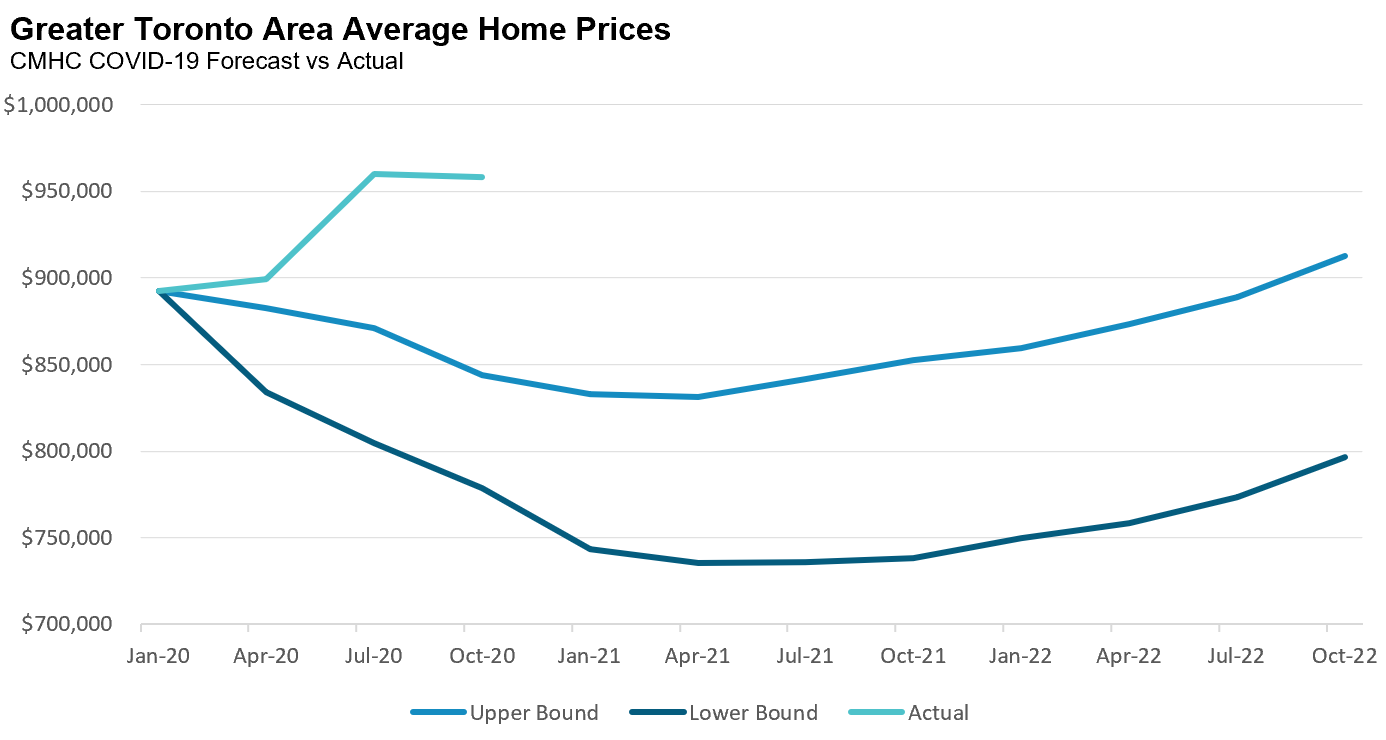
Leaving aside the fact that we are still in the middle of this pandemic and that there is a way to go, it’s quite clear that CMHC wasn’t expecting house prices to reach today’s level until 2023 at the earliest. So why did CMHC get their forecast so wrong?

I suspect one of the major reasons has to do with the fact that CMHC was viewing this economic slowdown from the lens of a traditional, and very deep recession, which was probably not the best way to look at the economic impacts from COVID-19, as noted in this Bank of Canada Analytical Note:

The economic impact of COVID-19 is often compared with past recessions, but this pandemic arguably has more in common with natural disasters. The key feature shared by natural disasters and pandemics is a sudden stop of economic activity caused by a shock that is unrelated to economic factors—in this case, a public health crisis. This contrasts with the 2008 recession, which reflected an underlying fragility in the global financial system that resulted in a lengthy downturn.

At our July online summit, Mikael Khan from the Bank of Canada shared with me some of the thinking behind the above-quoted research note — you can see the full Interview here.

But perhaps the biggest problem with CMHC's forecast was not that it was wrong (economists often expect to be), but that it was delivered with overconfidence that a decline in house prices was a foregone conclusion.

In an era when most politicians and civil servants provide scripted answers to questions, CMHC CEO Evan Siddall’s “tell it like it is” style on Twitter was a breath of fresh air for his loyal fans. Take this tweet from May 27th in response to housing analysts that offered a more optimistic outlook for the housing market:

"Please question the motivation of anyone who wants you to believe prices will go up (yes, up) with our economy in slow motion, oil being given away, millions of Canadians on income support and a greater % of mortgages not being paid than we’ve seen since the Great Depression."

The problem with this type of impassioned messaging from the CEO of CMHC is that if you're going to make it, you better be absolutely certain you're going to be right.          

If you're wrong, then the message Canadian's take from it ends up being the opposite of what was intended.

Eight months later, we hear the message that many consumers are taking away from this, which is that if home prices didn’t crash “with our economy in slow motion, oil being given away, millions of Canadians on income support and a greater % of mortgages not being paid than we’ve seen since the Great Depression,” then nothing can make house prices crash.

Of course, this is not true. As I mentioned above, we have in recent memory seen housing price corrections, such as the ones seen in the GTA suburbs in 2017 which negatively impacted average consumers.

But when authorities make such strong stands for and against positions, only to be wrong, consumer behaviour is at risk — such bold posturing may fuel the exuberance we are seeing in the housing market today.

Best Performing Neighbourhoods in Toronto and the GTA - Houses

Given the year we’ve had, it’s interesting to note which neighbourhoods within the Toronto and GTA area have performed well in terms of home price appreciation given the impact of the COVID-19 pandemic.

Below are the top performing neighbourhoods as measured by the highest year-over-year change in the median price. Note that this analysis, for both houses and condos (below), is limited to neighbourhoods with at least 24 transactions in each calendar year.

Neighbourhood City (Region) % Change Median Price % Sold Over Asking
Med Price 2019 2020 2019 2020
Beaverton Brock (Durham) 38% $400,000 $550,000 5% 32%
German Hills Markham (York) 37% $915,000 $1,250,000 22% 40%
Uplands Vaughan (York) 32% $1,280,000 $1,695,000 6% 21%
Palgrave Caledon (Peel) 31% $1,217,450 $1,590,000 4% 16%
Rural Burlington Burlington (Halton) 29% $1,135,000 $1,468,750 4% 21%
Shoreacres Burlington (Halton) 29% $820,000 $1,056,000 18% 31%
Rural Whitchurch-Stouffville Stouffville (York) 28% $1,147,500 $1,474,000 5% 12%
Eastlake Oakville (Halton) 28% $1,700,000 $2,167,500 11% 19%
Rural Scugog Scugog (Durham) 27% $589,625 $749,500 11% 27%
Princess-Rosethorn Toronto (Toronto) 27% $1,350,000 $1,715,000 27% 40%


Quite remarkably, our resulting list of top ten performing neighbourhoods for houses (not condos) reflects the urban exodus out of the downtown Toronto core to the outer suburbs in the second half of 2021. Only one of the neighbourhoods on this list was in the City of Toronto.

The average distance to the downtown core for the nine neighbourhoods in the suburbs was 59 km, with two of the neighbourhoods more than 90 km from downtown.

Best Performing Neighbourhoods in Toronto and the GTA - Condos

Turning to condos, here are the top performing neighbourhoods as measured by the highest year over year change In the neighbourhood's median price.

Neighbourhood City (Region) % Change Median Price % Sold Over Asking
Med Price 2019 2020 2019 2020
Sheridan Mississauga (Peel) 39% $396,000 $552,000 46% 42%
Wexford Toronto (Toronto) 30% $406,500 $526,500 17% 31%
Glenfield-Jane Heights Toronto (Toronto) 27% $344,500 $439,000 37% 31%
Malton Mississauga (Peel) 27% $415,000 $525,000 18% 47%
Jefferson Richmond Hill (York) 26% $460,000 $580,000 4% 17%
Centennial Oshawa (Durham) 25% $320,000 $400,000 28% 75%
Wallace Emerson Toronto (Toronto) 24% $531,500 $660,000 42% 58%
Humbermede Toronto (Toronto) 24% $399,000 $493,000 33% 48%
West Hill Toronto (Toronto) 23% $410,000 $505,500 23% 51%
Lasalle Burlington (Halton) 22% $445,500 $545,500 13% 41%


If the search for more space characterized our house list, the search for affordability dominated our condo list. The median price for condos in Toronto and the GTA in 2020 was $580,000, which means that nine out of the top ten neighbourhoods above had a median price at or below the GTA median.

House sales (detached, semi-detached, townhouse, etc.) in the Toronto area in December 2020 were up 62% above December 2019 volumes year-over-year.

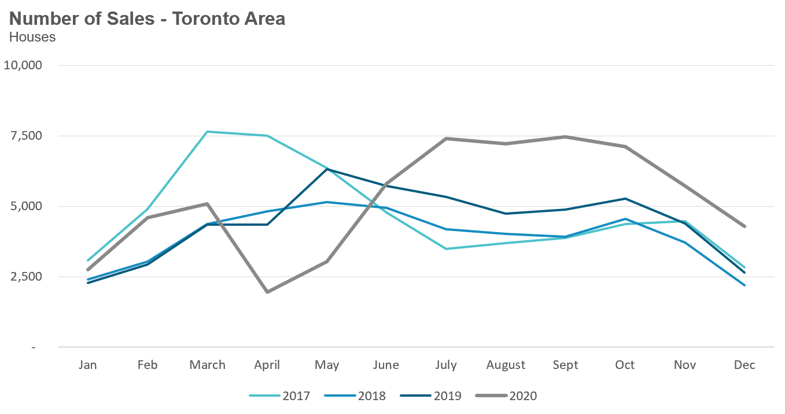
House sales for the entire year were up 17% over last year's sales volume and ended well above levels reached in 2017 and 2018.

7_House_Sales

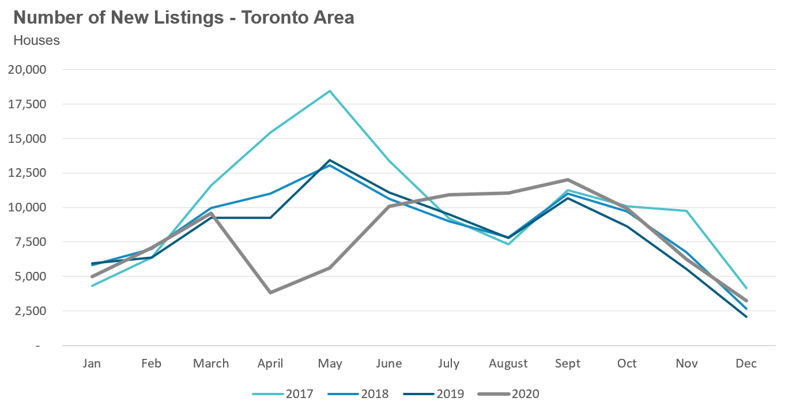
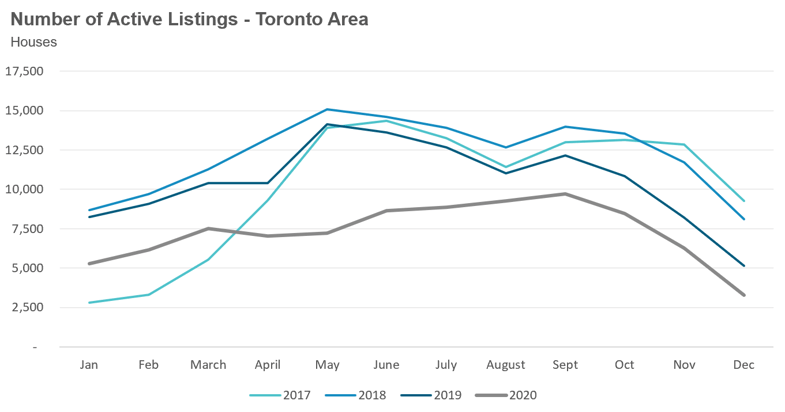
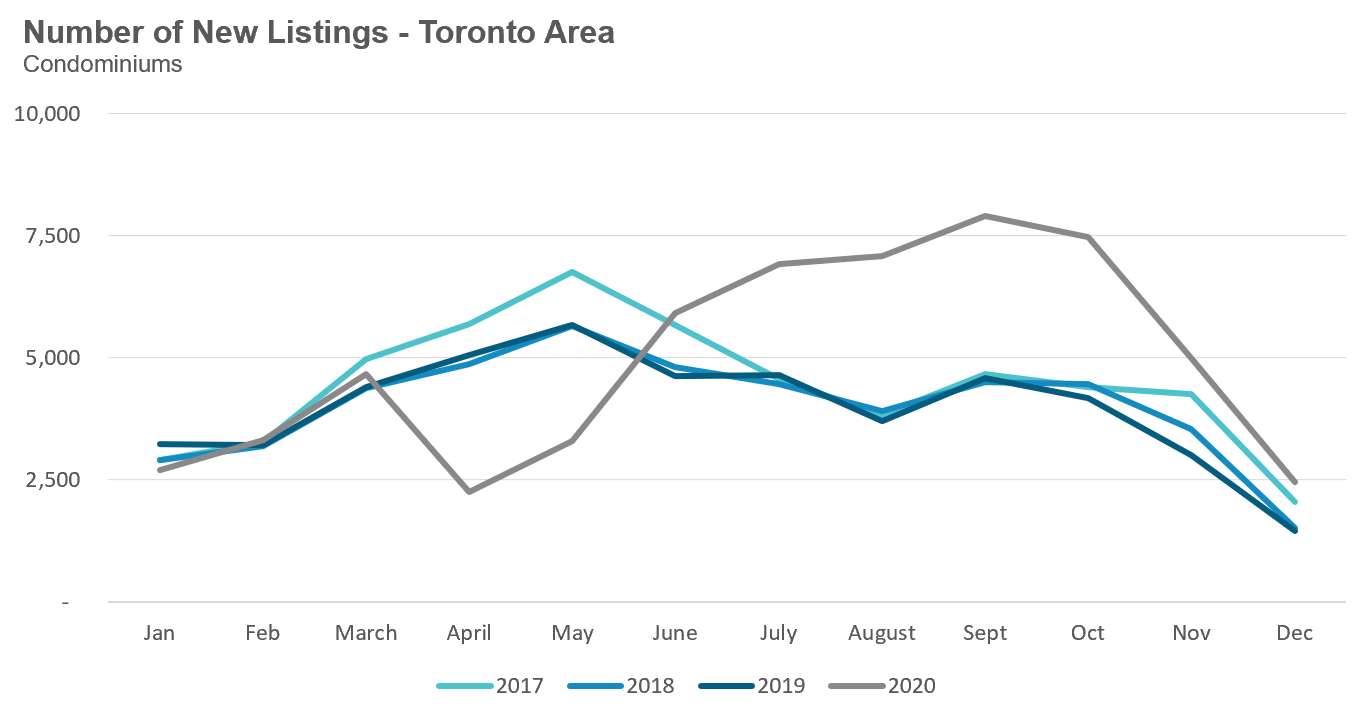
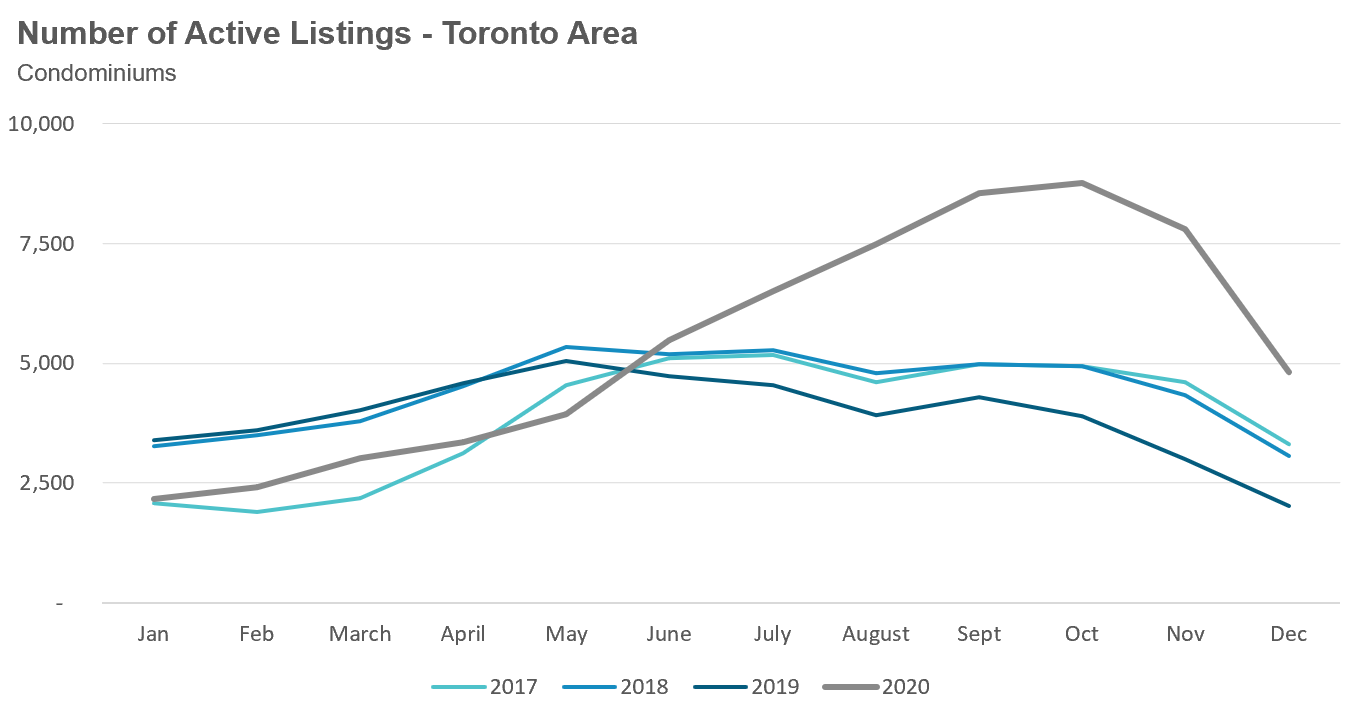
New listings did not keep up with the strong pace of demand. December saw a 56% increase in new listings over last year while the number of homes available for sale (“active listings”) was down 36% when compared to the same month last year.


8_Houses_NewListings

9_Houses_ActiveListings

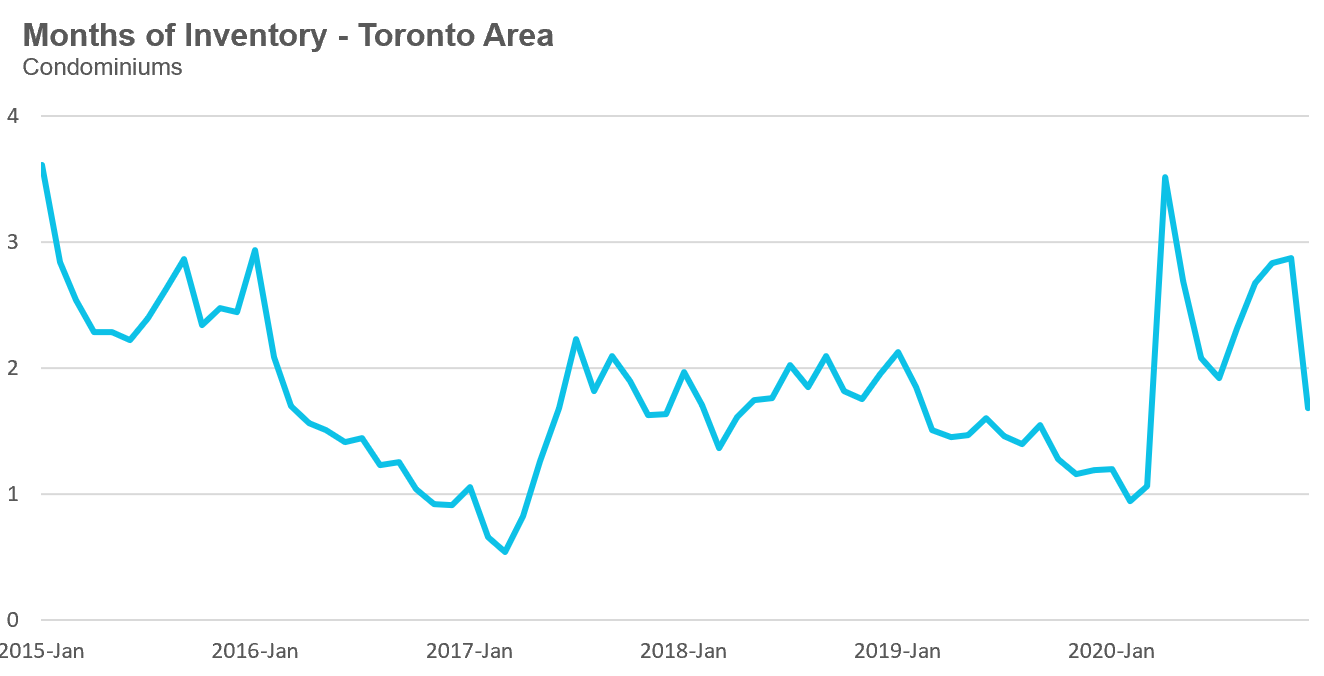
The Months of Inventory ratio (MOI) looks at the number of homes available for sale in a given month divided by the number homes that sold in that month. It answers the following question: If no more homes came on the market for sale, how long would it take for all the existing homes on the market to sell given the current level of demand?


The higher the MOI, the cooler the market is. A balanced market (a market where prices are neither rising nor falling) is one where MOI is between four to six months. The lower the MOI, the more rapidly we would expect prices to rise.


The market remained very competitive in December with an MOI of just 0.8 months.


While the current level of the MOI gives us clues into how competitive the market is on the ground today, the direction it's moving in also gives us some clues into where the market may be heading. The MOI has been trending down since October suggesting that the market is remaining a competitive seller's market.  


10_Houses_MOI


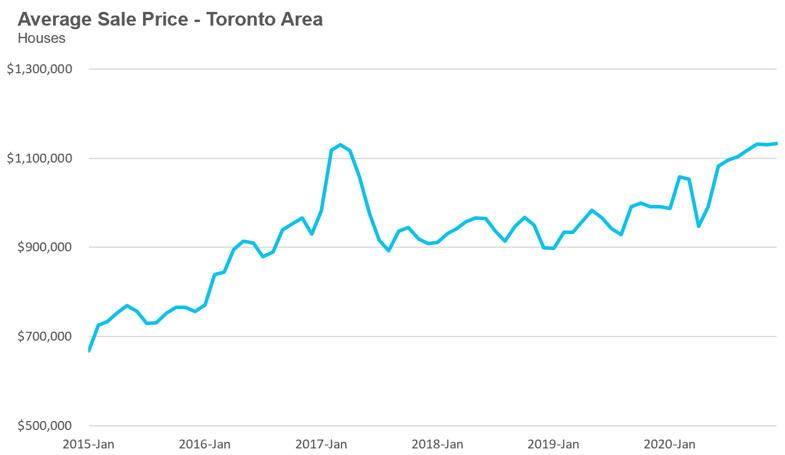
Strong demand coupled with very low inventory levels helped push average house prices up 14% over last year and above the peak price level reached in March 2017.


11_Houses_Price


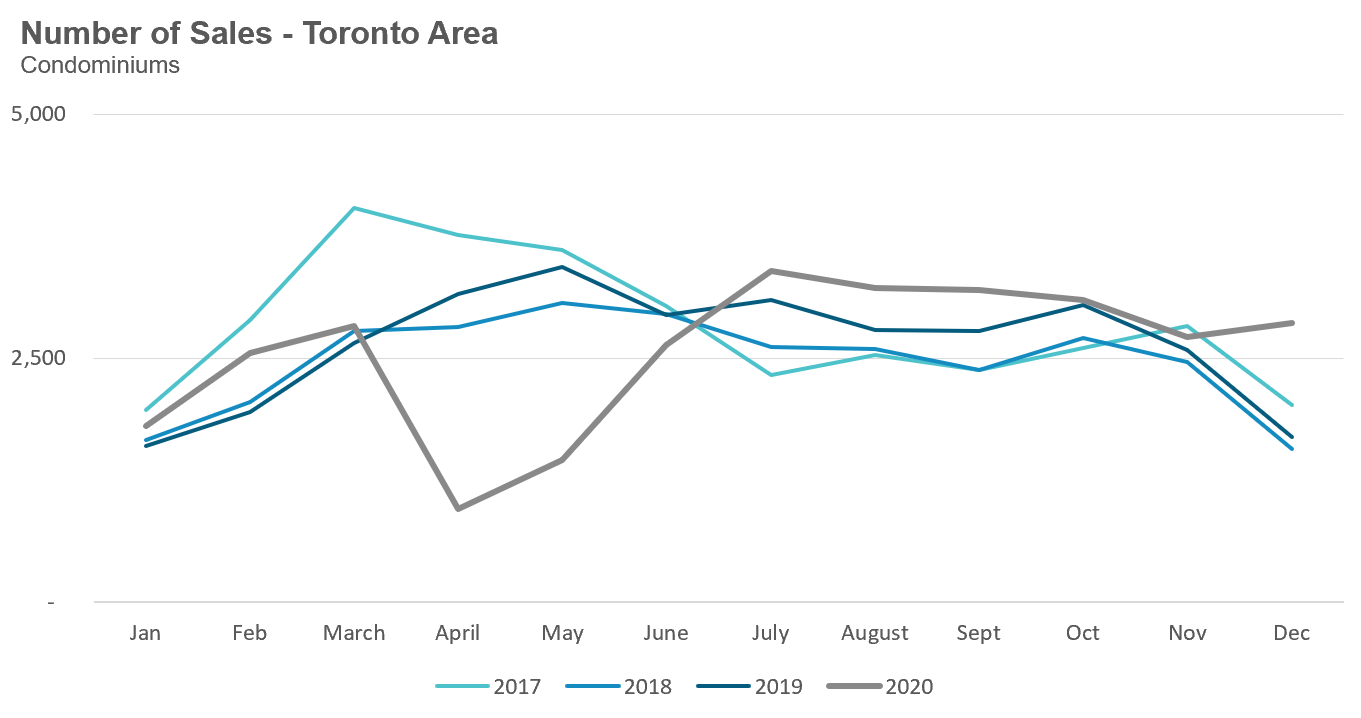
Condominium (condo) sales (condo apartments, condo townhouses, etc.) in December were up by 68% over last year, but despite the strong surge ended the year down 3% over last year for the year overall.

11_CondoSales

New condo listings were up by 70% in December which pushed the active number of condos available for sale in December up by 138% over last year.

12_Condo_NewListings

13_Condo_Active

This decline in inventory is leading to a more competitive condo market with the MOI decreasing from just under 2.9 months in November to 1.7 in December.


14_Condo_MOI


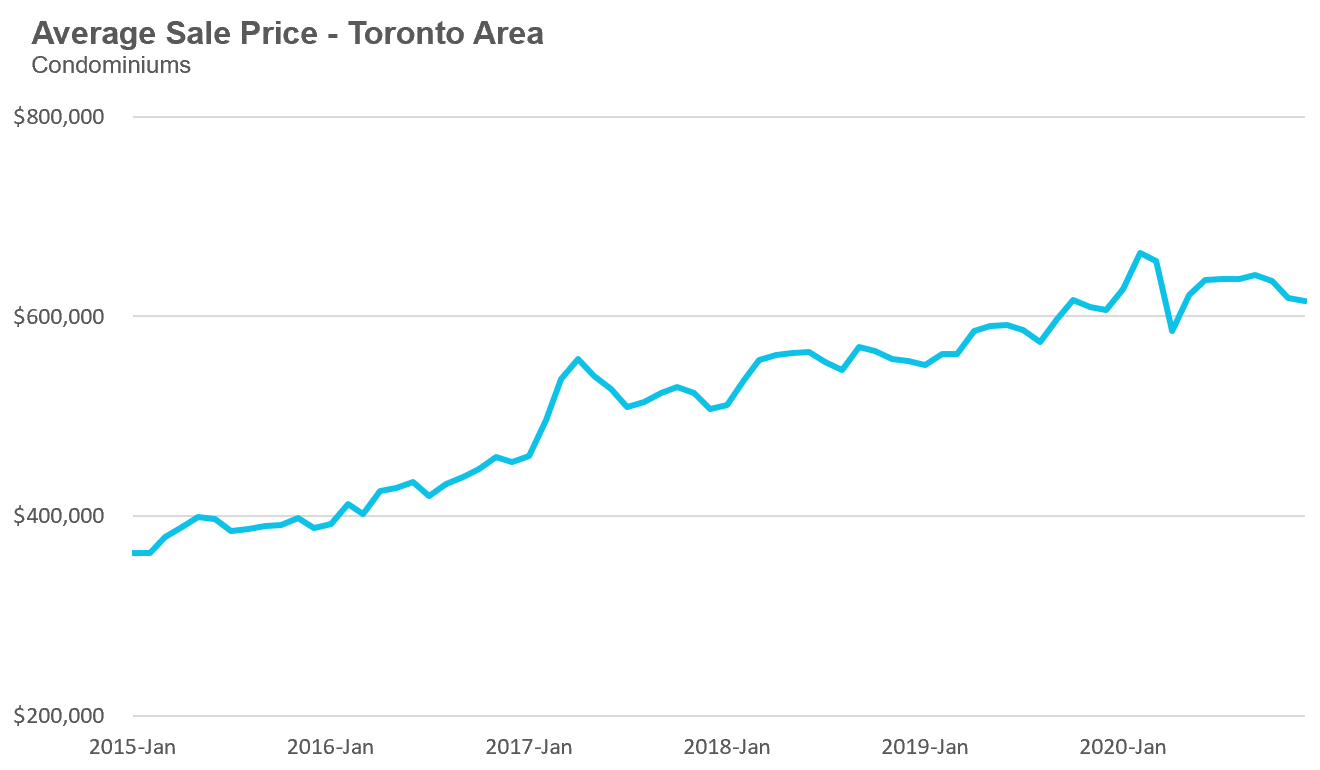
Toronto area condo prices are up 1% over last year, but are down 7% from the peak reached in the first quarter.

15_Condo_Price


Houses

House sales were up by more than 40% across all five regions. Average prices were up the most in the suburban regions with the City of Toronto showing a 10% increase in average prices. Despite the increase in new listings inventory levels are at or below 1 month across the entire GTA.
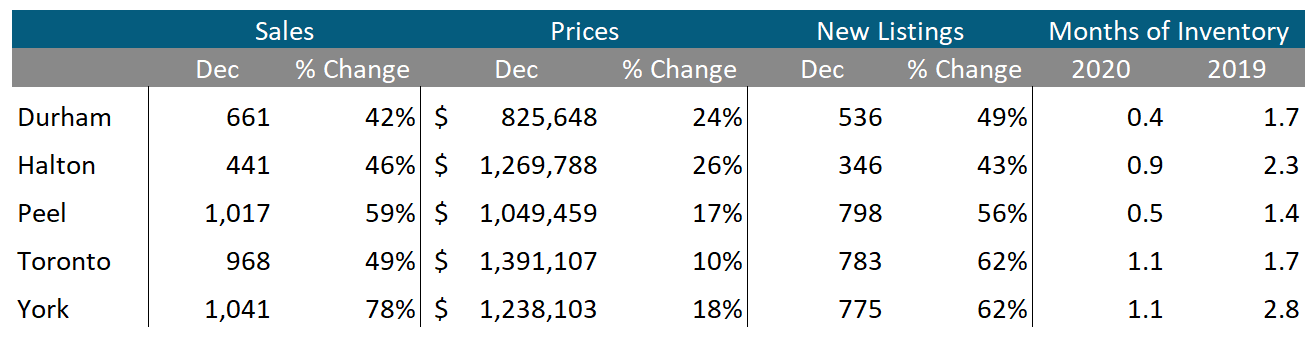
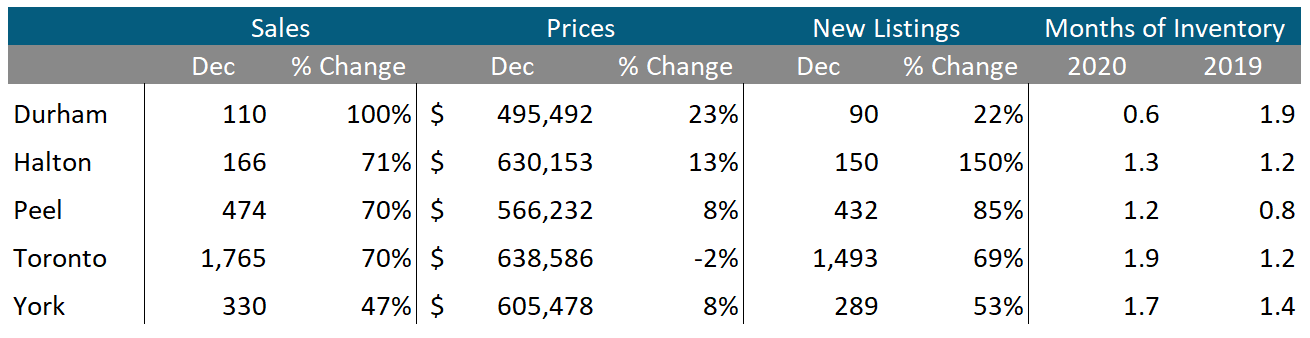
16_Regional_Houses

Condos

Condominium (condo) sales saw a surge in sales in December across the entire GTA. Average prices were up across the suburban regions with the City of Toronto recording a 2% decline in average price.

Inventory levels are above last year's level for four out of the five regions.

17_Regional_Condos

Browse All Regional Market Trends for December 2020 on Realosophy.com:

Greater Toronto Area Market Trends
Durham Region Market Trends
Halton Region Market Trends
Peel Region Market Trends
City of Toronto Market Trends
York Region Market Trends

Market Performance by Neighbourhood Map, Toronto and the GTA


January2021_Monthly_Report_Cover
Download a PDF version of this guide.
Download Report

Have Questions?

Get straight answers to your questions with a no-obligation consultation

Serving Toronto and the Greater Toronto Area