Last month, as part of a speech titled Financial Stability and the COVID-19 pandemic, the Bank of Canada used data provided by us at Realosophy Realty as part of their analysis into the vulnerabilities facing Toronto’s downtown condo market.
The speech notes that there are a number of factors working against the downtown condo market. The shift to working from home means many people are looking for more interior living space as well as outdoor space which is having a negative effect on the condo market. A decline in immigration and foreign students is also impacting the downtown rental market.
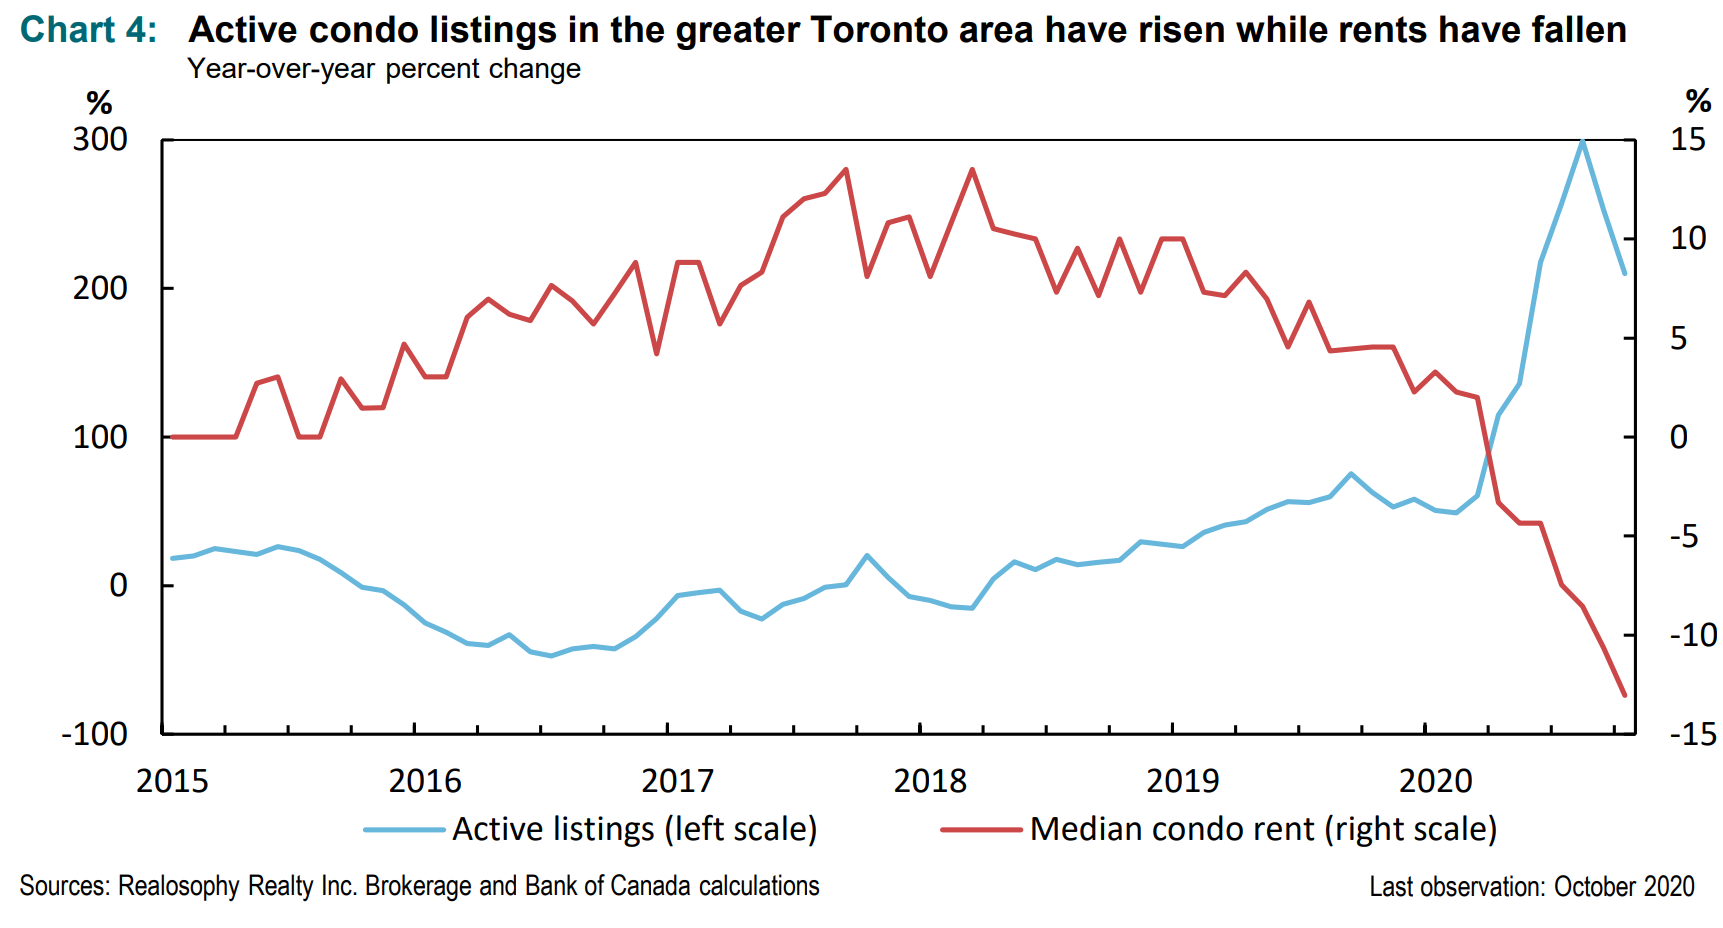
We can see from the chart above that rental listings are surging while median rents are plunging.
While some people in my industry are confident that the downtown condo market will see a swift recovery in early 2021, I’m not as optimistic.
In a recent BNN Bloomberg interview, I discussed why any return to the condo market will be tied to a return to the offices of the downtown financial district. Today, the financial district is a ghost town. People are not back in their offices in part because it’s impossible get thousands of people to their desks efficiently when you can only have three people at a time in an elevator due to Covid-19 restrictions.
If people do not have to commute to the office, then there is no longer a need to move to a condo a five minute walk away. Assuming Canada’s vaccine rollout goes as planned and the majority of Canadian’s are vaccinated by September of next year, I still do not expect things to be “back to normal.”
The return to downtown offices will likely be a gradual process for most companies and I expect the return of the downtown condo rental market will also be gradual.
That being said, the resale condo market may end up recovering faster than the rental market if investors jump back into the market in the months ahead. We are starting to see strong interest from investors looking for deals in the resale condo market. If this trend continues, condo Investors rather than end users will set the floor on downtown condo prices.
This month, I dig into the data to uncover the underlying trends in the market over the past couple of years to put today’s trends into context.
This analysis will look at the market for houses (detached, semi-detached and row houses) in Toronto’s suburbs – Durham, Halton, Peel and York Regions.
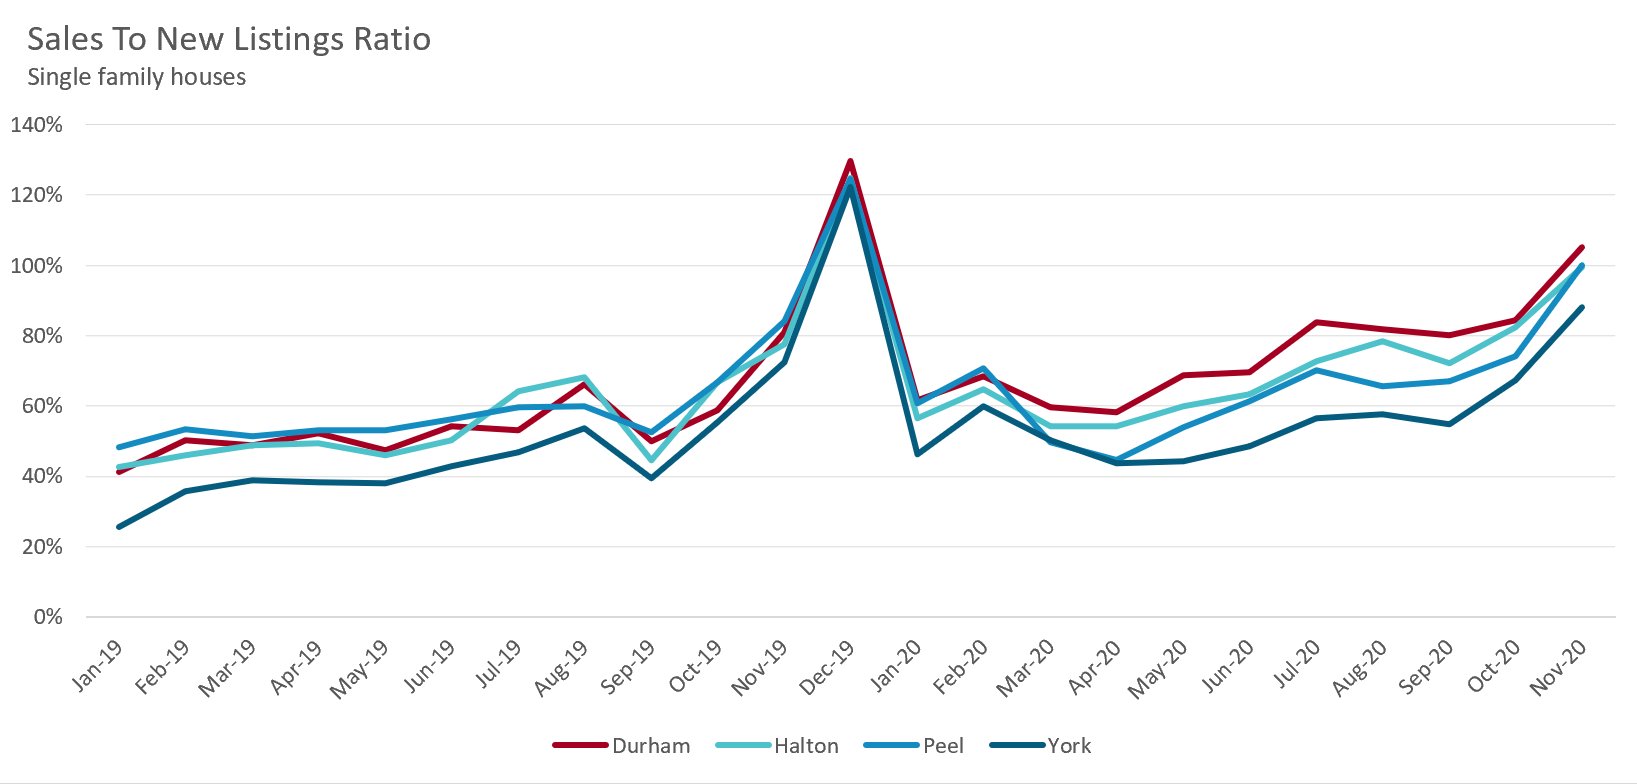
For the first three quarters of 2019, the market for suburban houses was quite balanced with the sales-to-new-listings ratio (SNLR) in the 40-55% range. By the fourth quarter, the market had changed suddenly as sales began to outpace the supply of new listings coming on the market. As the SNLR moves above 55%, it signals that the market is moving towards a seller's market with demand outpacing supply.
This led to a shortage of inventory during the first quarter of 2020 as indicated by low Months of Inventory (MOI) ratios. Unlike the SNLR which focuses on the supply of new listings entering the market, the MOI compares all active listings on the market in a given month against the number of sales in that period.
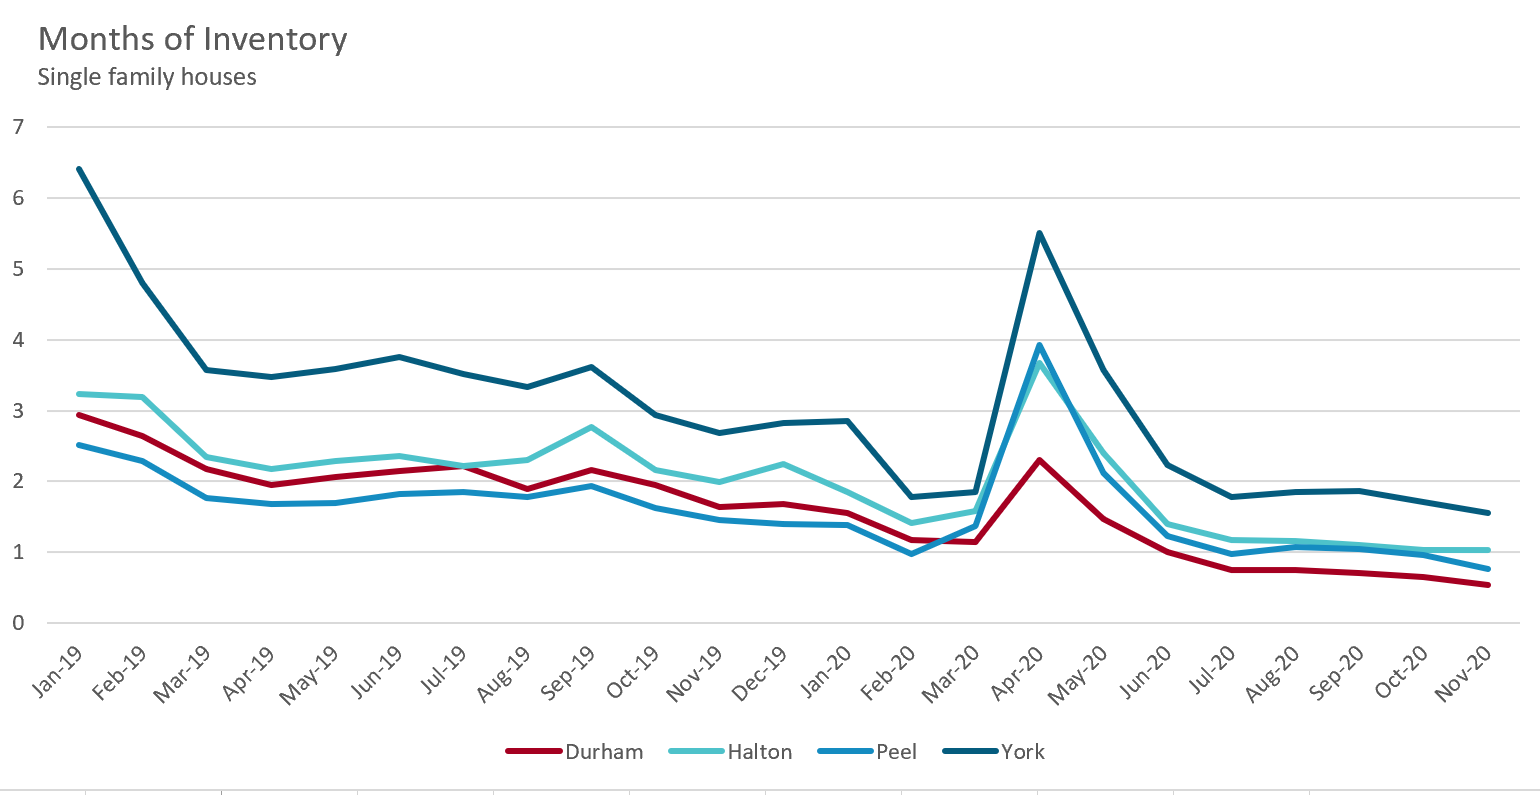
The dwindling inventory of houses led to a competitive market in the first quarter of 2020. One way of seeing just how competitive the market had become is to compare the percentage of homes that sold for more than the seller’s asking price.
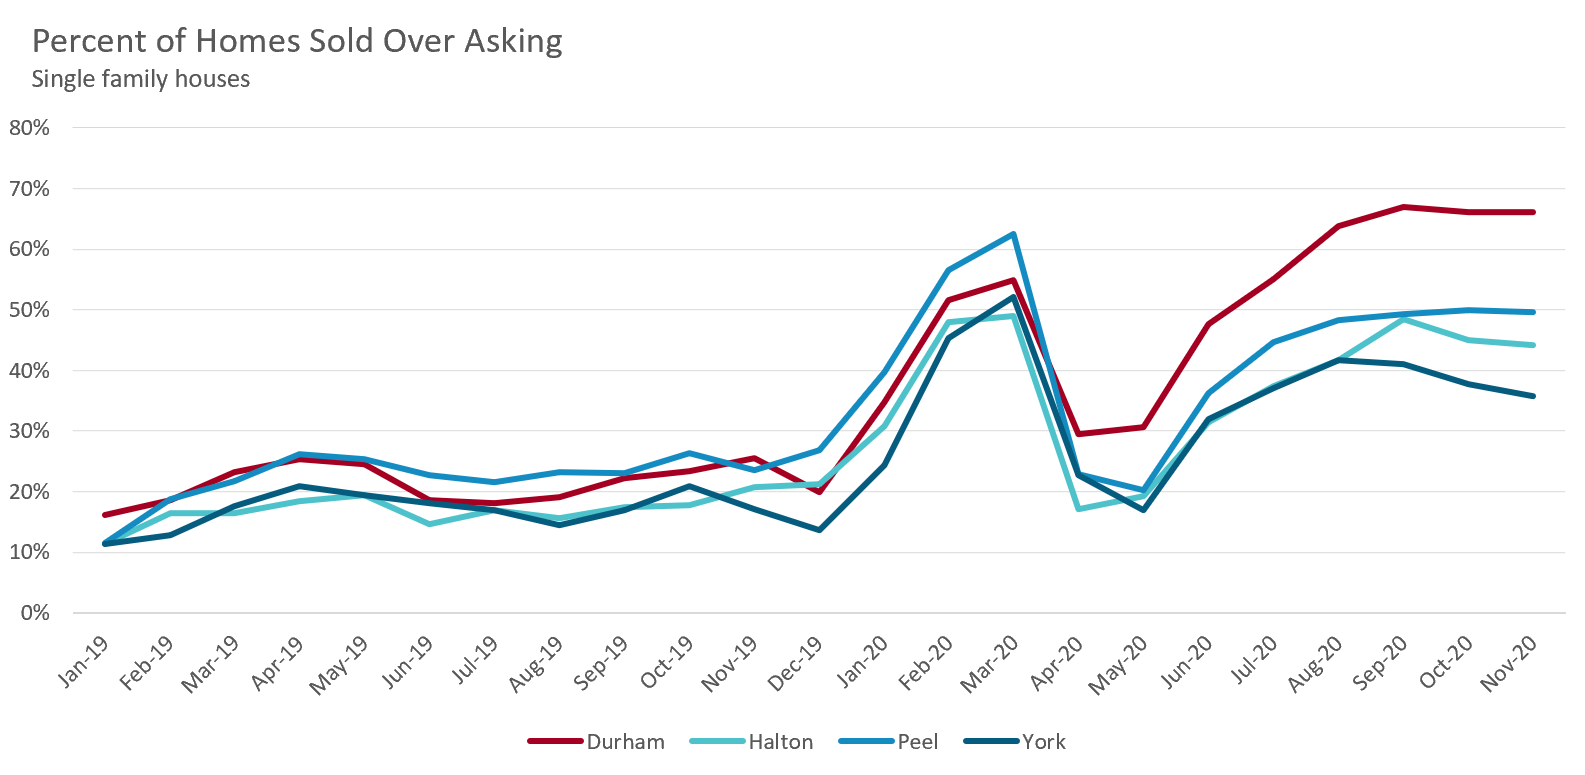
In 2019, fewer than 30% of homes listed for sale sold for more than the owner's asking price. In the first quarter of 2020, a surge in demand resulted in roughly half of all properties getting more than the asking price.
The market cooled during the second quarter of 2020 during Ontario’s first lockdown due to the COVID-19 pandemic, but quickly rebounded in the third quarter as buyers returned to the market once able to. In all four Toronto Area regions, the SNLR has been trending up over the past eight months pushing the market further into Seller’s Market territory. In November, the SNLR was at or above 100% in three of the four regions.
The tight supply has led to between 36% of homes (in York) to 66% (in Durham) selling for above asking price. Durham’s housing market was the most competitive with the share of homes selling above asking price eclipsing the peak levels reached during the first quarter of 2020.
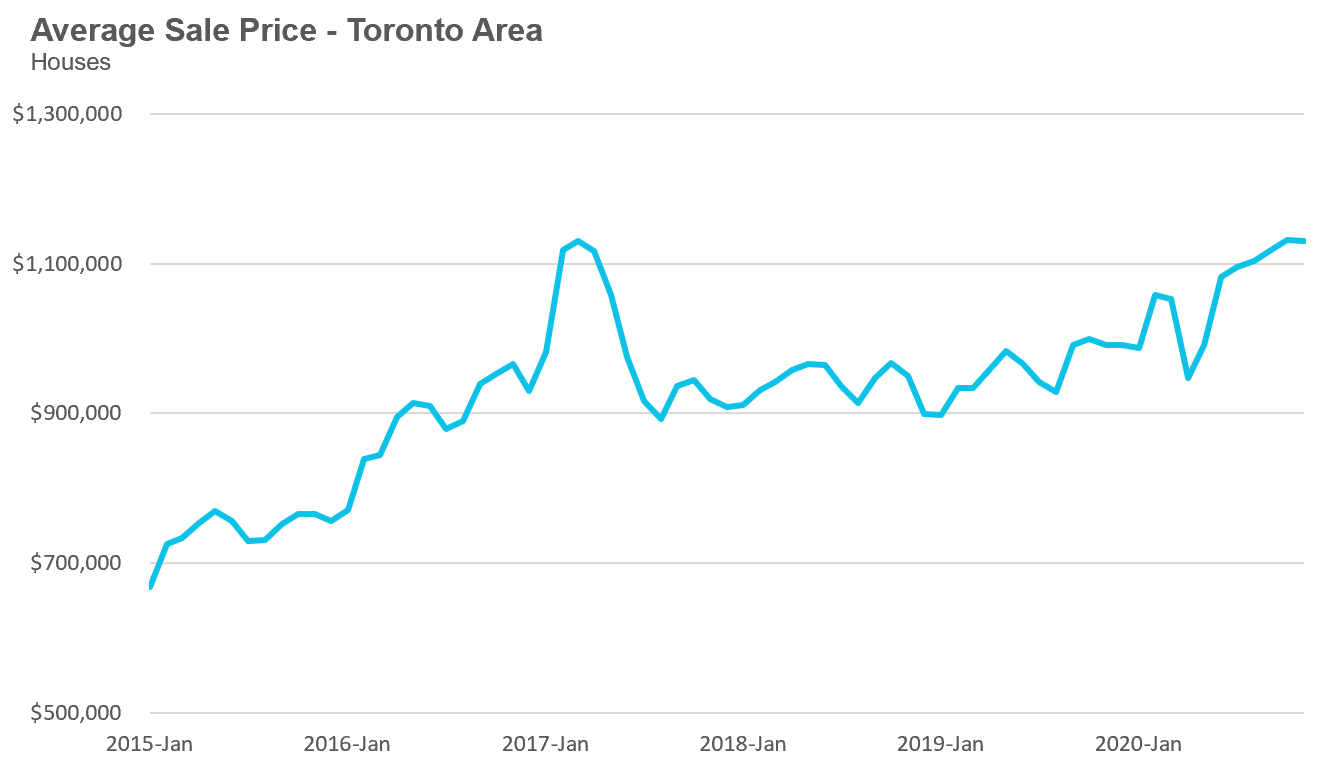
How have these trends impacted suburban house prices? The chart below shows the year over year change in average prices.
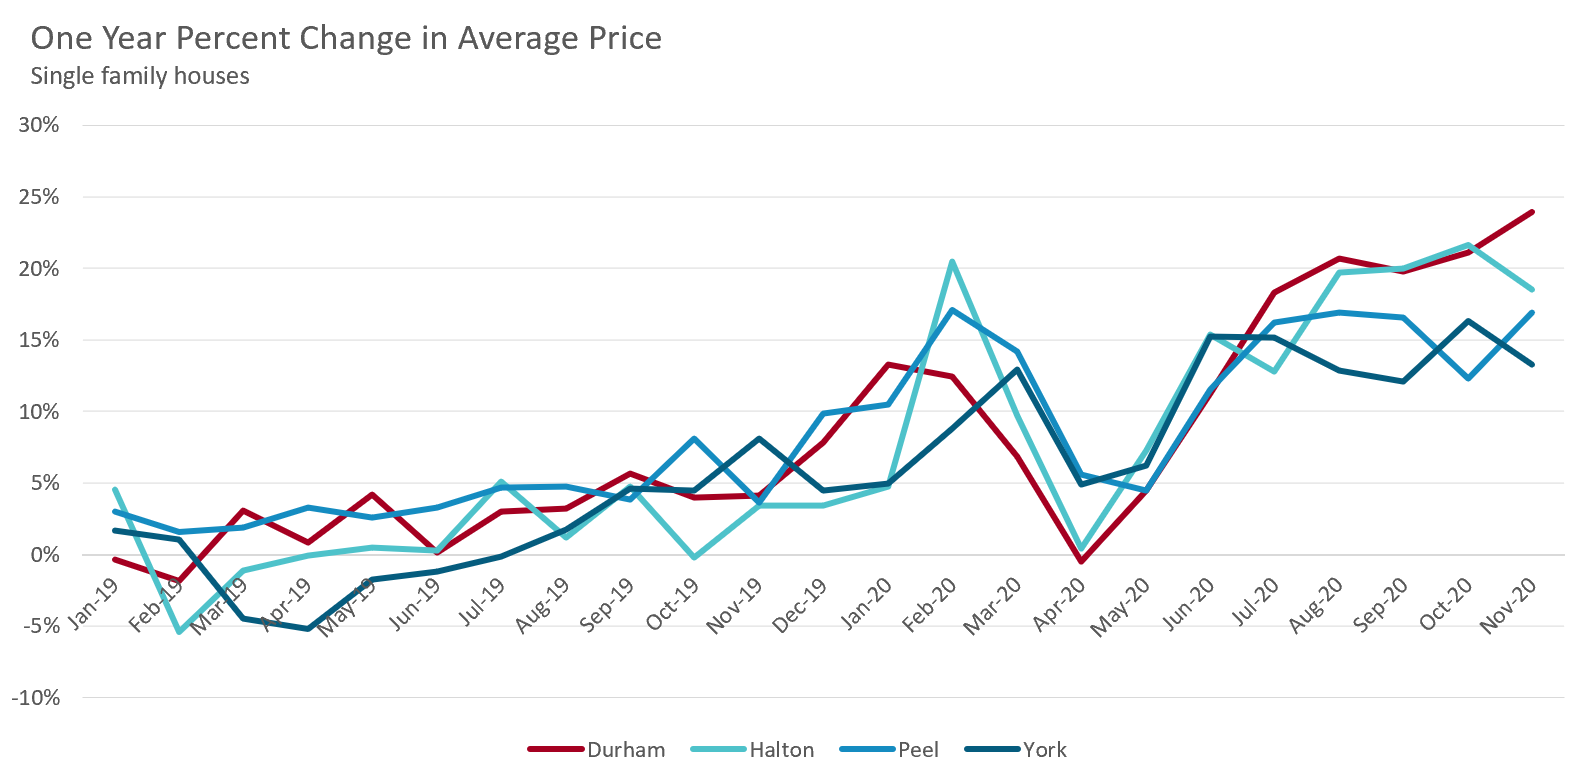
We can see that home prices were appreciating at a relatively modest rate (at or below 5%) for most of 2019. Home price appreciation began to accelerate in the fourth quarter of 2019 and the first quarter of 2020 before cooling in the second quarter of this year. Since June, home prices have been rising by double digits with Durham and Halton house prices rising by approximately 20% over the past four months.
This rapid appreciation in house prices once again presents a number of problems and risks for the Toronto area housing market.
When home prices are appreciating by more than 20% per year, it very quickly erodes any affordability that may have been present in the market before the acceleration in prices. For example, in November 2019, the average price for a single family house in Durham Region, the most affordable of Toronto’s suburbs, was $641K. One year later, the average price for a house in Durham is now $795K, a 24% increase in one year.
Many policy makers, including The Bank of Canada have characterized the current acceleration in home prices as "pent-up demand" after the first Covid-19 imposed lockdown of the year.
In May of this year, the Canadian Mortgage and Housing Corporation (CMHC) painted quite the opposite picture of Canada's housing market in the wake of Covid-19, suggesting that high levels of unemployment would lead to a spike in foreclosures and home prices falling by as much as 18% from their pre-COVID levels.
But as we have seen above, the market in the Toronto suburbs has moved in the opposite direction, heating up considerably with MOI levels falling every month and home prices rising by double digits. The SNLR has been well above 70% for most of the second half of this year for Durham, Halton and Peel regions which according to CMHC itself is normally indicative of a market that is "overheating." In spite of this, the CMHC is sticking to their forecast of a decline in home prices by roughly 10% from their pre-COVID levels.
I don't see eye-to-eye with policy makers who see rising unemployment and a surge in foreclosures as the biggest risk to the Toronto area housing market right now. Instead, it is the risk that the bubble-like appreciation we were seeing in the first quarter of 2020 pre-Covid is re-inflating.
As noted, in the six months since the initial Covid lockdown, this market heating has been explained as being due to "pent-up demand." But pent-up demand was not behind the acceleration in house prices during the first, pre-Covid quarter of this year and the numbers are suggesting that what we are seeing today is a resumption of the trends that were present before the pandemic. And as we have seen as recently as in the last four years, bubbly conditions in the Toronto area can lead to substantial losses for those caught in them and pose wider risks to the rest of the market and economy.
The other risk to Toronto's housing market is that the market for houses and downtown condos are moving in completely different directions which makes the policy makers job that much more difficult. While the market for downtown condos shouldn't impact house prices directly, a sustained decline in condo rents and prices does risk wider damage to the economy as a not insignificant portion of Ontario's economy is built on the assumption that condo prices can only ever go up. Trying to cool one market segment while avoiding the decline of another is not a policy task that many would envy.
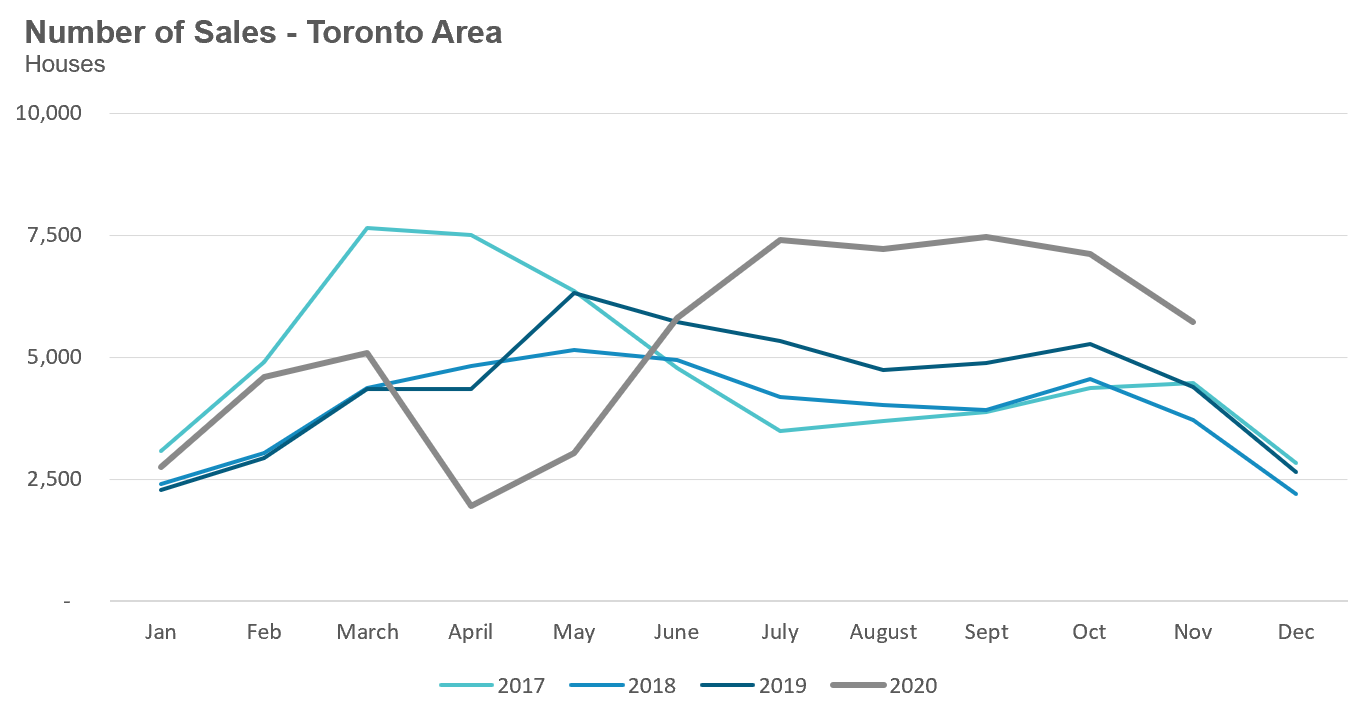
Year-to-date house sales in 2020 are up 15% over last year's sales volume and are well above levels reached in 2017 and 2018.
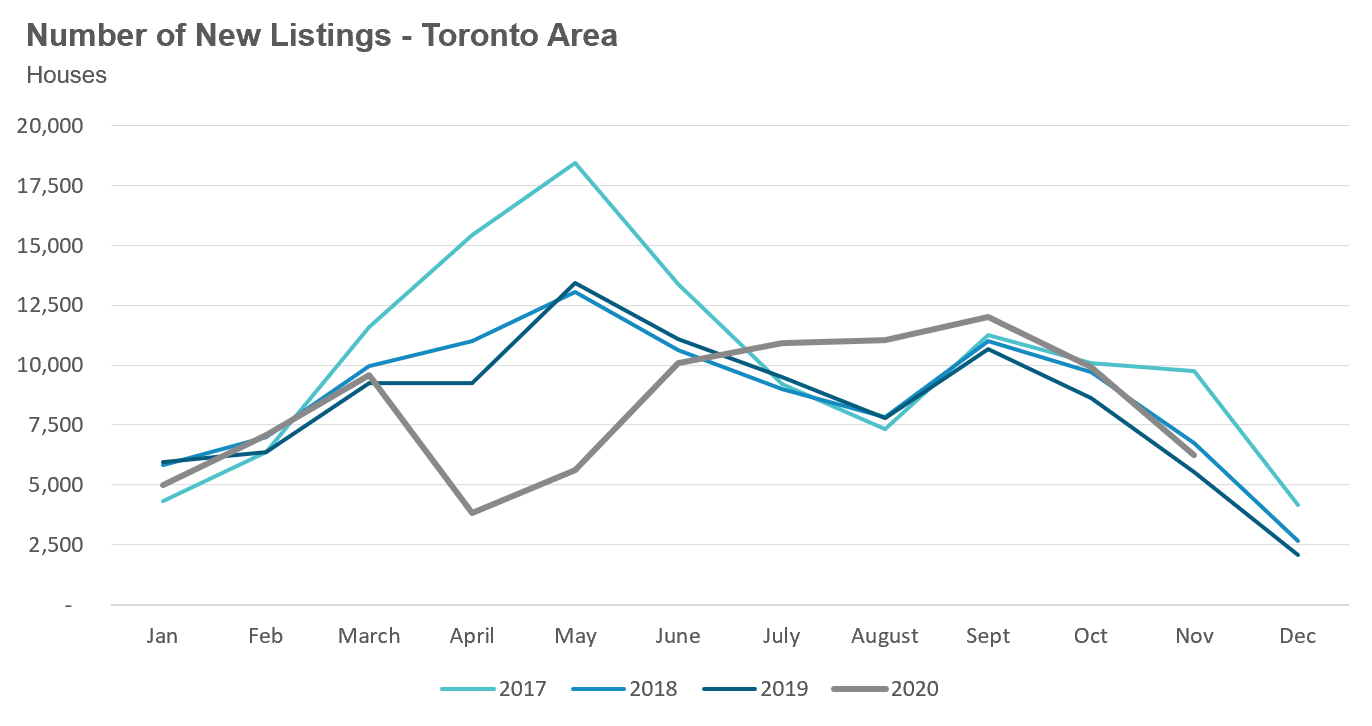
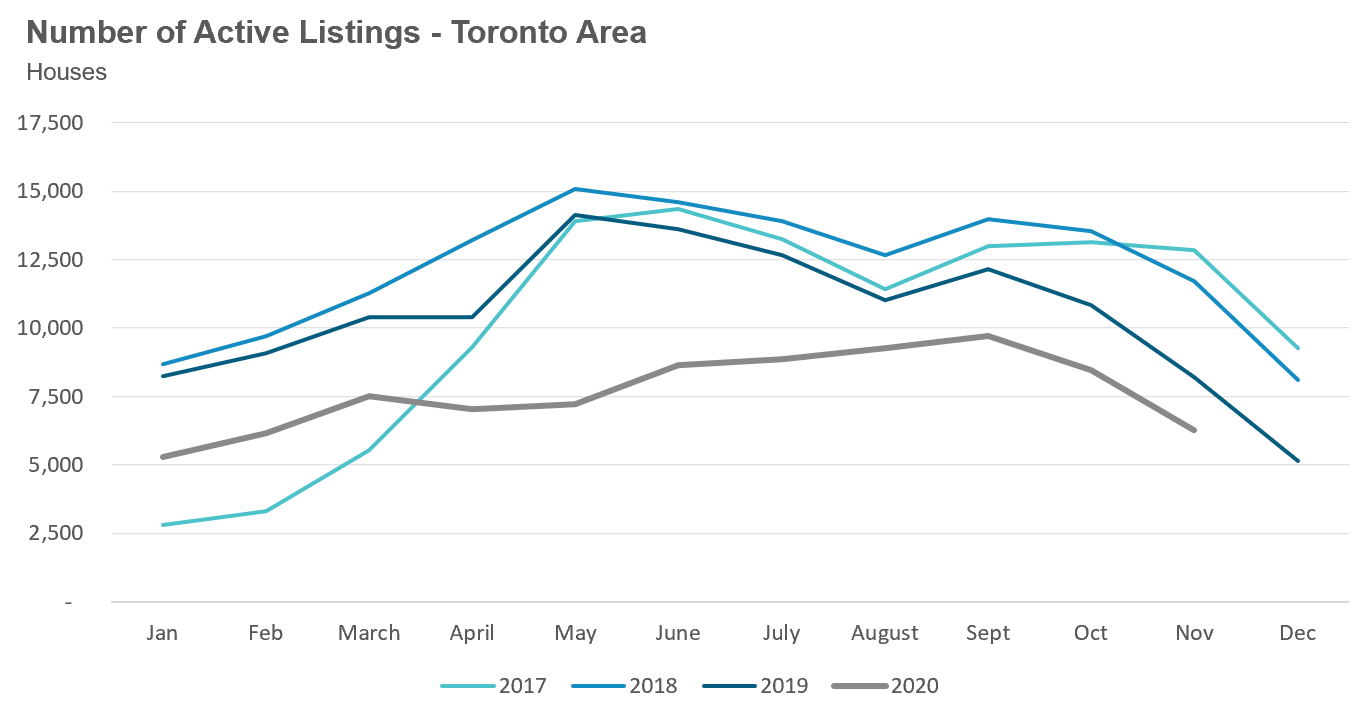
New listings did not keep up with the strong pace of demand. November saw a 12% increase in new listings over last year while the number of homes available for sale (“active listings”) was down 23% when compared to the same month last year.
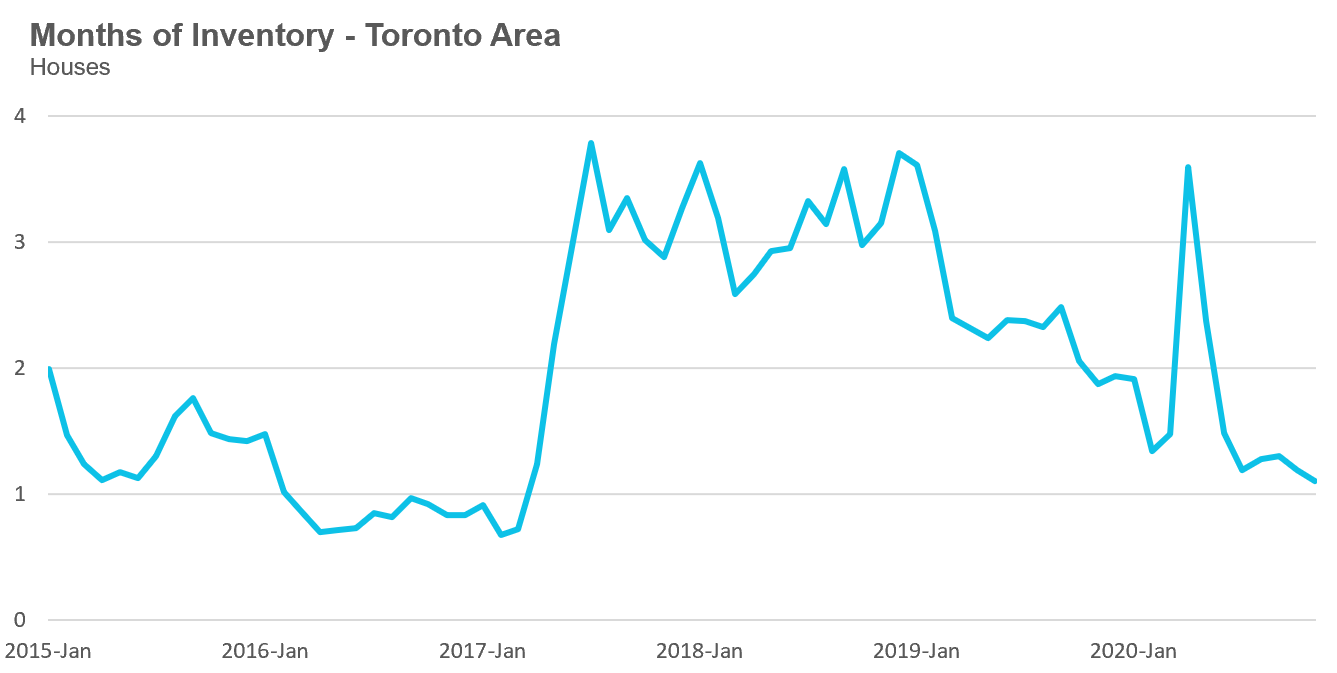
The Months of Inventory ratio (MOI) looks at the number of homes available for sale in a given month divided by the number homes that sold in that month. It answers the following question: If no more homes came on the market for sale, how long would it take for all the existing homes on the market to sell given the current level of demand?
The higher the MOI, the cooler the market Is. A balanced market (a market where prices are neither rising nor falling) is one where MOI is between four to six months. The lower the MOI, the more rapidly we would expect prices to rise.
The market remained very competitive in November with an MOI of just 1.1 months.
While the current level of the MOI gives us clues into how competitive the market is on the ground today, the direction it's moving in also gives us some clues into where the market may be heading. The MOI has been relatively steady since July with a slight downward trend suggesting that the market is remaining a competitive seller's market.
Strong demand coupled with very low inventory levels helped push average house prices up 14% over last year and above the peak price level reached in March 2017.
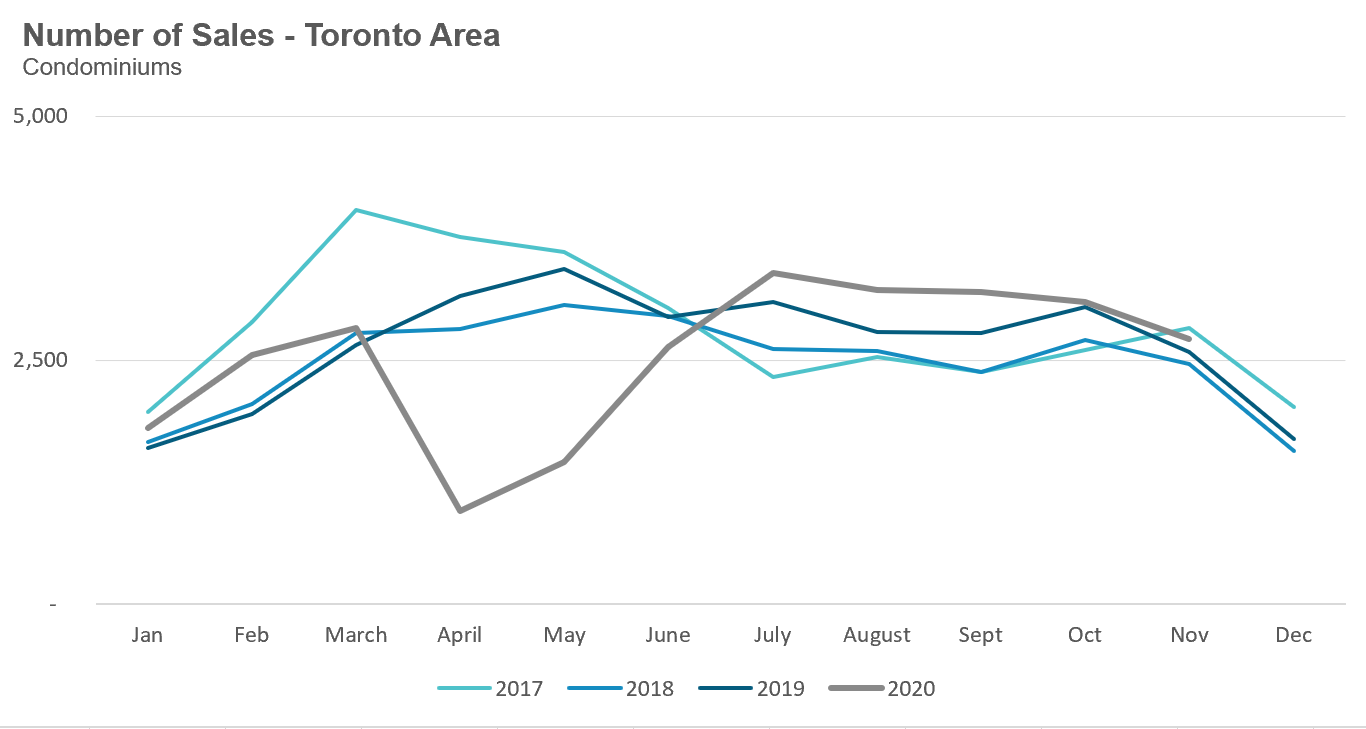
New condo listings were up by 66% in November which pushed the active number of condos available for sale in November up by 160% over last year.
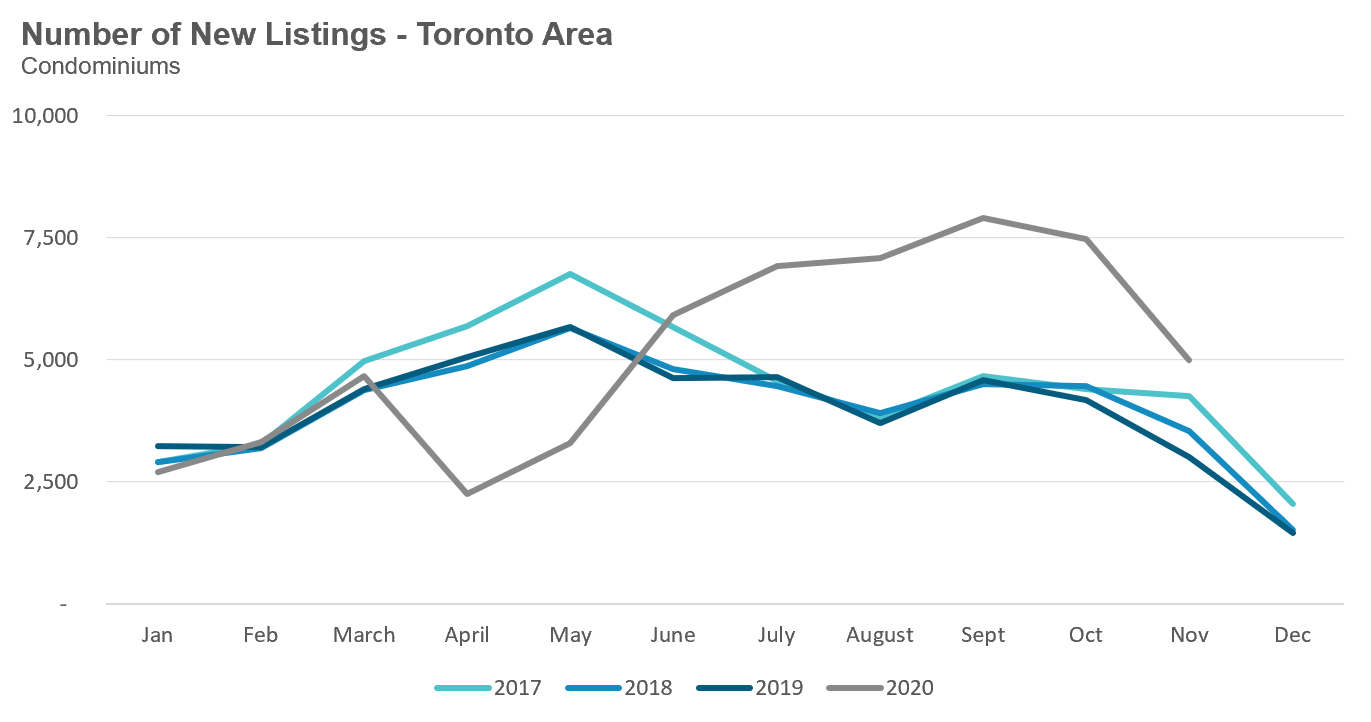
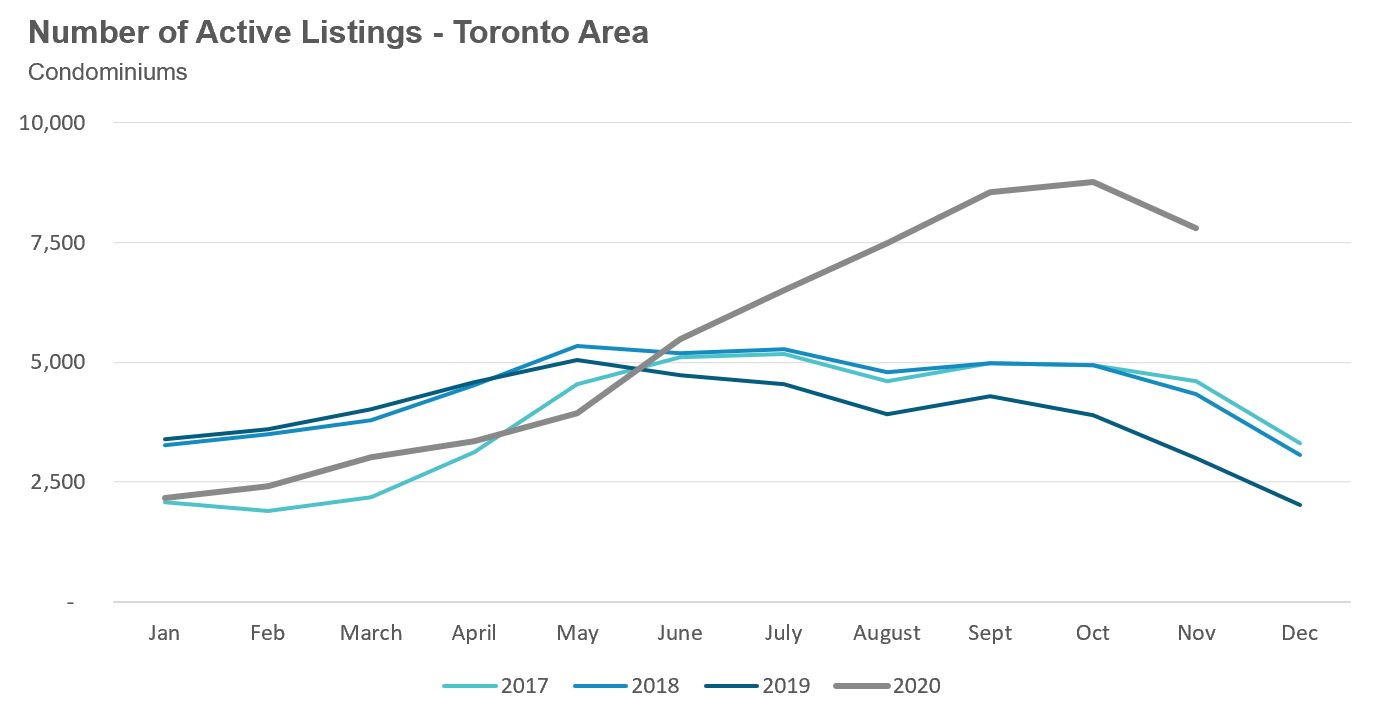
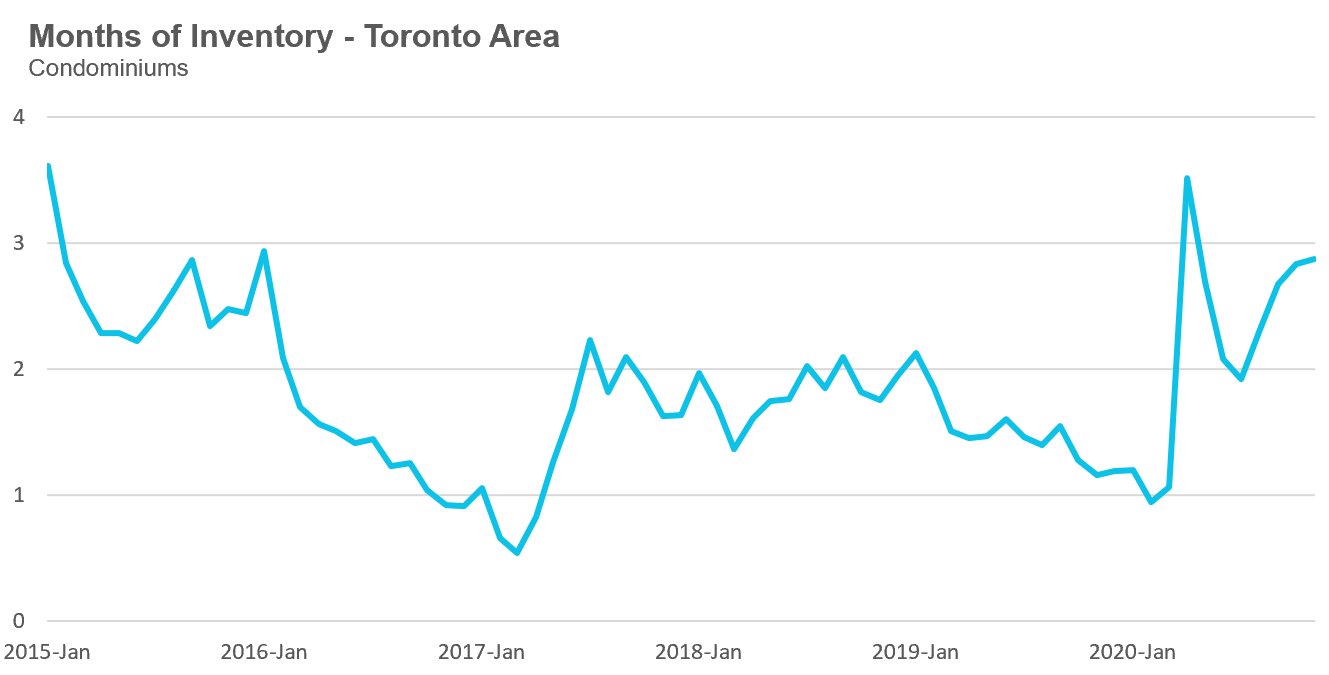
This spike in inventory is leading to the cooling of the condo market with the MOI increasing from just under 2 months in July to 2.9 in November.
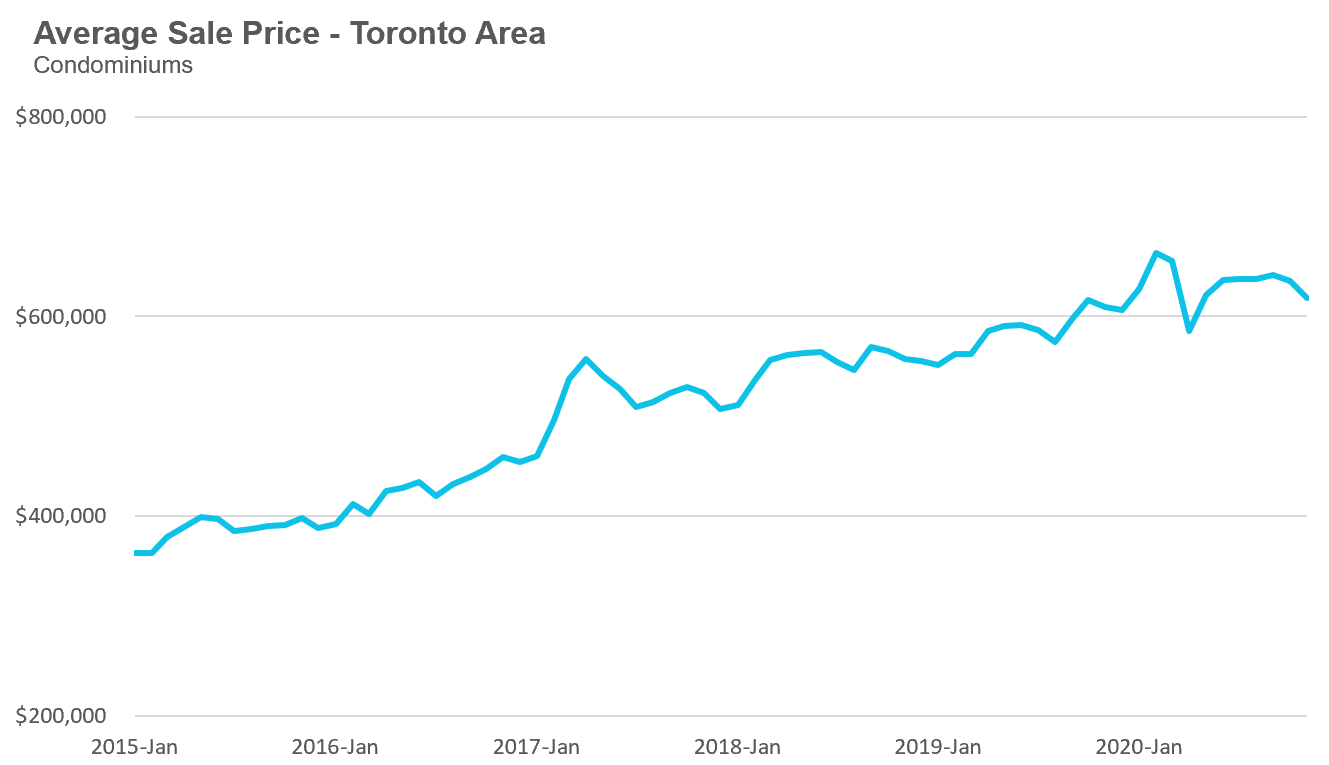
Toronto area condo prices are up 2% over last year, but are down 7% from the peak reached in the first quarter.
As noted above, the old City of Toronto's (downtown) condo market is currently cooler than in the rest of the Toronto Area with an MOI of just over 4 months. Average prices are down 5% year-over-year and down 10% from the peak reached in February 2020.
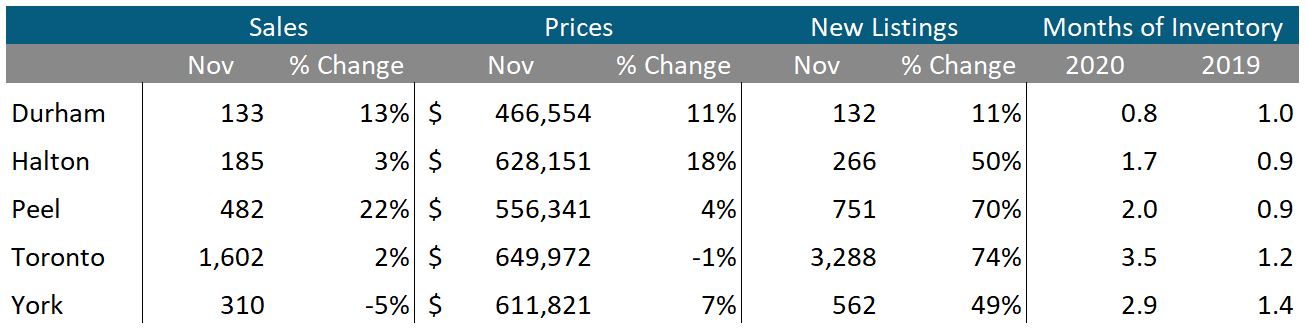
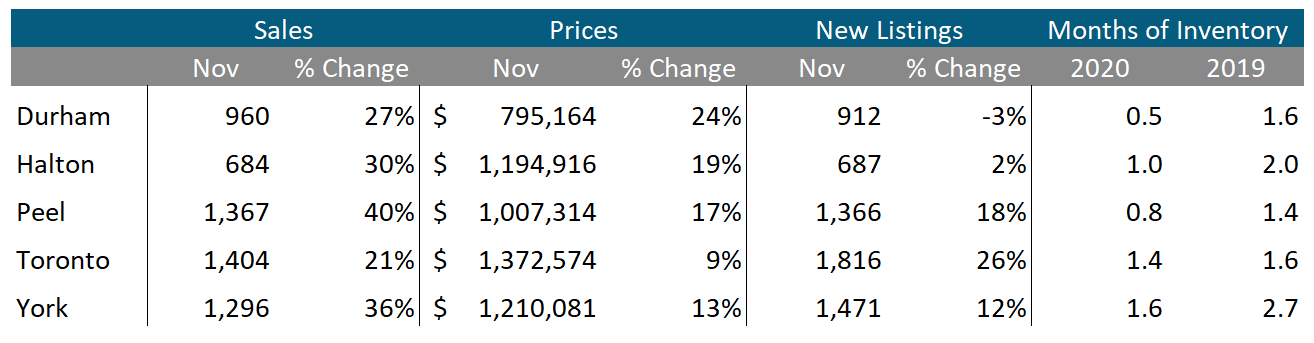
Houses
We can see that house sales and prices are up across all five regions in the Toronto Area. New listings were up in four of the five regions with Toronto seeing the biggest increase at 26% and Durham showing a 3% decline in new listings.
The MOI is down significantly in all five regions when compared to last year which tells us that the market is more competitive than it was a year ago.
Condos
Condominium (condo) sales are cooling in much of the Toronto area with Peel seeing the biggest increase at 22%. York saw a 5% decline in condo sales and the MOI for Toronto's condo market increased from 1.2 months last year to 3.5 months in November indicating a cooling market.