FREE PUBLIC WEBINAR: WATCH REPORT HIGHLIGHTS & Q/A - Thursday July 13th 12PM ET

Join John Pasalis, report author, market analyst and President of Realosophy Realty, in a free monthly webinar as he discusses key highlights from this report, with added timely observations about new emerging issues, and answers your questions. A must see for well-informed Toronto area real estate consumers.
Monthly Numbers Recap
In last month's report, I argued that the market was still hot but likely to cool, and the latest statistics for Toronto’s housing market for June confirmed that Toronto’s housing market is starting to cool down after a hot start to the year.
Average and median house prices for the latest month, June 2023, are up year-over-year for the second month in a row. (Last month marked the first time they were up since last June 2022).
Year-over-year, the average price for a house in the Toronto area was $1,451,777 in June, up 6% over the same month last year. Last month's median house price was $1,275,000, up 6% over last year (for a more detailed explanation of these two measures, see the Monthly Statistics section in the final section of this report).
House sales in June were up 13% over last year, while new house listings were down 19%. The number of houses available for sale at the end of the month, or active listings, was down 7% over last year.
The current balance between supply and demand is reflected in the Months of Inventory (MOI), which is a measure of inventory relative to the number of sales each month (for a more detailed explanation of this measure, see the final section of this report). In June, MOI for houses increased from 1.3 in May to 1.9 in June, indicating that the market is beginning to cool.
The average price for a condominium (condo) in the Toronto Area was $767,261 in June, which is unchanged over last year. The median price for a condo in June was $693,000, down 2% over last year.
Condo sales in June were up 23% over last year, while new condo listings were down 3% over last year. The number of active condo listings was down 5% over last year. The MOI increased from 1.6 in May to 2.3 in June, indicating that the condo market is also cooling down and remains less competitive than the market for low-rise houses.
For detailed monthly statistics for June 2023, the entire Toronto area market, including house, condo and regional breakdowns, see the final section of this report.
Weekly Data Trends
While the year-over-year statistics continue to suggest the market is rebounding, with both average prices and number of sales are up, in times of a changing market, month-over-month trends are a better indicator of the market’s current direction.
The first sign that the market had turned a corner was when we saw the Months of Inventory (MOI) of homes available for sale begin to trend up in the second half of last month. This chart below shows the MOI by houses (low-rise) and condos, calculated weekly.
When the MOI begins to trend up, it means that the supply of new listings coming onto the market is outpacing the demand from buyers — causing inventory levels to increase.
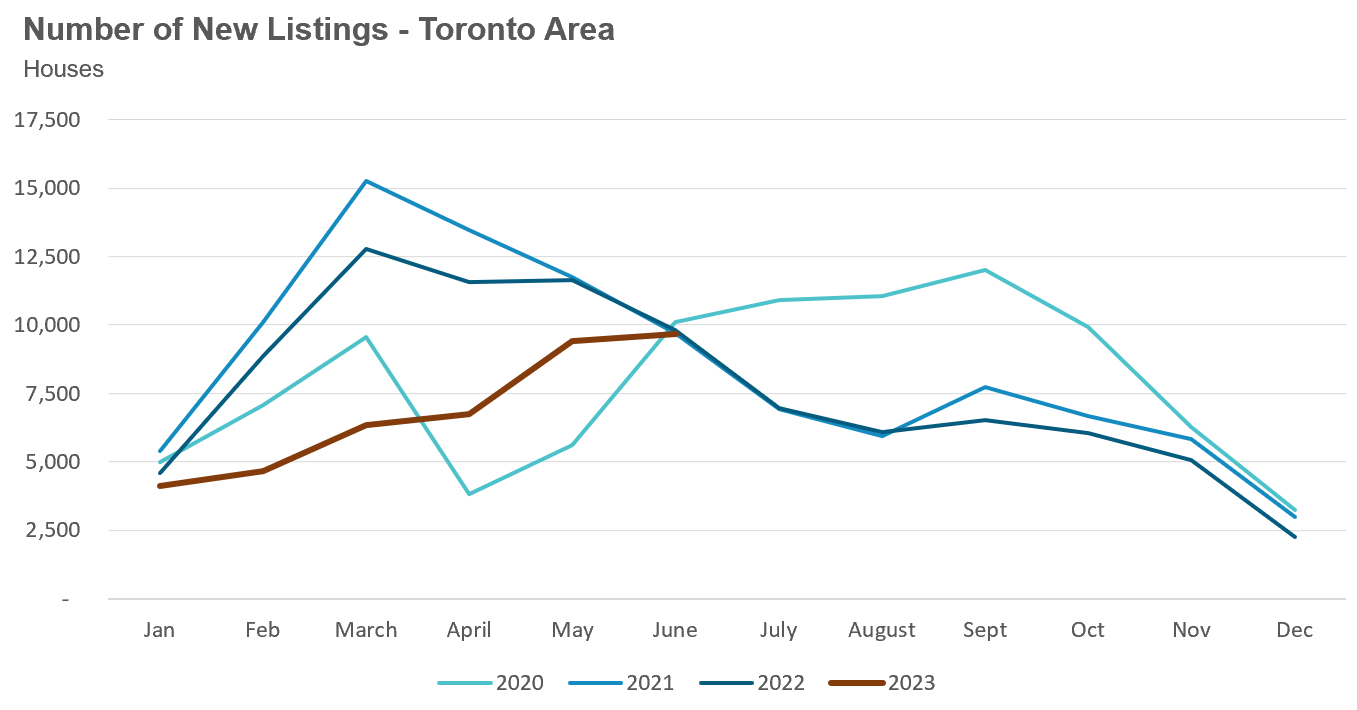
New listings have been at 20-year lows for most of this year, but we are beginning to see new listing volumes return to more normal levels. New listings of detached homes are still 10% below the previous 10-year average, but this is a notable change.
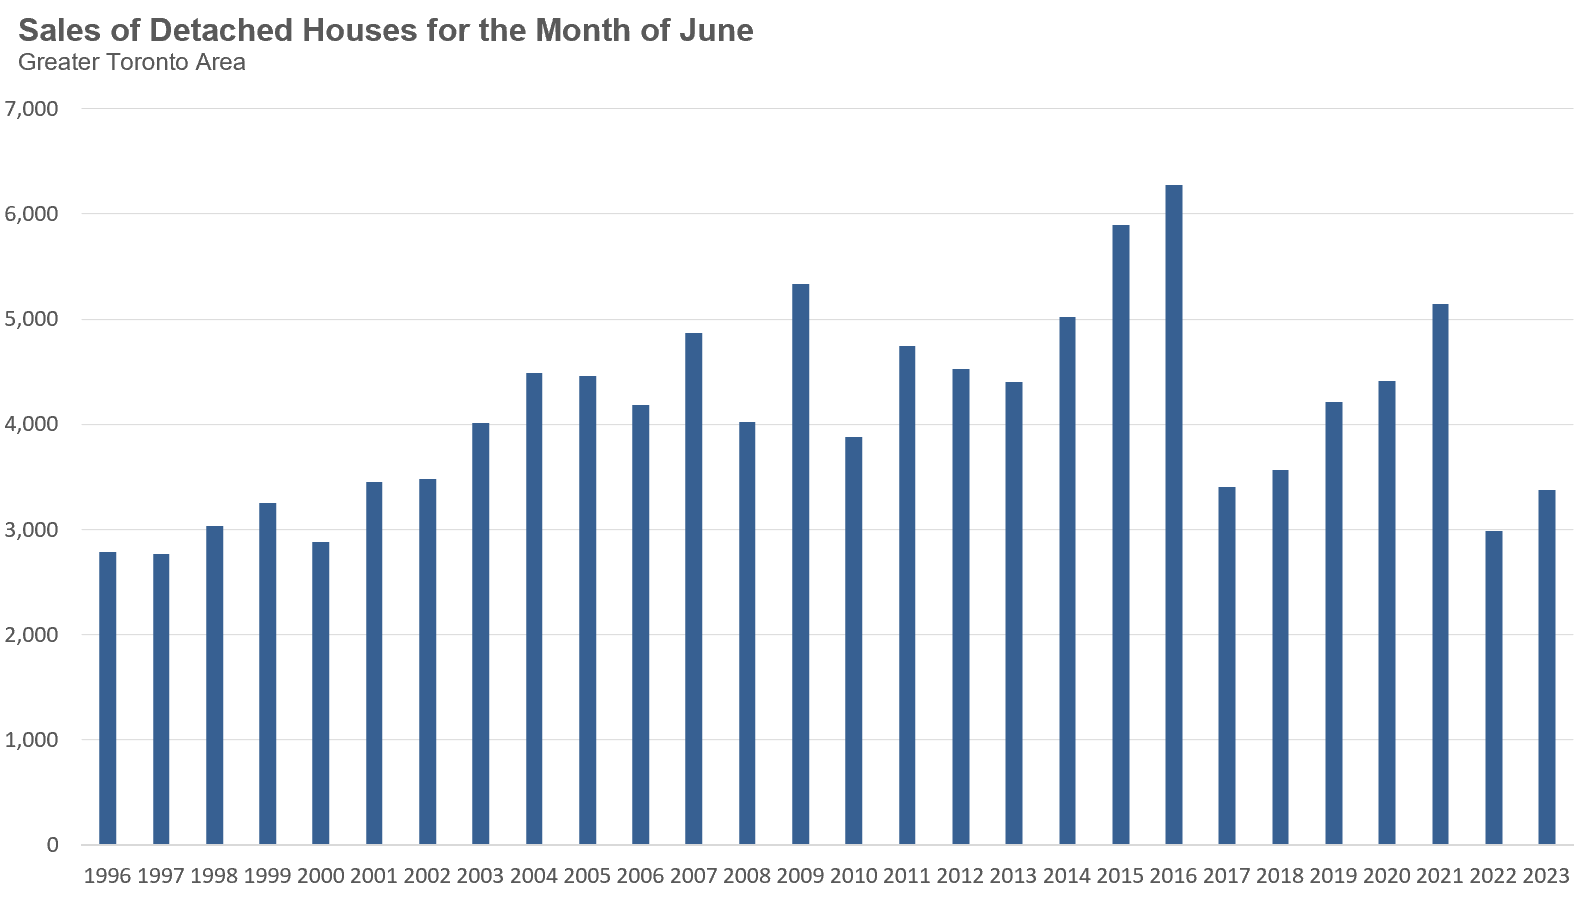
Sales of detached homes, however, have not recovered as much and are 25% below the previous 10-year average.
Active listings continue to be well below historical levels for the month of June, but this trend will likely reverse over time if new listings continue to outpace sales.
Unlike the market for detached homes, condo market statistics, including sales, new listings and active listings, are far more in line with the previous 10-year average for the month of June.
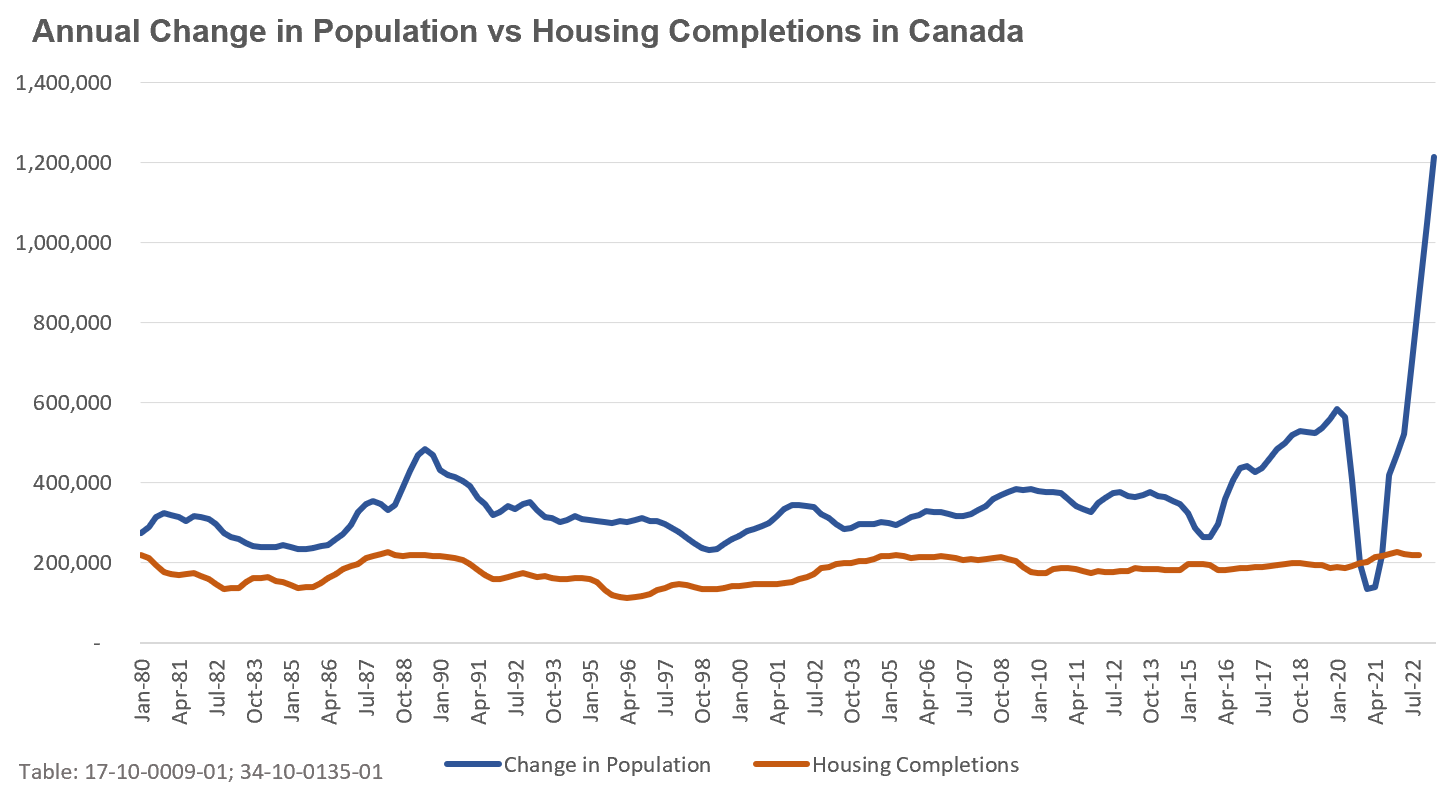
Canada’s population grew by just over 1.2 million people during the second quarter of 2023.
That’s the equivalent of adding a city roughly the size of Calgary to Canada’s population in a single year. This represents an annual growth rate of over 3%, the highest growth rate in Canada since the 1950s, and globally, the 9th highest annual population growth rate in the world.
If we compare this period led by our current Prime Minister, Justin Trudeau, to the period led by his father, Pierre Elliot Trudeau, when our population grew by roughly 1.4% per year, Canada’s population is now growing at double that pace.
While Canada has long been very welcoming of new immigrants, more and more economists are growing extremely concerned that Canada’s population growth strategy is not being coordinated with our housing policies.
While Canada’s population is growing 3X as fast as historical levels, housing completions have not seen any material change in decades as we can see in the above chart.
Adding to the concern, the Canadian Mortgage and Housing Corporation (CMHC) reports that Canada’s housing starts have been declining since November 2022 so our housing shortage will only worsen in the future.
Despite the promises from politicians, economists and housing advocates that the solution to our housing crisis is to increase the supply of homes being built, it’s becoming very obvious that governments have no ability to influence how many homes the private sector builds each year.
The outcome is a housing shortage and crisis that will ultimately affect the poorest households the most. Homeowners have benefited from our housing shortage as home prices have surged over the past ten years. Meanwhile, renters have seen average rents up by double digits across most cities in Canada without benefitting from any of the appreciation of housing assets.
As long as Canada’s population continues to grow at this rate, and as long as politicians and housing supply advocates pretend that our housing crisis can be solved by rapidly increasing the supply, we can expect this housing affordability crisis to continue.
“The Government of Canada has huge macroeconomic levers not available to the provinces. They regulate our banking system through the Office of the Superintendent of Financial Institutions. They regulate the mortgage market through CMHC’s mortgage insurance programs, and Finance Canada plays a big role in regulating our financial services sector. And these, by far and away, are the cause of the housing crisis in Canada.”
- Conservative MP Michael Chong
Before we unpack Chong’s theory, it’s important to clarify that Chong is not arguing that cheap credit (i.e., low interest rates) was the cause of our crisis. Mortgage interest rates in Canada are driven by the Bank of Canada (BoC) and by the bond market, not the Office of the Superintendent of Financial Institutions (OSFI) or CMHC, that latter of which Chong is referring to.
Given this, Chong appears to be making two arguments in his speech.
Firstly, that it is far too easy to get a mortgage in Canada, and this is contributing to the boom in home prices. This first point is an odd argument because underwriting guidelines in Canada are very conservative at federally regulated banks. Due to Canada’s mortgage ‘stress test’, buyers have to qualify for their mortgage at an interest rate that is at least 2% above what they would actually be paying.
Chong’s second concern is related to growing household debt in Canada. A big driver of the growth in household mortgage debt comes from existing households refinancing their homes to extract some of that equity out to do renovations, consolidate their debt or even invest in more real estate. While growing mortgage debt is indeed a problem, it’s a stretch to argue that it is the primary cause of our housing crisis.
But I’d like to briefly unpack Chong’s theory even further because it’s one I hear frequently.
Many people appear to believe that the primary driver of rapidly rising home prices in Canada is easy access to credit, or credit availability. While mortgage credit growth is always an important driver of home price growth, the key question is whether it’s the primary driver of such price appreciation. I don’t.
Contrary to this common wisdom, I think a deeper look at the data shows that capital rather than debt has been a bigger factor in driving home price growth in Canada over the past decade.
Firstly, a household’s maximum borrowing capacity is usually a function of its income, and the upper limit a household can typically borrow is approximately 4.5-5X their household income.
The chart below shows the share of new mortgages in Canada with a Loan-to-Income (LTI) ratio above the lower end of this threshold (450% or 4.5X income).
In 2014, the median home price was 6X the median household income; in 2022, the median home price had grown to 10X the median household income. As the chart above shows, the percentage of people borrowing more than 4.5X income does not show a corresponding increase that equals the magnitude of growth in home prices reaching 10X income. This suggest that the growth of home prices cannot be explained by changes in income, and by extension, mortgage debt alone.
In fact, when we look at the average initial Loan-to-Value (LTV) ratio for mortgages in Canada, we can see that it has been trending down since 2014. The BoC’s LTV ratio measures “the initial equity stake that a homebuyer has in their house…it is calculated when a new mortgage is issued and compares the size of the mortgage to the market value of the property”.
The decline in the LTV ratio means that the amount of debt home buyers are taking on relative to the value of the home they are buying is falling. This is not the trend one would expect if the housing market was being driven by easy access to mortgage debt.
If we take the BoC’s average LTV ratios above and assume those ratios hold for Toronto, we can estimate the average down payment and mortgage amount in Toronto for an average-priced home over that period. Doing so reveals an important trend — the average down payment amount between the first quarter of 2014 and the first quarter of 2023 increased by 144% compared to an increase of 81% in the average mortgage debt amount over that same period. So while mortgage debt has increased over this period, it has not increased as much as the downpayment home buyers are contributing towards their home purchases.
This is why I suspect that capital, and not debt, has been the primary driver of house price growth in Toronto over the past decade.
Where has all this extra capital come from?
I think there is sufficient anecdotal evidence to suggest that the answer to this question is multi-factored. One factor is likely the increasing amounts of capital Canadian homeowners are able to access due to their home appreciation to finance the purchase of other properties whether as investments or to help their offspring and other family members purchase homes. Another part of the picture may be newcomers to Canada with more capital to invest in homes than their incomes would suggest.
I believe that far more investigation into all sources of capital needs to be part of our housing discourse if we are to better understand and respond to the housing affordability crisis.
House sales (low-rise freehold detached, semi-detached, townhouse, etc.) in the Greater Toronto Area (GTA) in June 2023 were up 13% over the same month last year.
New house listings in June were down 1% over last year and well below historic new listing volumes for the month of June.
The number of houses available for sale (“active listings”) was down 7% in June when compared to the same month last year.
The Months of Inventory ratio (MOI) looks at the number of homes available for sale in a given month divided by the number of homes that sold in that month. It answers the following question: If no more homes came on the market for sale, how long would it take for all the existing homes on the market to sell, given the current level of demand? The higher the MOI, the cooler the market is. A balanced market (a market where prices are neither rising nor falling) is one where MOI is between four to six months. The lower the MOI, the more rapidly we would expect prices to rise.
While the current level of MOI gives us clues into how competitive the market is on-the-ground today, the direction it is moving in also gives us some clues into where the market may be heading.
The MOI for houses increased from 1.3 in May to 1.9 in June signalling a market that is cooling down.
The share of houses selling for more than the owner’s asking price decreased to 62% in June.
The average price for a house in June was $1,451,777 in June 2023, up 6% when compared to the same month last year.
The median house price in June was $1,275,000, up 6% over last year
The median is calculated by ordering all the sale prices in a given month and then selecting the price that is in the midpoint of that list such that half of all home sales were above that price and half are below that price. Economists often prefer the median price over the average because it is less sensitive to big increases in the sale of high-end or low-end homes in a given month which can skew the average price.
Condo (condominiums, including condo apartments, condo townhouses, etc.) sales in the Toronto area in June 2023 were up 23% over the same month last year.
New condo listings were down 3% in June over last year.
The number of condos available for sale at the end of the month, or active listings, was down 5% over last year.
Condo months of inventory increased from 1.6 in May to 2.3 MOI in June, a sign that the condo market is beginning to cool.
The share of condos selling for over the asking price remained unchanged at 43% in June.
The average price for a condo in June was $767,261, unchanged over last year. The median price for a condo in June was $693,000, down 2% over last year.
Average house prices were up across the GTA last month while sales were up in all regions except Durham, which saw a slight decline. New listings were down in Durham, Halton and Toronto. While MOI has been trending up on a month-to-month basis (as discussed in the first section of this report), we can see that MOI is below last year’s levels for four out of the five regions, which indicates the market is still more competitive today than it was a year ago.
Condo sales were up across all regions in the GTA last month, while prices were up slightly only in Halton, Peel and York. New listings were down in Durham, Halton and Peel, and slightly up in Toronto and York. As for houses, MOI numbers this year are lower in most regions, suggesting a more competitive now as compared to last year; however, month-to-month MOI numbers are increasing (as discussed in the first section of this report).
See Market Performance by Neighbourhood Map, All Toronto and the GTA
Greater Toronto Area Market Trends