FREE PUBLIC WEBINAR: WATCH REPORT HIGHLIGHTS & Q/A - Thursday March 16th 12PM ET

Join John Pasalis, report author, market analyst and President of Realosophy Realty, in a free monthly webinar as he discusses key highlights from this report, with added timely observations about new emerging issues, and answers your questions. A must see for well-informed Toronto area real estate consumers.
In last month’s report, I discussed the early signs I was seeing that the housing market in the Toronto area was starting the year hot. One month later, my very early interpretation of the latest data and trends appears to have been correct.
After the Bank of Canada raised its interest rate a record 425 basis points starting in March of last year, one would expect this winter’s housing market to remain soft and even see prices trend down further as the market adjusts to today’s much higher interest rates. But Toronto’s housing market is defying all expectations and is starting the year more competitive than anyone expected.
While sales remained at near 20 year lows for the month of February, new listings were at a 20-year low and the imbalance between supply and demand kept the market competitive. The month of February saw just over 1,400 more homes sell when compared to the previous month, but new listings over the same period were up by only 668.
In other words, the change in sales outpaced the change in new listings by a margin of 2:1.
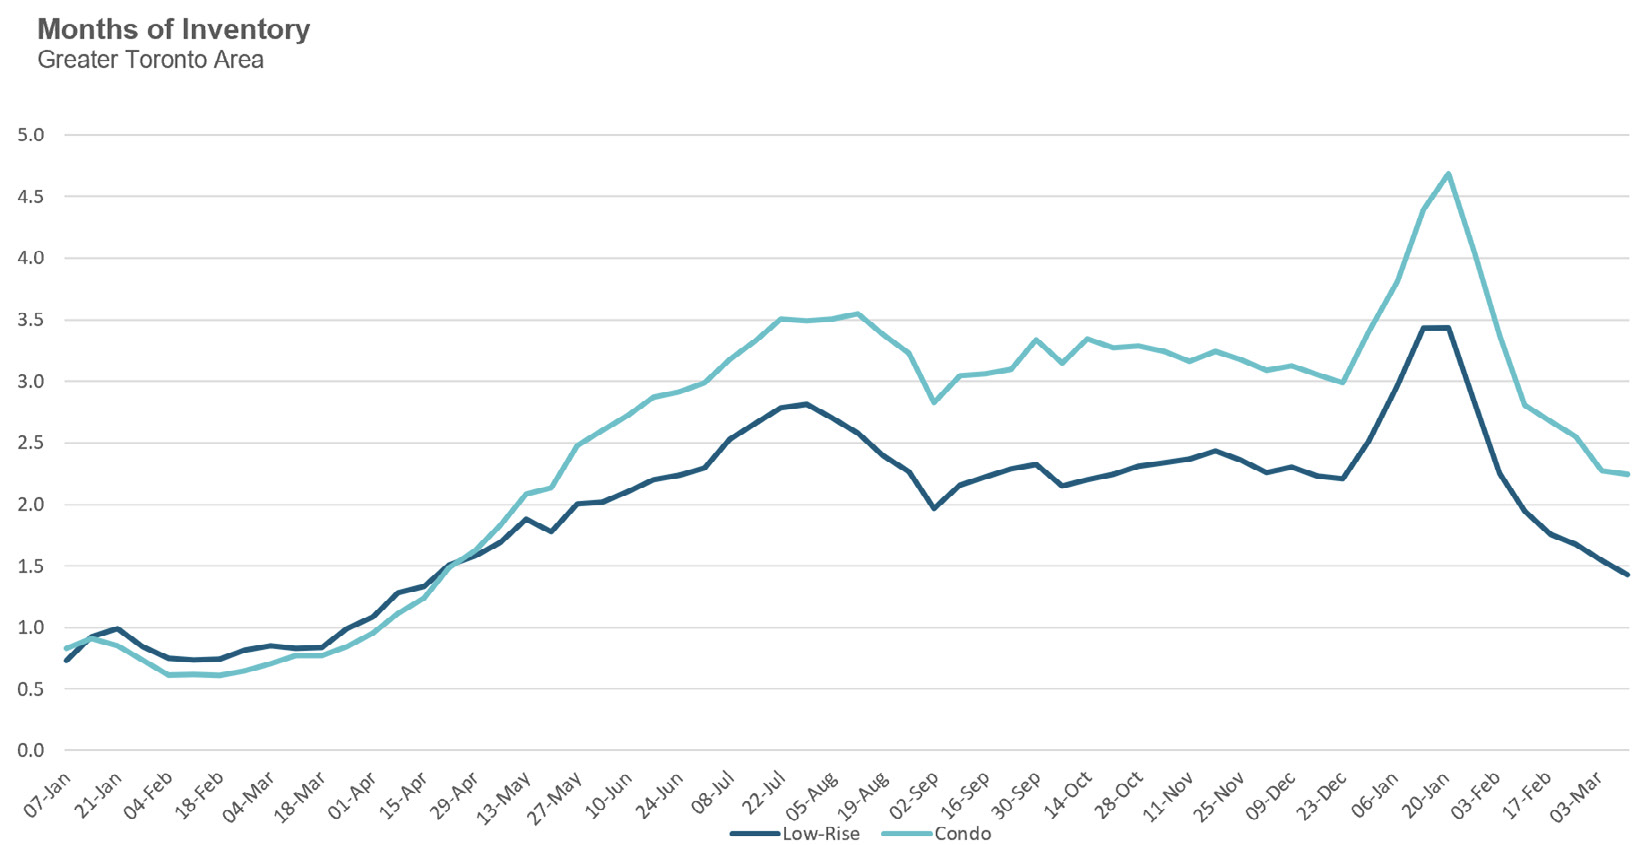
Looking at a weekly measure of MOI for houses and condos, it’s been trending down rapidly to start the year and inventory levels for houses during the second week of March were at their lowest level since April 2022, and, for condos, at their lowest level since May 2022.
On the ground, we are seeing a significant increase in the number of showing requests homes are receiving once they come on the market for sale and an increase in the number of homes receiving multiple offers. During the second week of March, 44% of houses sold for more than the seller’s list price, the highest level since June 2022. The condo market is less competitive with 29% of condos selling for more than the list price.
While the vast majority of homes receiving multiple offers are selling for their market value, I have been seeing more and more homes sell for prices that are well above their market value. If this trend continues, we’ll likely see some upward pressure on prices as we move towards the spring market.
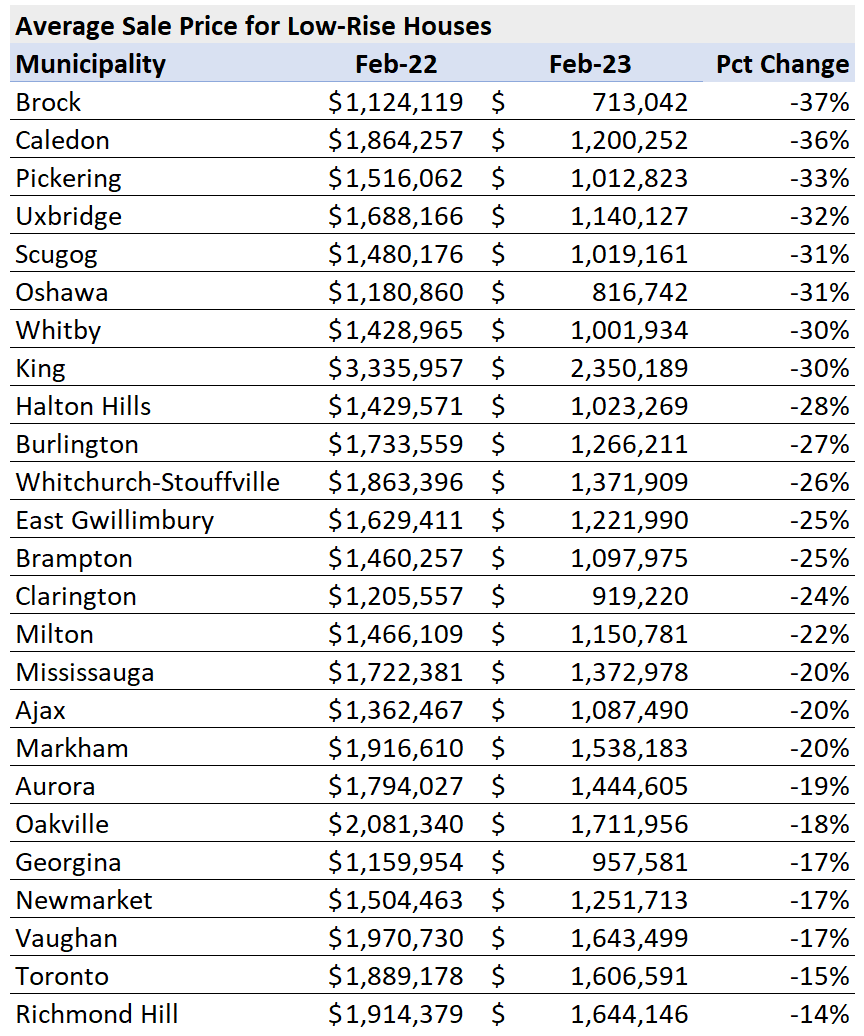
Home prices in the Greater Toronto Area peaked in February 2022. One year later, here’s how average house prices have changed by municipality.
Note: Because condo sales are concentrated in a handful of municipalities in the Toronto area, a regional comparison was less relevant and omitted from this survey.
In this month’s Data Dive, I wanted to take a closer look at how changes in the number of sales, listings and prices differ across regions and house types in the GTA during the first two months of 2023.
I’ll start by looking at trends for houses first and will follow that up with a look at the condo market.
Houses
As mentioned earlier, one of the biggest factors contributing to the competition in Toronto’s housing market is that the demand for homes right now is outpacing the supply of new listings coming on the market. We can see this by comparing how the number of sales and new listings changed from January to February.
February saw 864 more houses sell when compared to January, but new listings over the same period were up by just 520.
The chart below shows the change in the number of house sales and new listings between February and January for all five regions. Durham and Pell saw house sales eclipse new listings by more than 3 times.
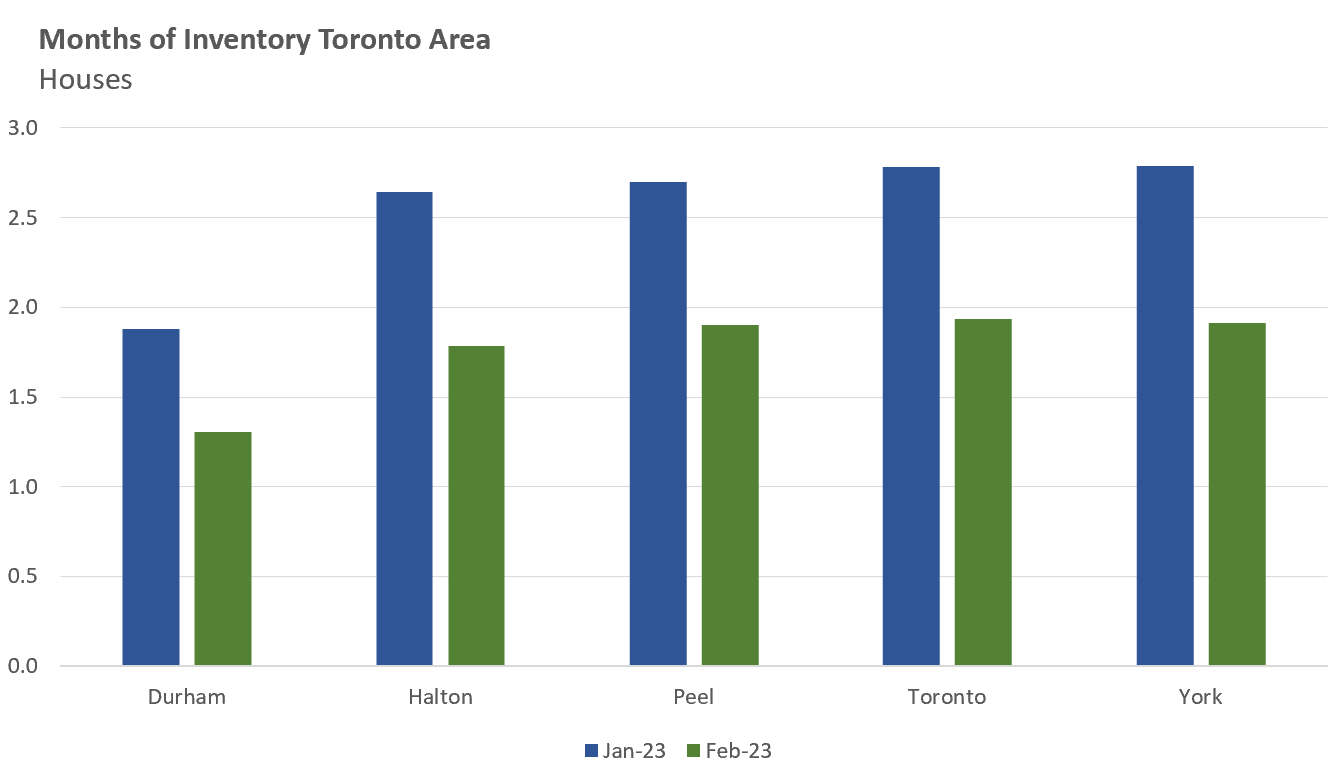
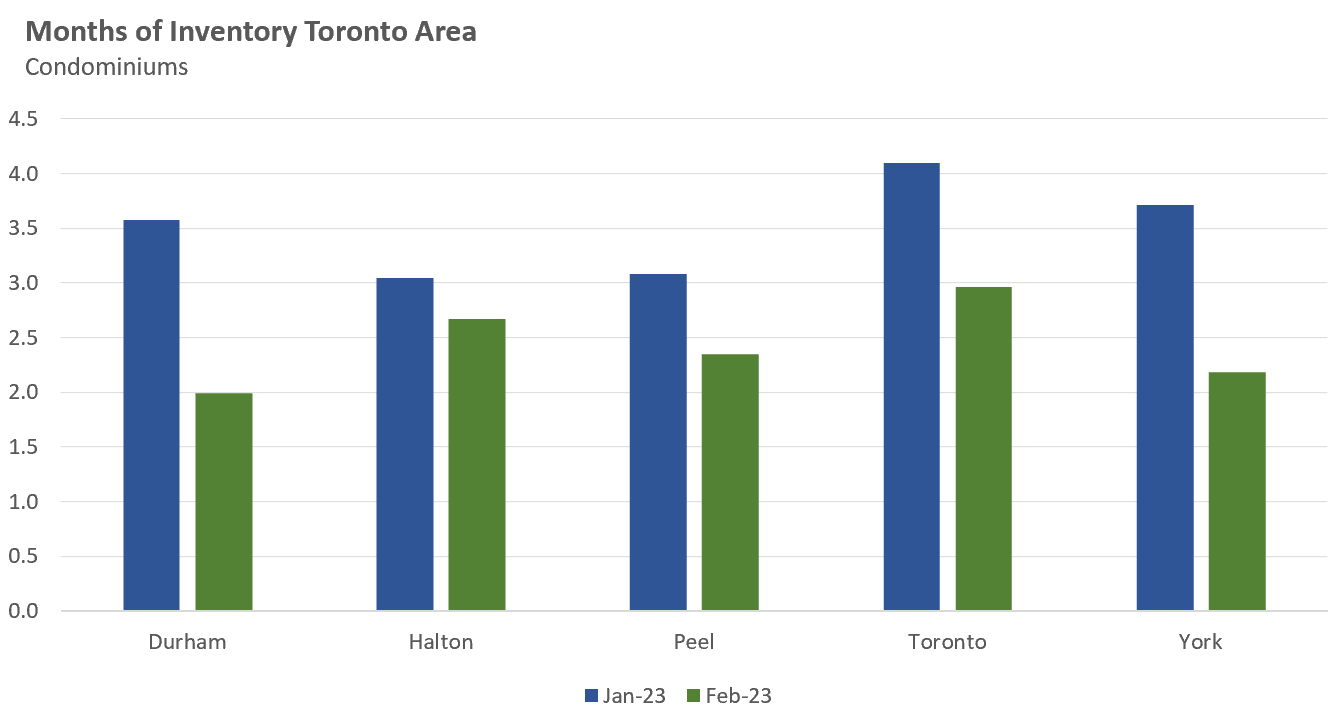
The chart below shows how the Months of Inventory (MOI) for houses changed from January to February 2023 across all five regions. All five regions had less than 2 MOI in February.
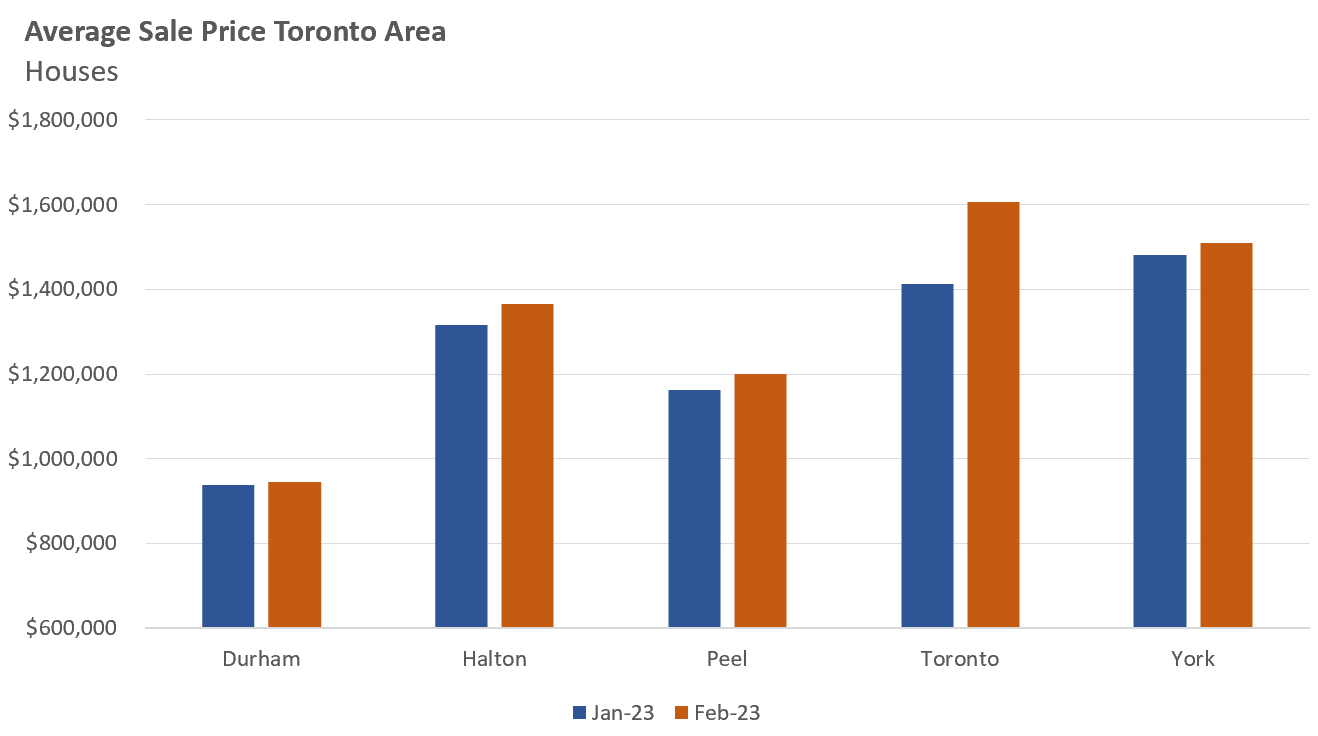
All five regions saw average sale prices edge up from January to February (a typical seasonal trend) with Toronto seeing the biggest increase, up 14% in a single month. The change in the median sale price for the City of Toronto was 7%.
Condos
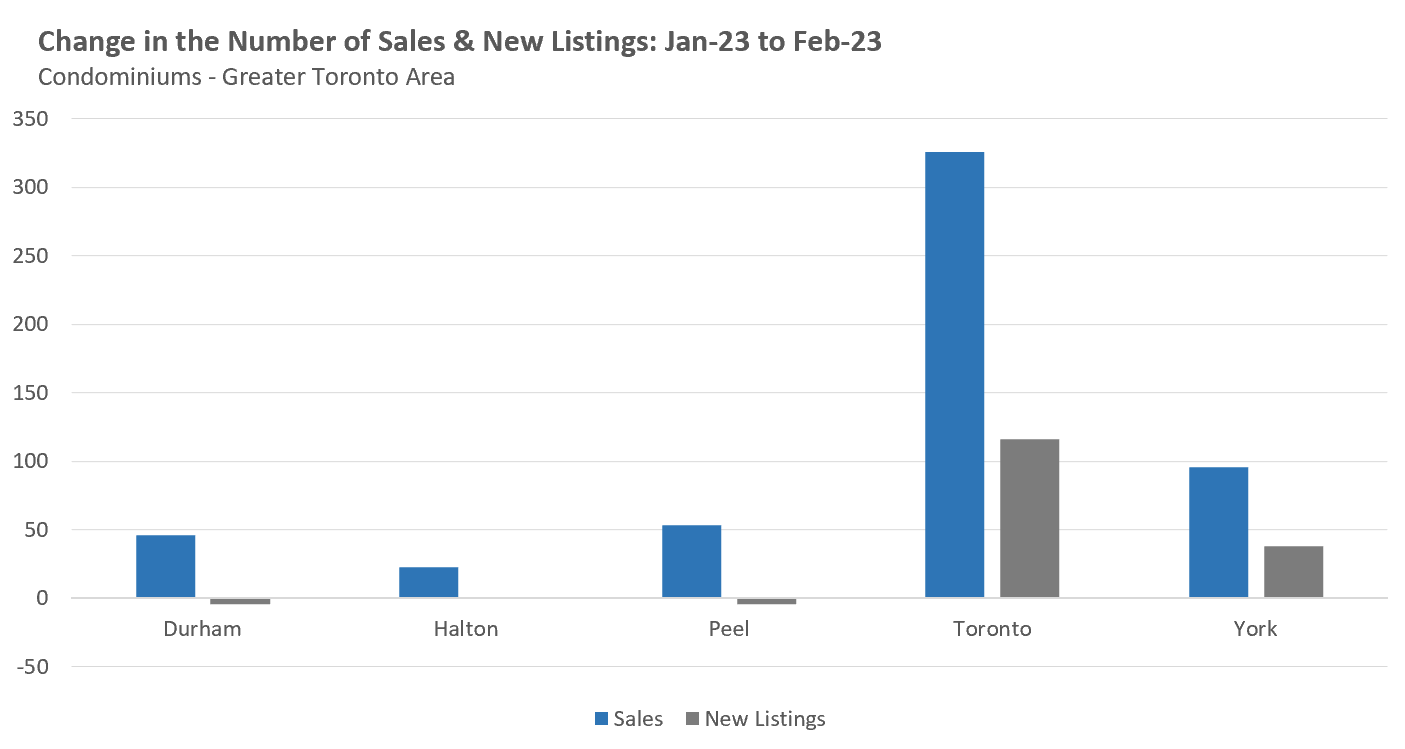
The condo market saw sales increase by 544 between February and January while new listings only increased by 148 units, which means that sales increased nearly 4 times as fast as the change in new listings.
The City of Toronto saw the biggest increase in sales and new listings while new listings actually declined slightly in Durham and Peel regions.
The MOI fell for all five regions in February and ended the month below 3 MOI.
Average sale prices edged up across all five regions with Halton seeing the biggest increase over January up 9% and the median price up 6%.
These early trends suggest that the signs of renewed competition for Toronto area real estate is relatively broad-based, impacting all home types and all regions in the Toronto area.
House sales (low-rise freehold detached, semi-detached, townhouse, etc.) in the Greater Toronto Area (GTA) in February 2023 were down 50% over the same month last year and well below historic sales volumes for the month of February.
New house listings in February were down 48% over last year and well below historic sales volumes for the month of February.
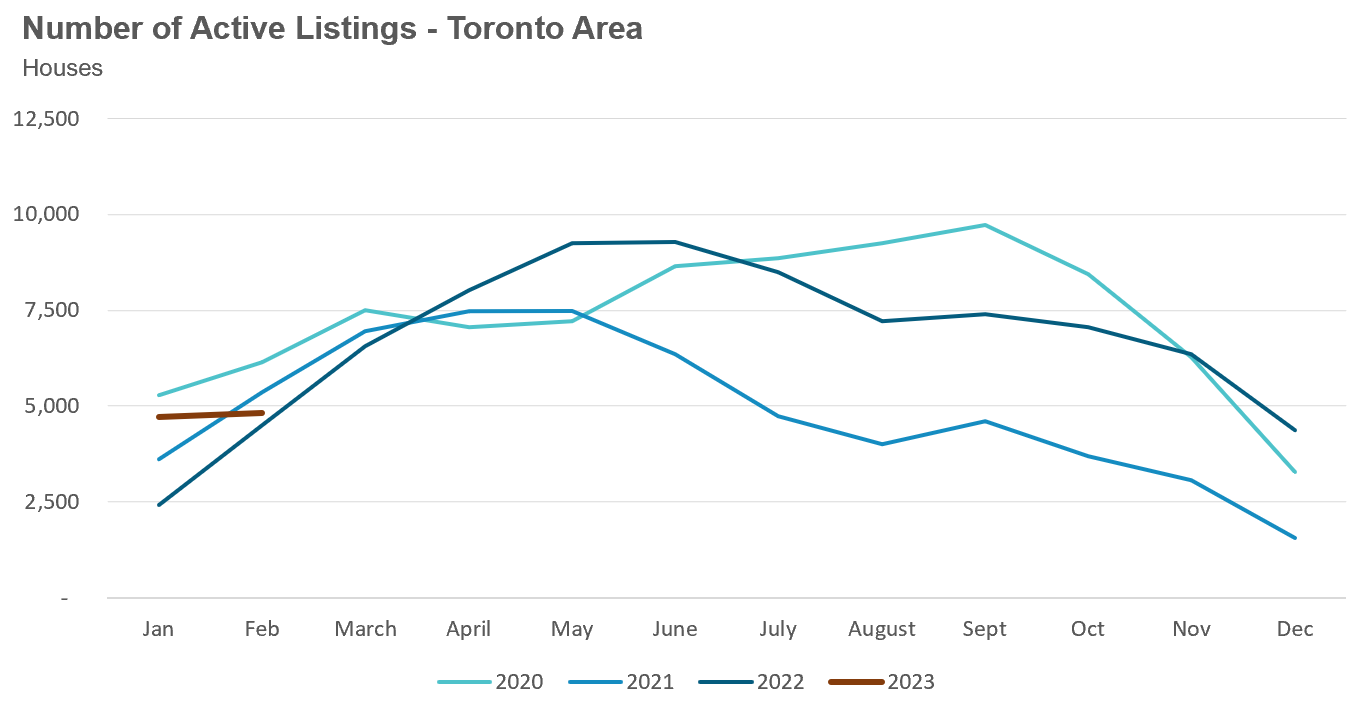
The number of houses available for sale (“active listings”) was up 7% when compared to the same month last year, but still well below pre-Covid levels for the month of February.
The Months of Inventory ratio (MOI) looks at the number of homes available for sale in a given month divided by the number of homes that sold in that month. It answers the following question: If no more homes came on the market for sale, how long would it take for all the existing homes on the market to sell given the current level of demand?
The higher the MOI, the cooler the market is. A balanced market (a market where prices are neither rising nor falling) is one where MOI is between four to six months. The lower the MOI, the more rapidly we would expect prices to rise.
While the current level of MOI gives us clues into how competitive the market is on-the-ground today, the direction it is moving in also gives us some clues into where the market may be heading.
The MOI for houses dropped to 1.8 MOI in February.
The share of houses selling for more than the owner’s asking price increased to 38% in February.
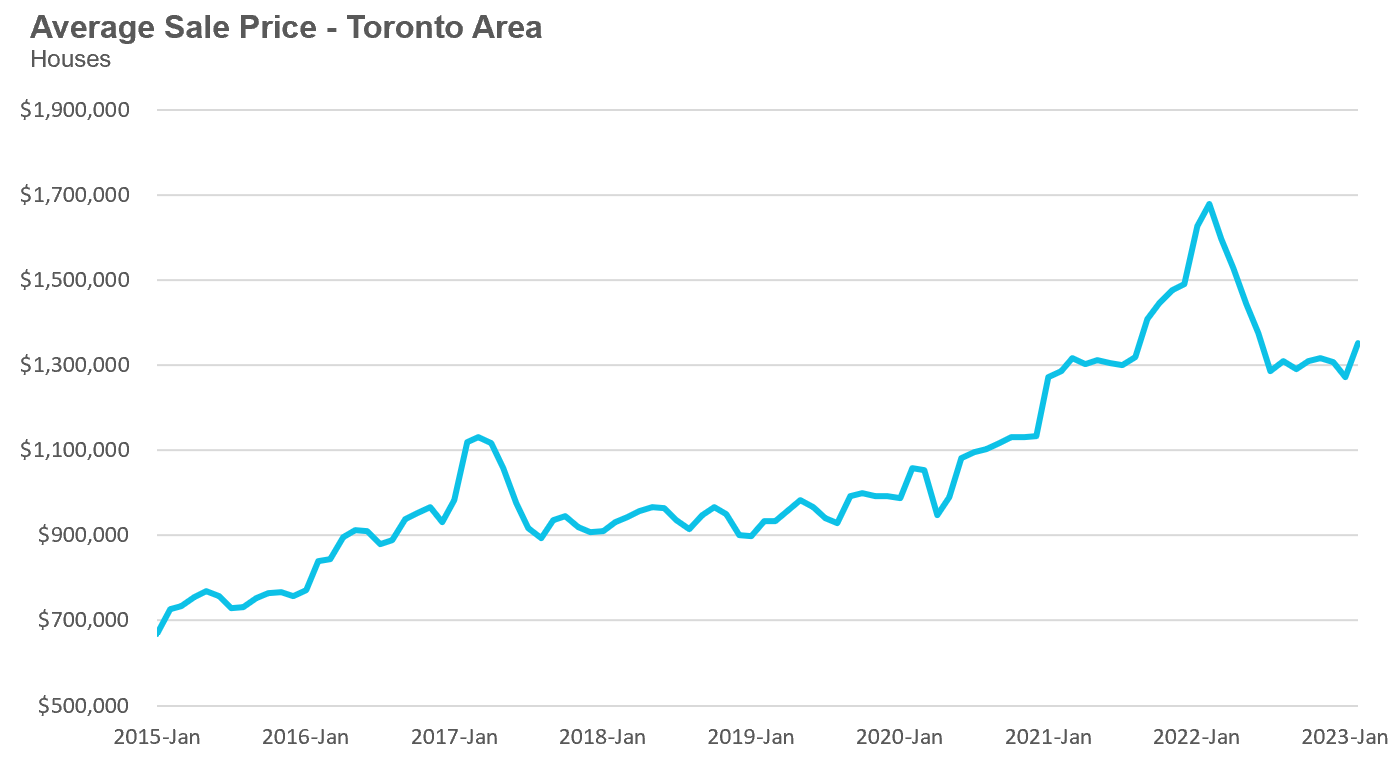
The average price for a house in February was $1,352,275 in February 2023, well below the peak of $1,679,429 reached in February and down 19% when compared to the same month last year. It’s worth noting that the average sale price did increase over the previous month and was at its highest level since June 2022.
The median house price in February was $1,179,000, down 21% over last year, and below the peak of $1,485,000 reached in February.
The median is calculated by ordering all the sale prices in a given month and then selecting the price that is in the midpoint of that list such that half of all home sales were above that price and half are below that price. Economists often prefer the median price over the average because it is less sensitive to big increases in the sale of high-end or low-end homes in a given month which can skew the average price.
Condo (condominiums, including condo apartments, condo townhouses, etc.) sales in the Toronto area in February 2023 were down 51% over last year and well below pre-COVID sales volumes for the month of February.
New condo listings were down 29% in February over last year.
The number of condos available for sale at the end of the month, or active listings, was up 83% over last year.
Condo months of inventory levels decreased to 2.7 MOI in February.
The share of condos selling for over the asking price remained unchanged at 23% in February.
The average price for a condo in February was $723,659, down from the peak of $840,444 in March, and down 14% over last year. The median price for a condo in February was $650,000, down 16% over last year, and down from the March peak of $777,000.

Houses
This month, we are comparing sales and price trends against the peak in February 2022 and we can see that Durham region saw the biggest drop in average price, down 28% while average prices in Toronto are down by just 15%. Sales were down significantly across all regions and inventory levels were well ahead of last year’s level.
Condos
Average condo prices saw the biggest year-over-year decline in Durham region with Halton showing a decline of just 8% compared to last year. Sales were down significantly across all regions and inventory levels were well ahead of last year’s level.
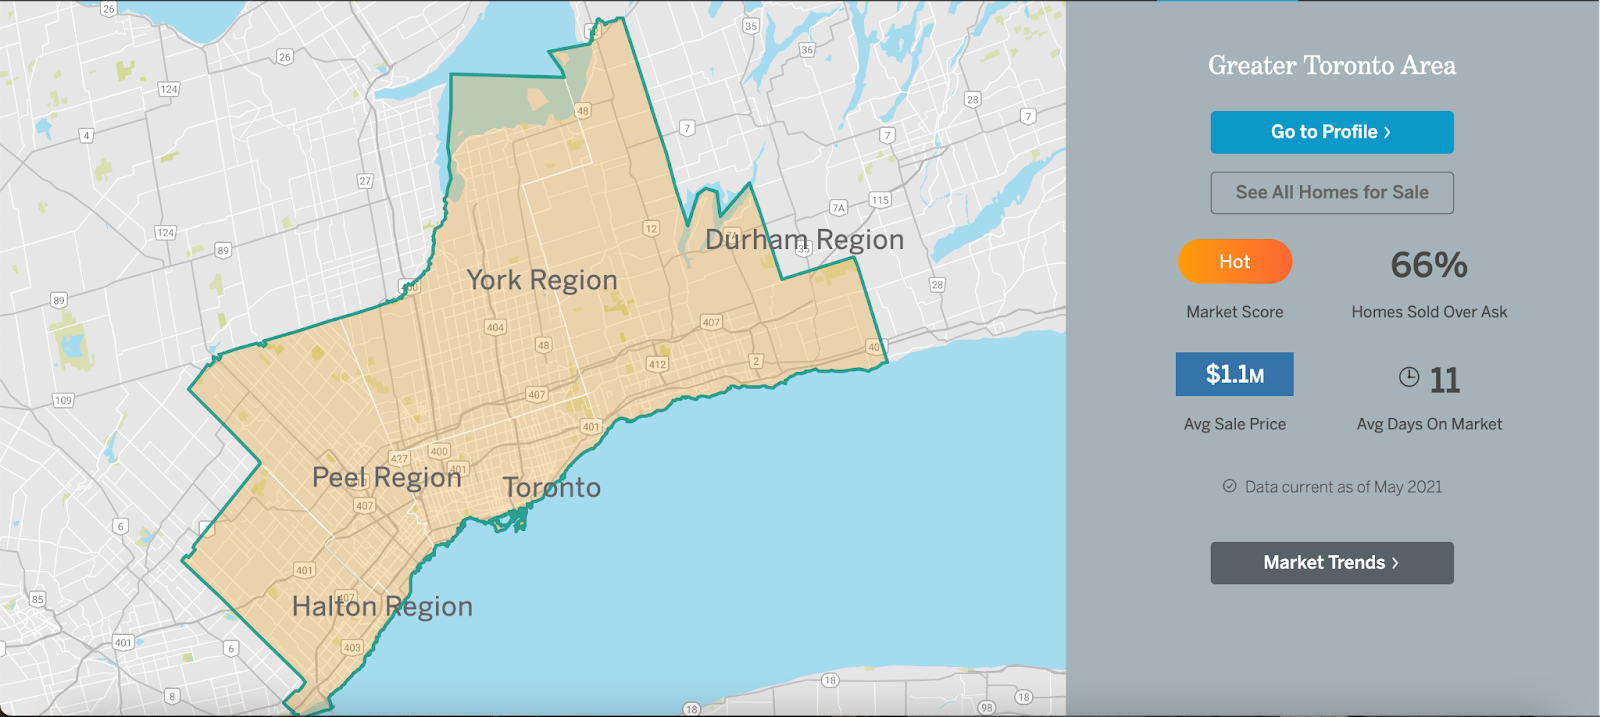
See Market Performance by Neighbourhood Map, All Toronto and the GTA
Greater Toronto Area Market Trends