While I believe in the value in thinking through the worst case scenario, I thought it would be helpful to take a look at how accurate CMHC’s forecast has been to date and to assess the likelihood of a decline in prices by year end as we head into the fall market.
It’s important to note that the CMHC’s forecast is more nuanced than many media headlines suggested, so the widely reported 18% projected price decline is a national average, with variances between different regions. So it’s important to take a look at CMHC’s specific forecast for the Greater Toronto Area (GTA).
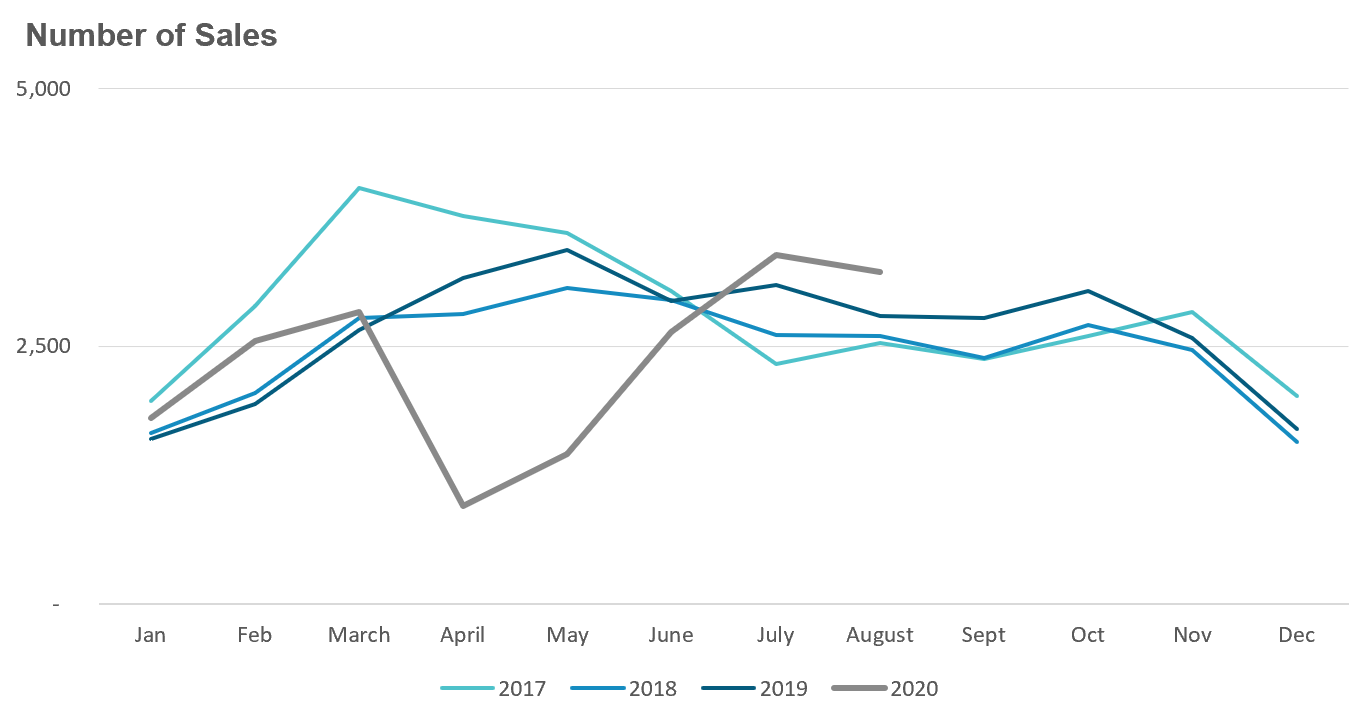
First, let’s look at CMHC’s prediction for GTA home sales:
"Home sales in the Greater Toronto Area (GTA) will decline for the rest of this year, and then start to recover by 2021 Q1 and show growth throughout 2022."
The GTA had 87,754 sales in 2019 and was on pace in early 2020 to exceed 90,000 sales this year. CMHC's sales forecast (see table below) showed quarterly sales as seasonally adjusted annual figures.
CMHC Forecast for the Toronto Area
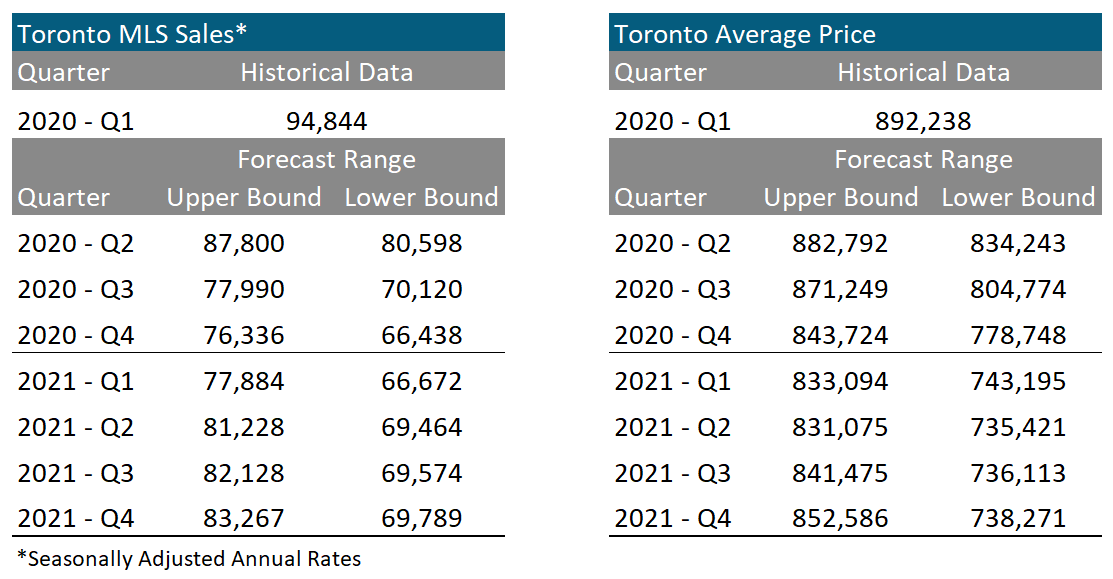
CMHC predicted that in their best case scenario (the upper bound) annualized seasonally adjusted sales in the third quarter of this year would fall to 77,990 but possibly as low as 70,120 (their lower bound). While we have one month left in the third quarter, the first two months can give us some insight into how likely it is that CMHC’s prediction will come true.
In July and August of 2020, the GTA had 21,493 home and condo sales, a 33% increase over last year and the highest volume of sales for July and August on record. Even if home sales in September see no increase over last year, the number of sales in Q3 2020 would come to an annual seasonally adjusted sales volume in the 115,000 range; 47% higher than CMHC’s optimistic forecast.
Now assuming that we will see the July and August sales highs continue for the rest of the year is not realistic so it is unlikely we will see 115,000 homes sales in the GTA in 2020. It's more helpful to consider that sales from Jan to Aug this year as compared to the same period last year are down just 4%, which suggests that the Toronto market is on track to achieve a similar sales volume to 2019 of 87,754.
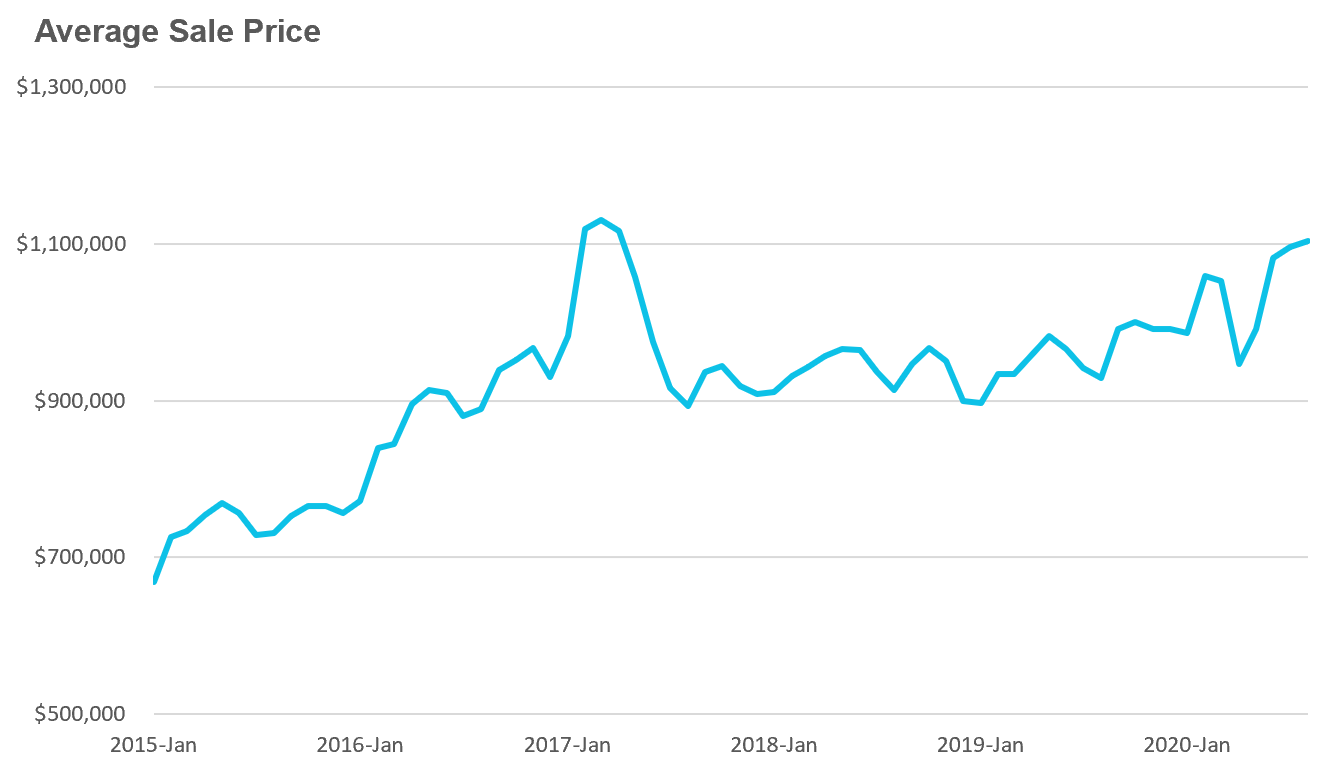
Now, let’s turn to the CMHC’s prediction for average home prices in the GTA:
"Average house prices were on an upward trajectory during the time period leading up to the provincial lockdown in mid-March. They will decline throughout the remainder of this year and into 2021."
CMHC expects the average home prices to fall to $871,249 in the third quarter of this year, down from $892,238 during the first quarter.
For the first two months of the third quarter (July and August), average home prices in the GTA were $954,000, 10% above CMHC’s forecast and 7% above the average price for a home during the first quarter.
It is worth noting that there was some volatility in the types of homes selling in Q2 and Q3 this year which is skewing average prices quarter over quarter and year over year. In the Covid-19 crisis, the second quarter saw disproportionately more condos sell vs house (pulling average prices down); in the third quarter, that trend reversed resulting in proportionately more houses selling compared to condos (houses are generally more expensive so more house sales tends to skew the average price higher).
But even if we control for the difference in the composition of homes selling this year, average home prices for July and August would still be in the $918K range – well above CMHC’s forecast and higher than the first quarter.
Anyway you look at the data, Toronto’s housing market - at least for now - is moving in the opposite direction of CMHC’s forecast. CMHC predicted a gradual decline while Toronto’s housing market is seeing sales and prices increase.
Normally, it would be unfair to judge any economic forecaster too harshly for an inaccurate forecast during such unprecedented and volatile times. But CMHC took a very strong position when it came to their Covid-19 forecast as opposed to others.
At the start of the Covid-19 crisis, CIBC and Scotiabank were forecasting a slight decline in prices while the Toronto Regional Real Estate board was expecting prices to end the year flat compared to 2019. Re/Max predicted prices would remain stable or possibly see a single digit correction. Royal LePage was forecasting a modest 1.5% increase in prices for the GTA while TD Canada Trust had one of the more positive forecasts expecting prices to end the year up 8%.
CMHC’s CEO Evan Siddall was notably not impressed with any of the forecasts that were more optimistic than their own, saying that:
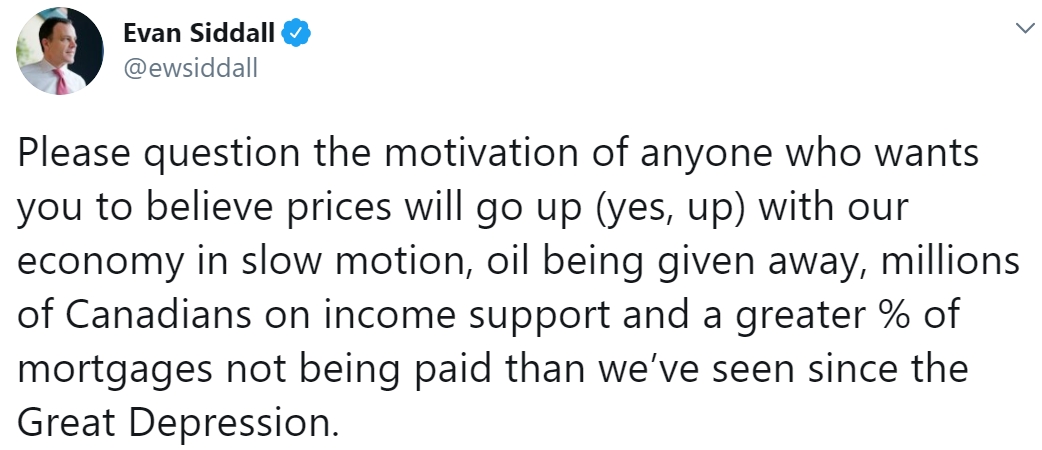
Given that TD had the most optimistic forecast, one can only conclude that Siddall believes that something other than an honest economic analysis was behind it. But interestingly enough, with average home prices up 13% year to date, TD's forecast is on pace to being the most accurate while CMHC’s is on track to be the least accurate.
CMHC was so confident that house prices would crash, it felt it was critical to unilaterally tighten credit to “protect future home buyers” from the “tragic prospect of foreclosure” which it did on July 1 by introducing new rule changes for those looking to qualify for CMHC mortgage insurance.
Normally, changes in lending guidelines for insured mortgages are led by the Department of Finance and all mortgage insurers (CMHC and their private sector competitors) have to adopt the same changes. But Canada’s Department of Finance wasn’t persuaded by CMHC’s analysis and recommendations so they did not require CMHC’s competitors to tighten their lending guidelines along with CMHC.
Since then, the “high risk” buyers the CMHC was trying to protect with their rule changes have gone to competitors and the CMHC has experienced a drastic decline in revenue and market share.
While there are plenty of unknowns to come in the remaining quarter of this year including the impact of the rolling back of government emergency income support and mortgage deferral programs, the market would require a very dramatic change in sales and home prices to even approach CMHC’s least pessimistic forecast.
With home prices still rising by double digits and Inventory very tight, it's very unlikely that we'll see average home prices decline In 2020.
Does that mean if a global pandemic can’t slow down Toronto’s real estate market, nothing will?
Of course not. The road ahead is still a bumpy one.
There are of course still significant economic risks ahead for our economy. At the Move Smartly Toronto Real Estate Summit, Manulife’s Frances Donald unpacked some of the risks ahead with this next phase of our recovery.
When considering the risks in the real estate market, I’m more concerned that cheap credit and a surge in demand will lead to a rapid acceleration in house prices in the near term which will push prices up higher than they otherwise should be – especially in the outer suburbs. This could make the market more vulnerable to future economic shocks in 2021.
The condominium market on the other hand is starting to show signs of cooling. While the condo market is still competitive and prices are still rising, the increase in resale inventory and declining condo rents will be important trends to keep an eye on in the months ahead.
Charts can sometimes tell a great story, like this one from economist Philip Smith that shows Canada’s deficit ballooning to over $400B in the second quarter of this year.
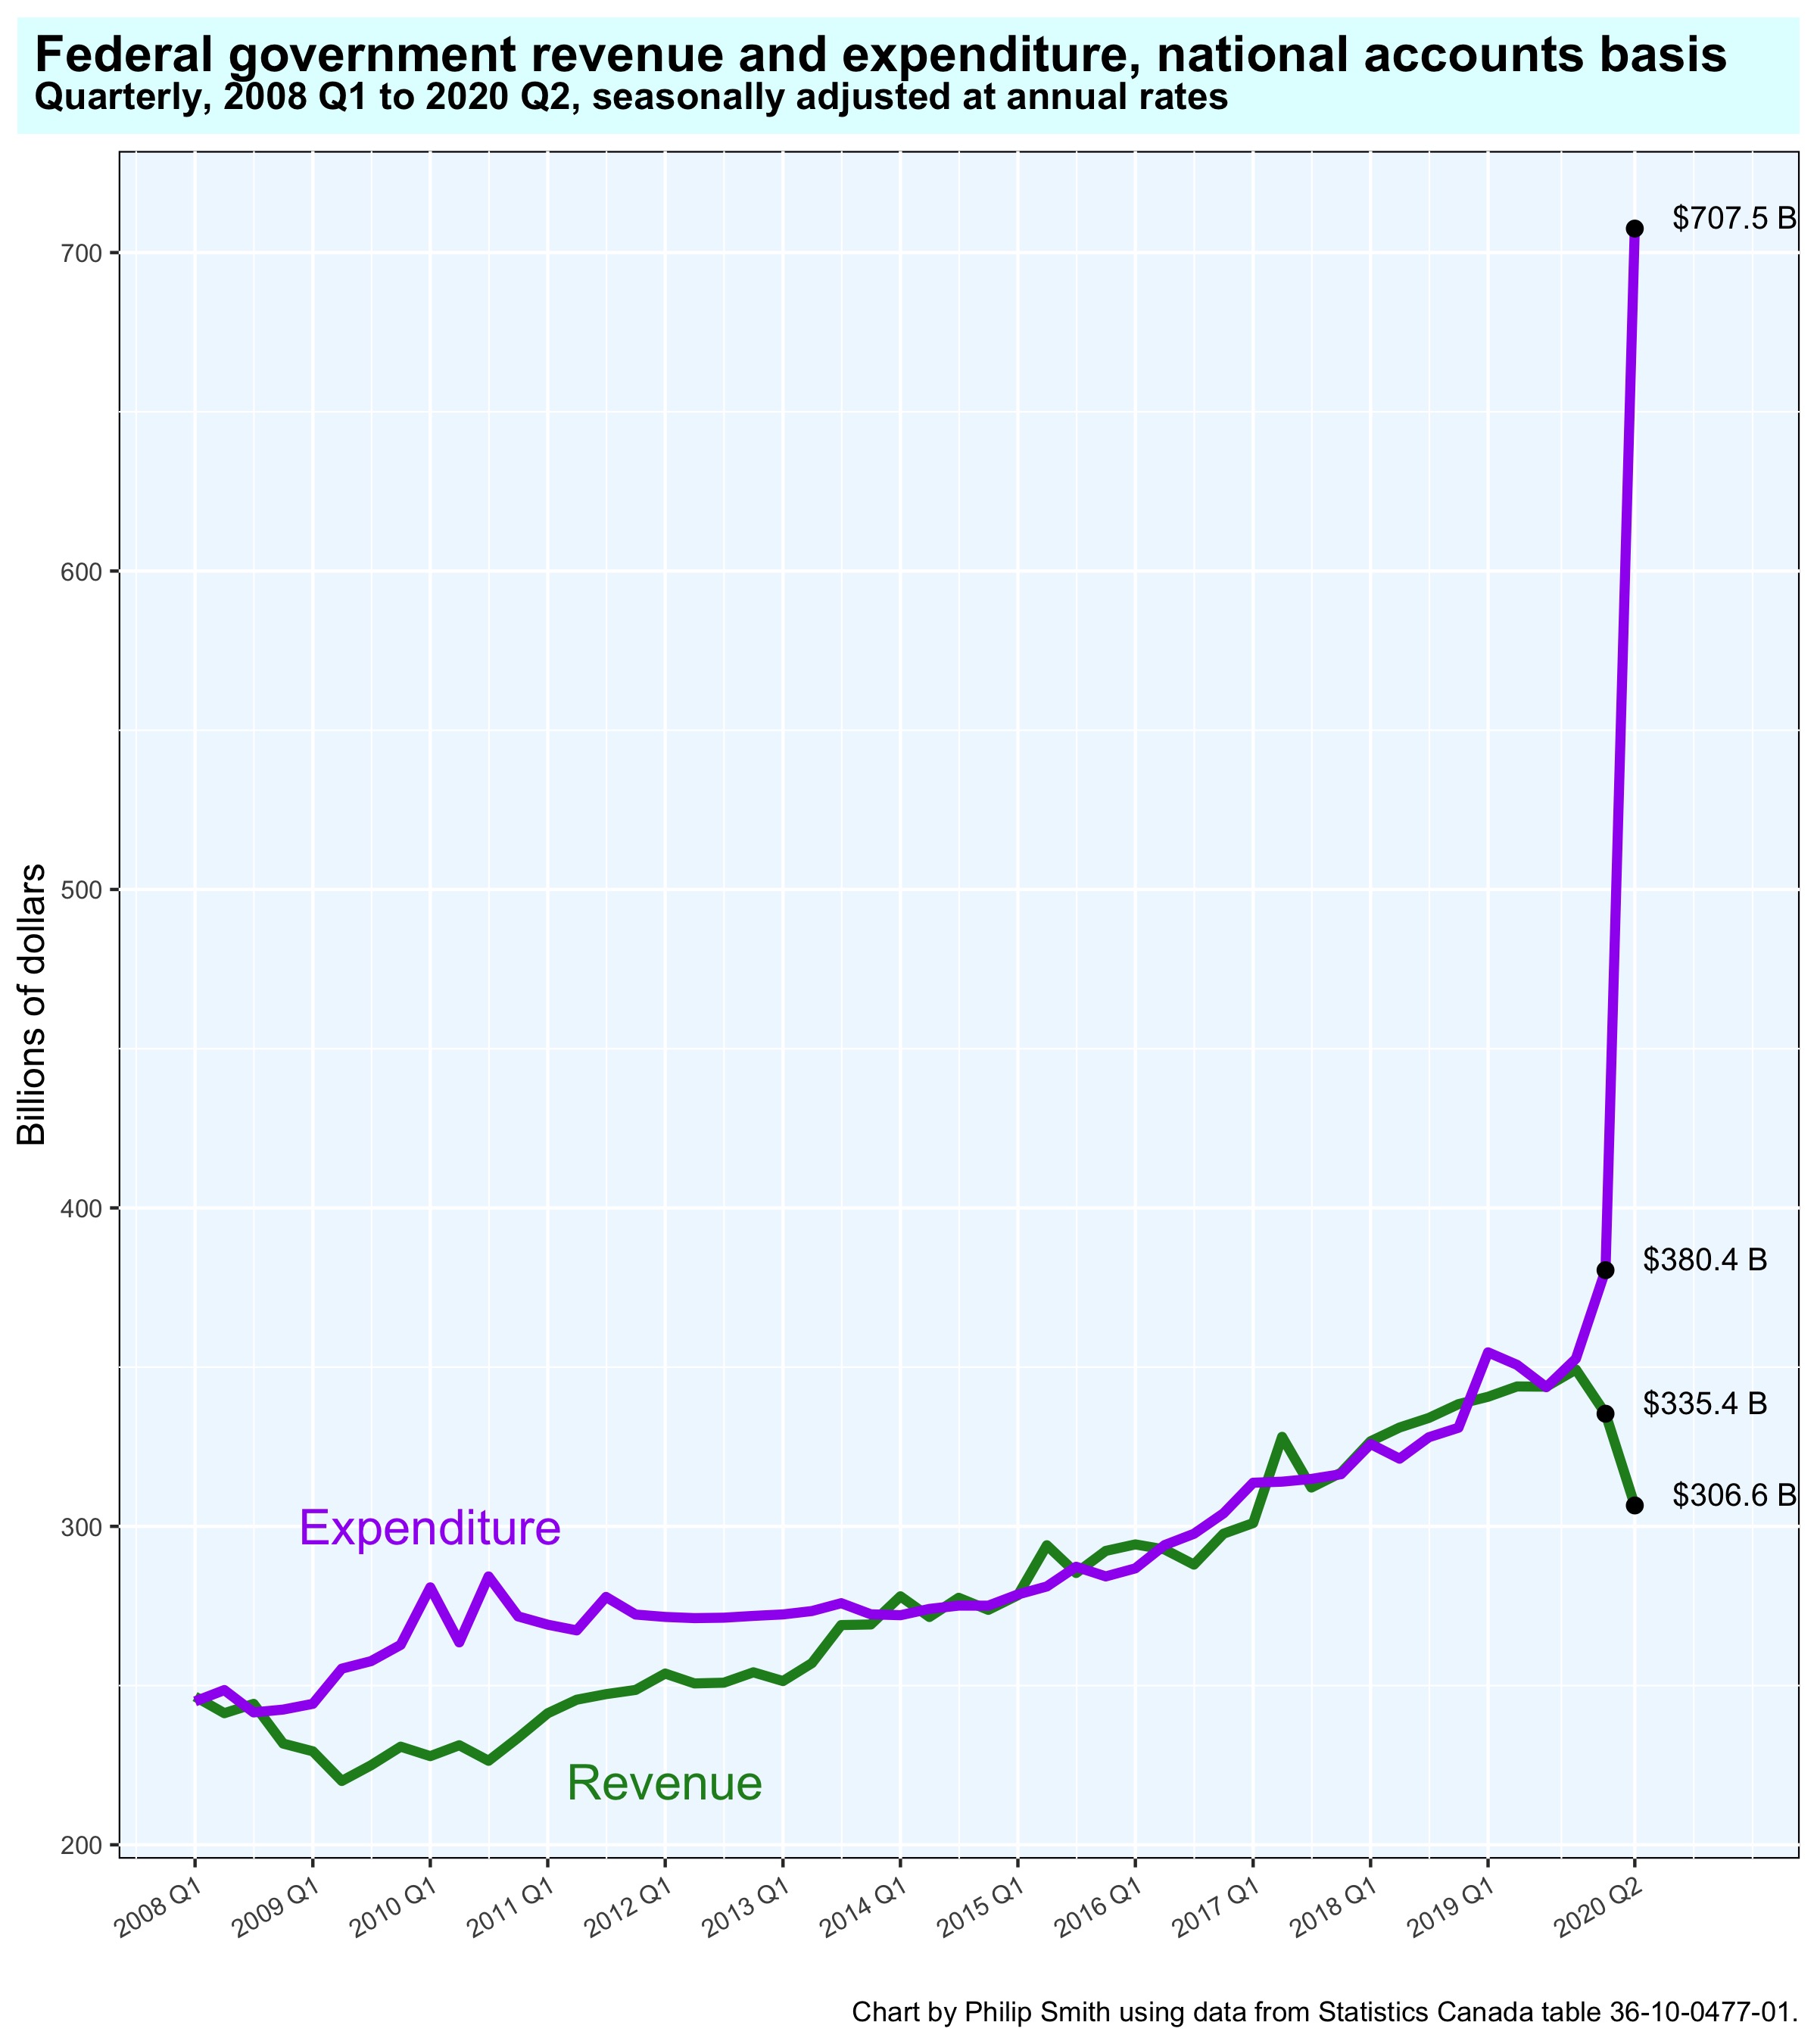
With the federal government set to announce another round of fiscal spending later this month to support households and businesses impacted by COVID, many Canadians will undoubtedly be asking: How is our government ever going to pay all of this back?
Former World Bank chief economist Anne Krueger suggests that governments will be tempted to reduce debt levels through measures known as “financial repression.”
Financial repression generally involves government intervention that keeps the Interest rate on government debt well below what It otherwise would have been without such interventions. It is also typically accompanied by an inflation rate that is running above the Interest rate on government debt.
For example, if the federal government is borrowing at 1% and inflation is running at 3% then the government’s real interest rate (their interest rate adjusted for inflation) is approximately -2%. Which effectively means that the government is being paid to borrow money. Who’s paying them? Savers. Economists Carmen Reinhart and Maria Sbracia argue that this “financial repression tax” is a transfer from savers to borrowers like the government:
However, when financial repression produces negative real interest rates, this also reduces or liquidates existing debts. It is a transfer from creditors (savers) to borrowers (in the historical episode under study here--the government).
The financial repression tax has some interesting political-economy properties. Unlike income, consumption, or sales taxes, the “repression” tax rate (or rates) are determined by financial regulations and inflation performance that are opaque to the highly politicized realm of fiscal measures. Given that deficit reduction usually involves highly unpopular expenditure reductions and (or) tax increases of one form or another, the relatively “stealthier” financial repression tax may be a more politically palatable alternative to authorities faced with the need to reduce outstanding debts.
The Liquidation of Government Debt, Reinhart and Sbracia
But while financial repression sounds like today’s Finance Minister’s panacea, alas, there is never any free lunch. Krueger argues that:
Still, analysts since then have concluded, more or less unanimously, that financial repression reduced GDP growth and was harmful to the economy. Financial repression diverts private savings from private investment toward government securities – usually accompanied by rising inflation because of excess demand at the controlled interest rate. For these reasons, it is almost always accompanied by relatively slower growth.
While the U.S. Federal Reserve and the Bank of Canada have both hinted that they may be open to policies that effectively fix long-term Interest rates, these policies appear to be off the table for now.
As for inflation, both central banks appear to be more comfortable with slightly higher rates of inflation in the future, but time will tell how effective their monetary tools are at driving up prices in an economic environment that Is likely to see considerable disinflationary pressures.
Once again, is it supply or demand?
As house prices continue to rise amidst the Covid-19 generated economic slowdown feeding concerns about market unsustainability, Canada’s housing authorities appear to be at odds – early this Summer, as Bank of Canada’s Governor Tiff Macklem reassured mortgage borrowers that interest rates would remain low for some time to come, the head of the Canadian Housing and Mortgage Corporation, Evan Siddall, doubled down in his fight against “the glorification of homeownership.”
Siddall’s arguments were recently highlighted in a supportive Globe and Mail editorial which also reached the rather familiar conclusion that the “true problem” with Canadian real estate is that we “have a shortage of housing.”
The problem with this conclusion is that it is a too-easy-to-argue solution to a more difficult, two-sided problem.
Recent economic literature has noted that all “superstar cities” display a similar problem: in addition to supply side constraints, such cities generate demand amongst higher income households which crowd out lower income households. It does not take an expert to know that Toronto’s housing market is supply constrained – but without a discussion of the demand side, this discussion is incomplete.
Demand is harder to talk about for several reasons. Compared to changes in supply, which are preceded by building permit applications and other measurable factors, demand changes are often harder to forecast or even foresee.
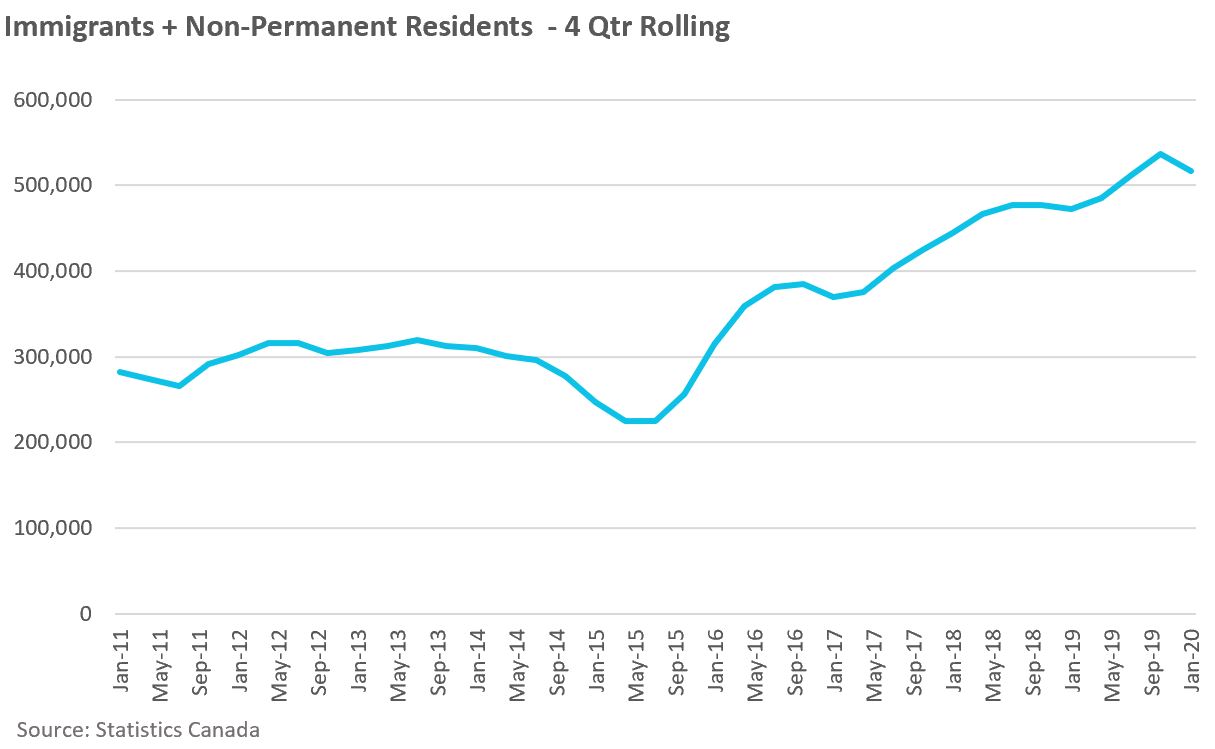
At times, demand may be a result of other policy goals. Immigration, including that of non-permanent residents and foreign students, which is vital to Canada’s economy, also has an impact on its real estate. When Canada experiences a change in levels like the surge in immigration we’ve seen over the past four years (see chart below), much of which tends to funnel to the Toronto area, it is not clear that any superstar city can build fast enough to respond to such a demand shock to prevent upward pressure on house prices.
The boom in house sales and prices we are now seeing is being driven by the spillover of pre Covid-19 immigration levels and cheap money. Add to this an exogenous shock, Covid-19, which has generated a shift to working and schooling from home, and the result is a surge in demand for houses in the GTA’s outer suburbs and cottage country. Before Covid-19, there was no significant supply shortage in Clarington, Innisfil and Essa – these areas were not the hottest markets in the GTA with houses getting 20+ offers on offer nights and prices rising 20+% year over year as we are seeing now.
Incidentally, while the Globe editorial notes that Siddall believes in building housing density on a “grand scale,” a similar swing in demand may make such a project less urgent at present. This month average condominium rents in Toronto are down 13% and falling and resale condo listings are surging as Covid-19 has emptied denser urban areas of their service workers and students, where 100,000 condo units still in the construction pipeline are due to add to increasing supply.
More importantly, politicians and policy makers interested in “grand building” are often less full-throated about how money for such projects may be found – consider the role that property investors play.
Indeed, the CMHC itself believes that policies that promote the interests of Investors and the financialization of housing are necessary.
A report published in 2018 states that:
“these investors may have played a critical role in increasing the supply of new housing in Canada. Although further analysis is needed, we therefore caution that actions curtailing investors’ interest in financing new housing construction could impact long-term housing supply adversely”
Examining Escalating House Prices In Large Canadian Metropolitan Centres, CMHC, 2018
But CMHC’s conclusions are problematic. The reason investors have been responsible for much of the new condominium construction In the GTA over the past decade is not because end-users don’t want to buy a new home but because optimistic investors are the marginal buyers in the market who will pay the highest price. It’s why pre-construction condominiums in the Toronto area sell for 20-30% more than existing resale condos, pricing end-users out of the market.
Evidence from British Columbia’s speculation and vacancy tax suggests that vacant homes and foreign capital are all making it harder for BC residents to buy a home.
In their 2017 Financial System Review, the Bank of Canada argued that the (eventually unsustainable) acceleration in GTA home prices in 2016/2017 that pushed prices up 30% year-over-year was likely driven by investor speculation.
All of this is not to suggest that there is no case for well-considered supply side policies – but more often than not there are insidious problems on the demand side that could be addressed that may offer more immediate results when compared to supply side policies which could take decades before they have any impact on the market.
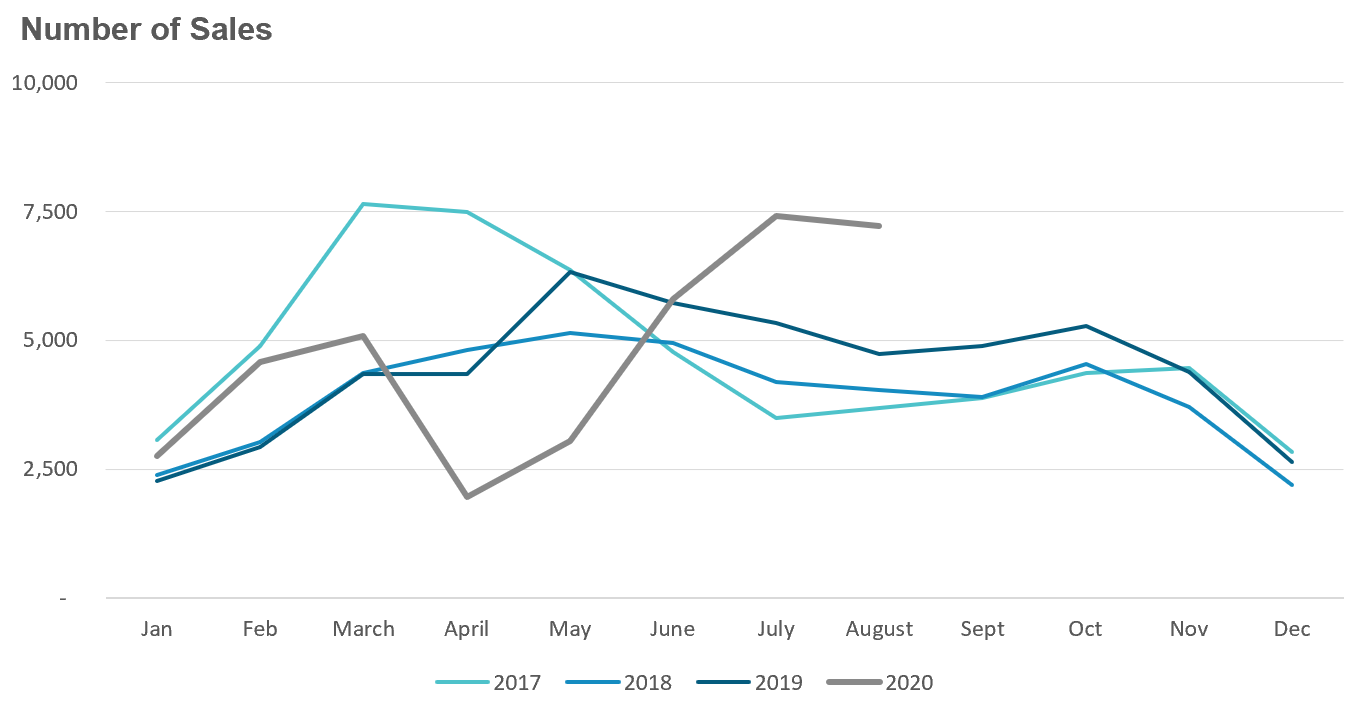
But year-over-year comparisons are slightly misleading because the busy spring market has effectively been pushed out two months due to COVID. It's like comparing this year's delayed "spring" market to last year's summer market.
While year-over-year comparisons are slightly misleading, the rebound in sales is still an encouraging sign that home buyers are confident and have returned to the market.
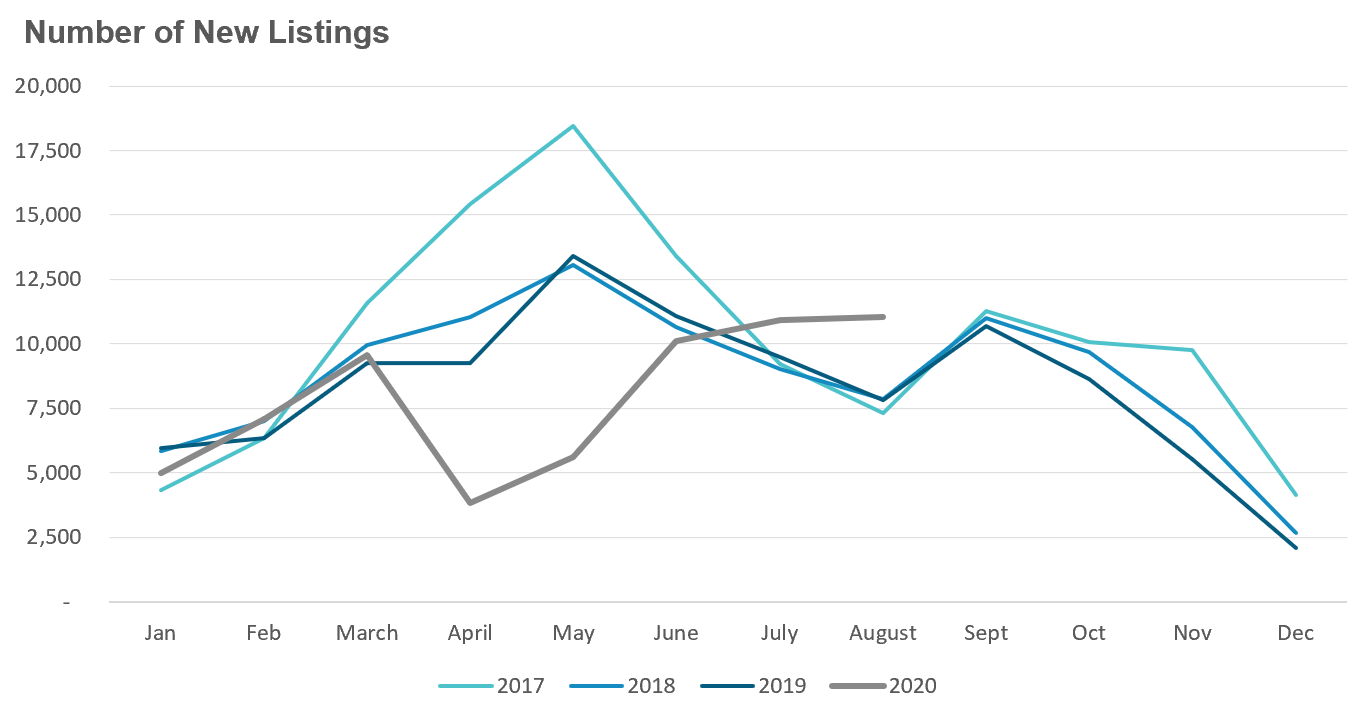
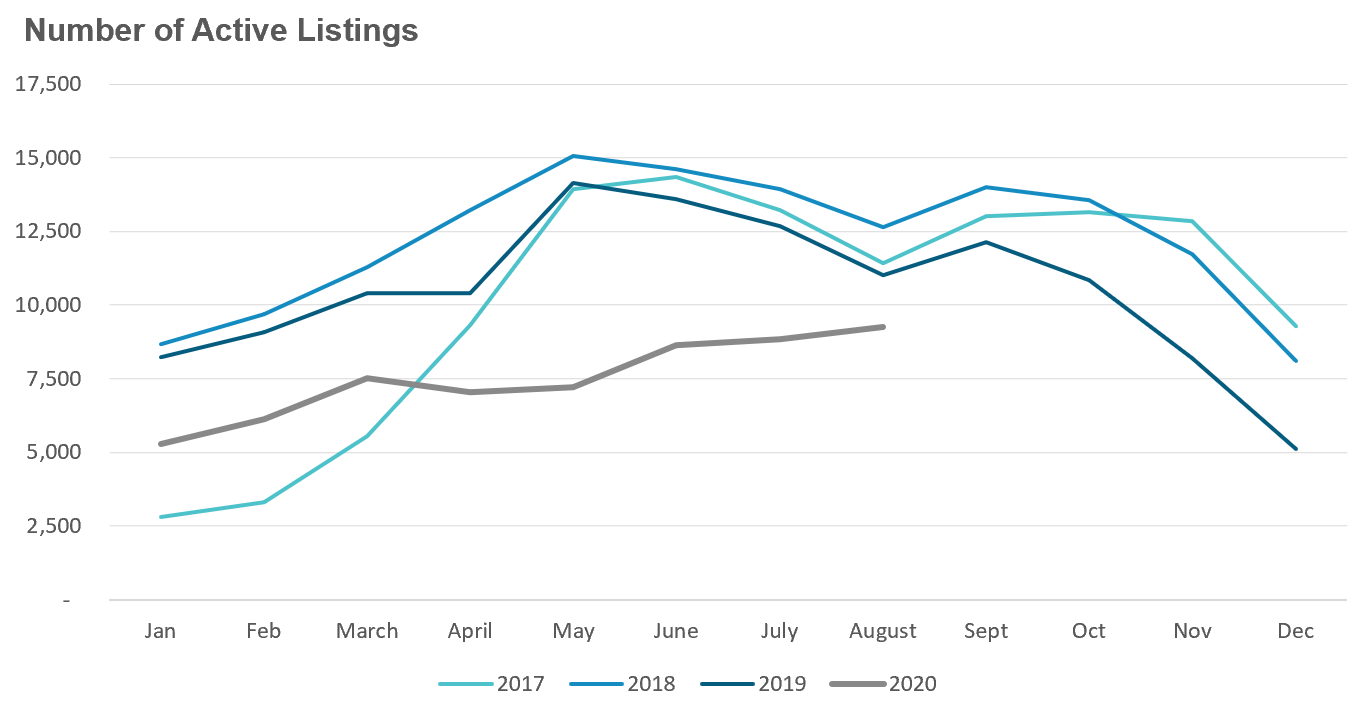
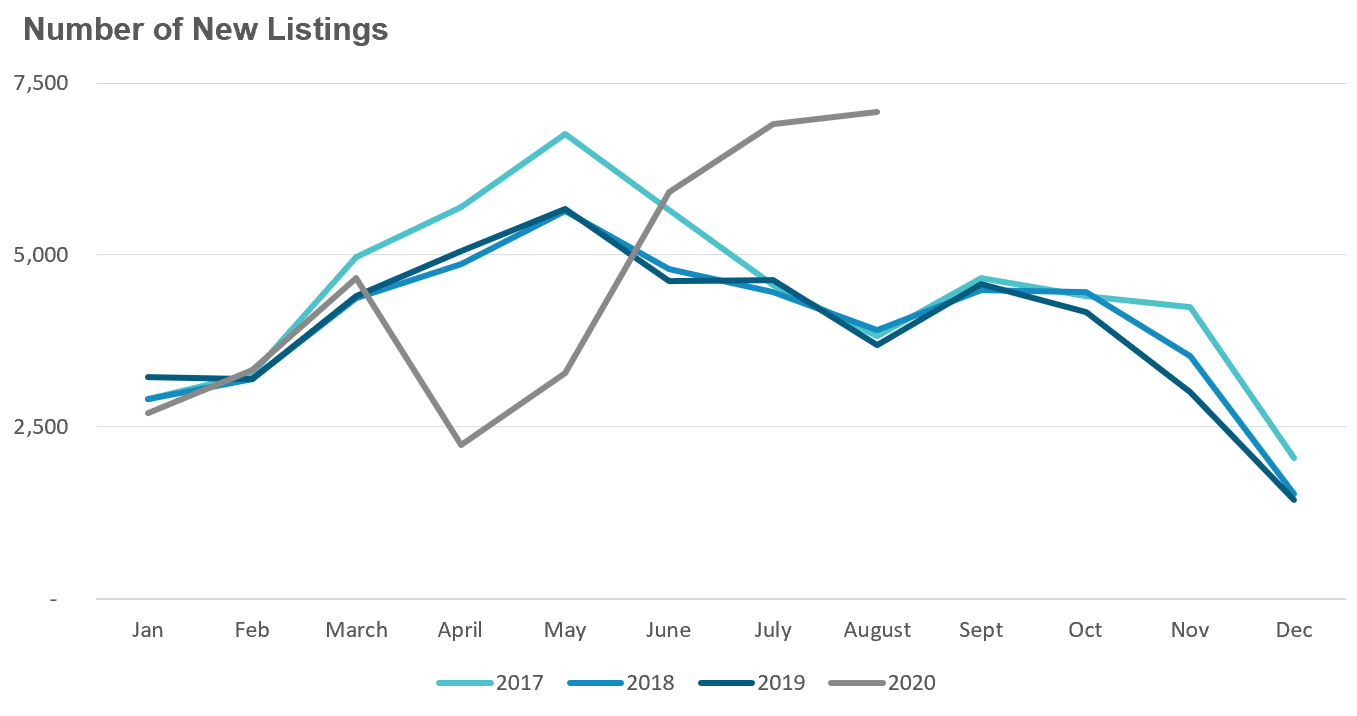
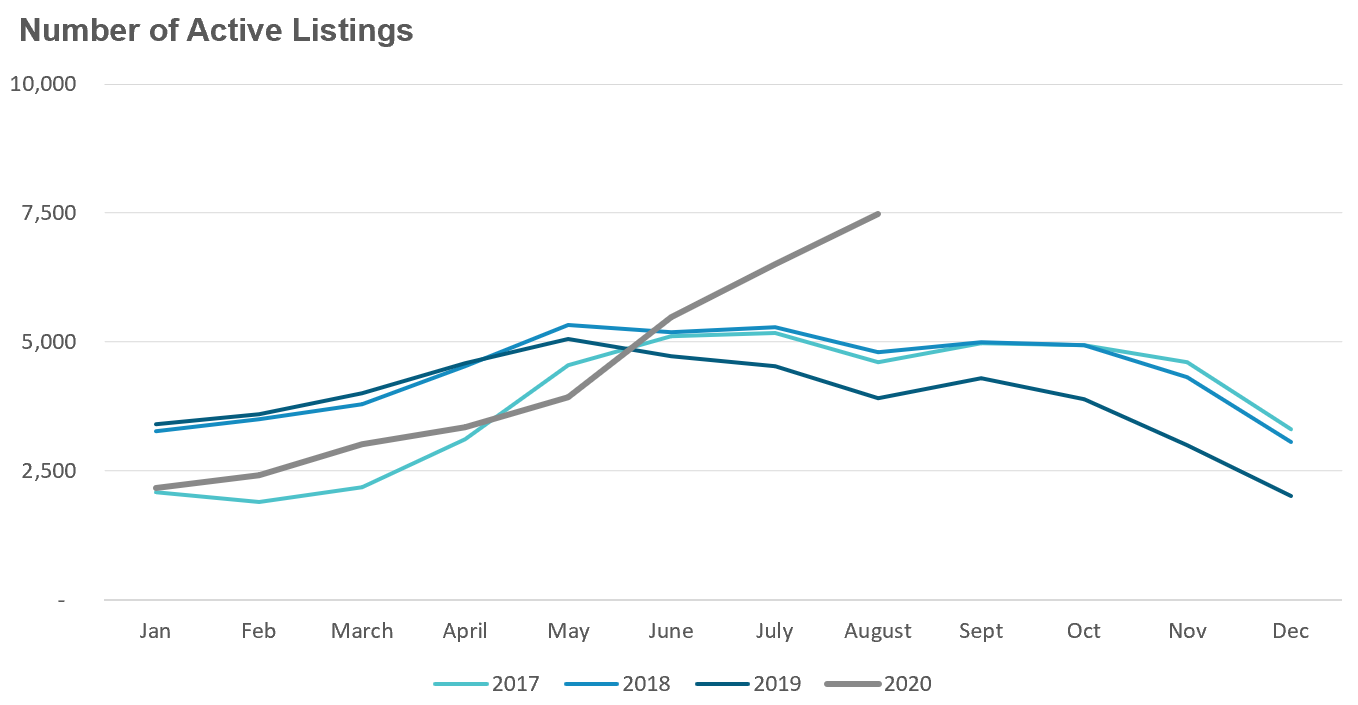
August did see a significant increase in the number of new listings coming on the market which were up 41% over last year. But even with this surge in new listings, the number of homes available for sale (“active listings”) was down 16% when compared to the same month last year.
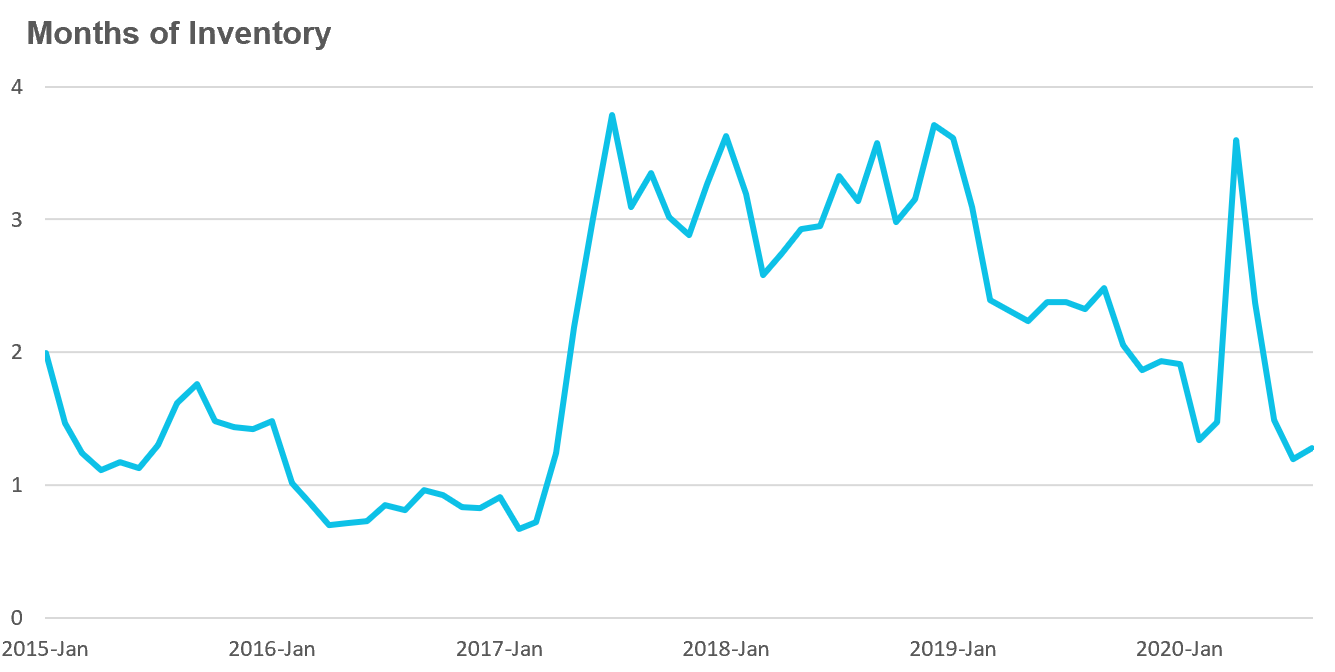
The Months of Inventory (MOI) looks at the number of homes available for sale in a given month divided by the number homes that sold In that month. It answers the following question: If no more homes came on the market for sale, how long would it take for all the existing homes on the market to sell given the current level of demand?
The higher the MOI the cooler the market Is. A balanced market (a market where prices are neither rising or falling) Is one were MOI is between 4-6 months. The lower the MOI, the more rapidly we would expect prices to rise.
The market remained very competitive in August with an MOI of just 1.3 months.
While the current level of the MOI gives us clues into how competitive the market Is on the ground today, the direction it's moving In also gives us some clues Into where the market may be heading. The slight increase in the MOI last month suggests that the increase in new listings wasn't enough to dramatically cool the market, but it helped keep the market as balanced as it was the previous month.
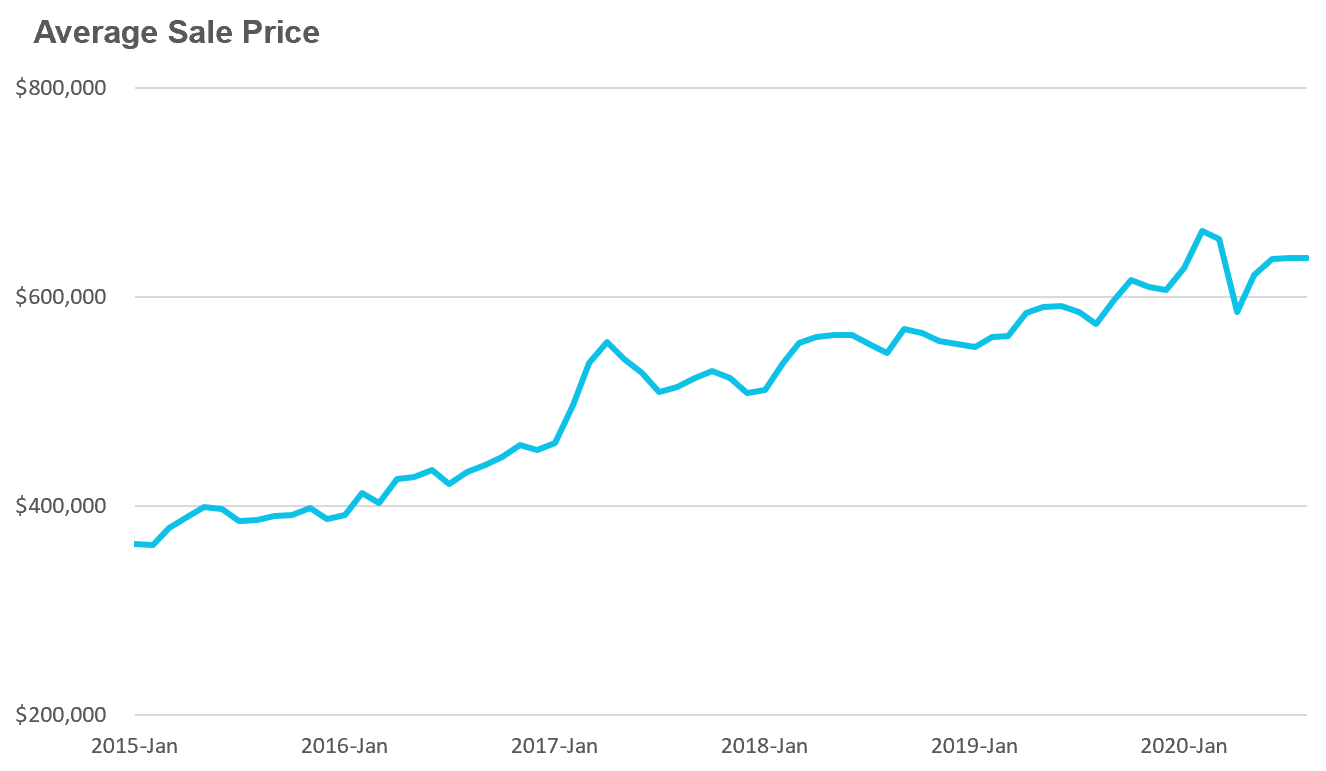
Strong demand coupled with very low inventory levels helped push average house prices up 19% over last year.
Condo sales (condo apartments, condo townhouses, etc.) were not as hot as house sales in August, but were still up 15% over last year recovering some of the lost ground from April and May.
New condo listings surged by 91% in August which pushed the active number of condos available for sale In August up by 92%.
This spike in inventory is leading to a slight cooling down in the condominium market with the MOI increasing from just under 2 months in July to 2.3 in August.
But with inventory still relatively tight, average prices were up 11% over last year.
It's worth noting that the downtown condo market is currently cooler than the rest of the GTA with an MOI of 3.8, but prices were still up 8% over last year.
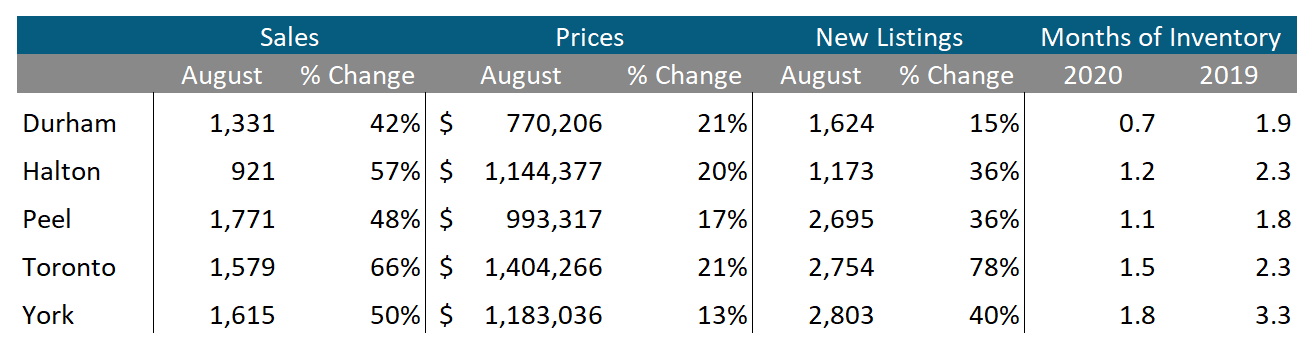
Houses
We can see that house sales and prices are up across all five regions In the Toronto Area. New listings were up in all regions with Toronto seeing the biggest increase at 78% and Durham the lowest at 15%.
The MOI is down significantly in all five regions when compared to last year which tells us that the market is more competitive than it was a year ago.
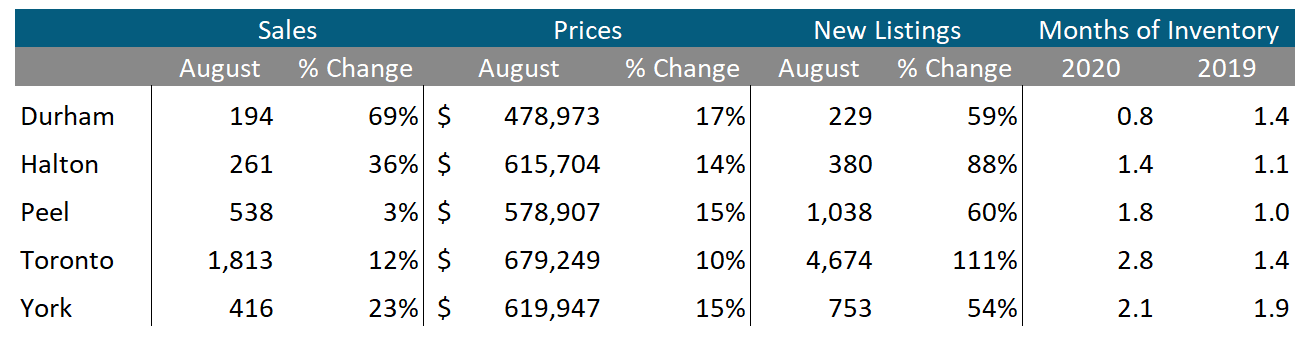
Condominiums
Condo sales continue to see big increases in Durham and Halton but both are relatively small markets for condominiums. The MOI for Toronto's condo market Increased from 1.4 months last year to 2.8 months last month.
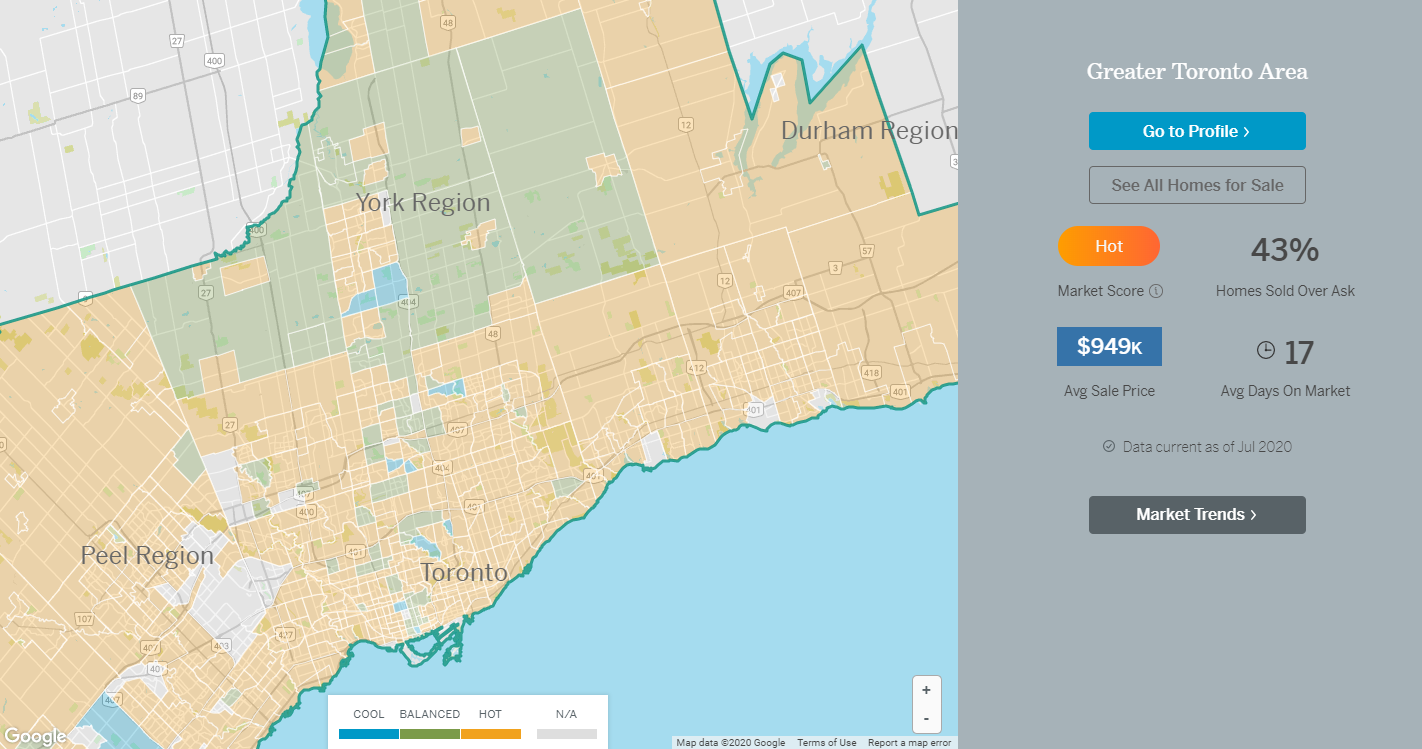
Greater Toronto Area Market Trends