

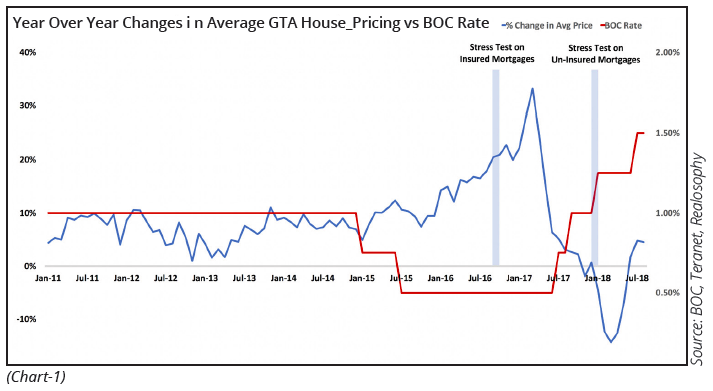
Since July 2017 the Bank of Canada has increased the overnight rate four times pushing it to 1.5% in July 2018. This has had two broad effects on the housing market. It has made buying a home more challenging because as interest rates rise the amount that a potential home buyer can borrow declines in order to keep their debt-servicing constant. Higher rates have also increased the cost of servicing debt for existing homeowners.
On January 1,
The mortgage stress test has made qualifying for a mortgage harder for many home buyers. An average home buyer saw the mortgage amount they qualify for
Looking back at the GTA’s housing bubble, it’s worth noting that historical housing bubbles have followed a very similar credit cycle to the one we have seen over the past four years in Canada (Chart 1). A period of loose credit is followed by a rapid acceleration in asset prices as more and more people take on debt to buy assets that they simply believe will increase in value forever. This is often followed by a period of tighter credit - which is where we find ourselves today.
As we continue further into a tighter lending environment a couple of important questions need to be answered to assess how the market is adjusting to these credit conditions.
Are we seeing any material changes in the borrowing
Are home buyers finding ways around the OSFI stress tests by financing their homes through lenders that are not regulated by OSFI (credit unions or private lenders)?
In some cases, owners may sell assets or downsize their existing home to reduce their debt burden. In other cases, owners will opt to buckle down and stay the course hoping that things will improve in the near future. They hope that either interest rates will fall again reducing their debt servicing costs or asset prices will begin to rise rapidly again. In these situations, it’s not uncommon for owners to take on even more debt to make ends meet in the short term. Owners who have trouble obtaining additional financing for their home or investment property from traditional banks may turn to more expensive sources of financing.
In Canada, private lenders often serve as the lender of last resort that buyers and owners can turn to when traditional banks and credit unions have turned them down. Private lenders are more willing to take on riskier financing arrangements than traditional lenders and in return charge borrowers much higher interest rates.
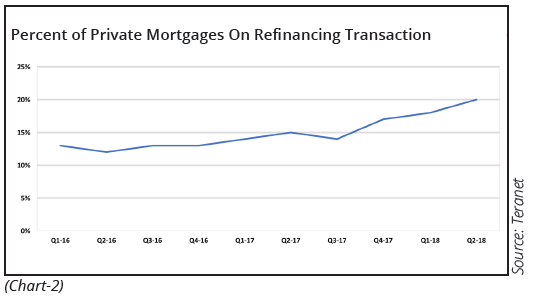
When looking at the number of refinancing mortgages registered on a property that have been arranged since 2016 (Chart 2), we see that the share financed by private lenders has increased significantly, from a low of 12% during the second quarter of 2016 to 20% during the second quarter of 2018 - a 67% increase in two years.
The average private loan amount (Chart 3) peaked at $202,836 during the fourth quarter of 2017 before falling to $179,280 in 2018. The average term on private mortgages is 1.5 years.
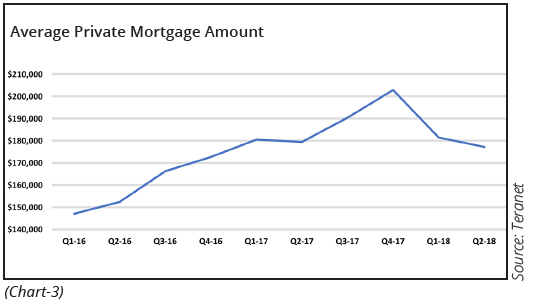
In contrast, refinancing mortgages from banks, credit unions and trust companies averaged $480K in 2018 with an average term of 3 years.
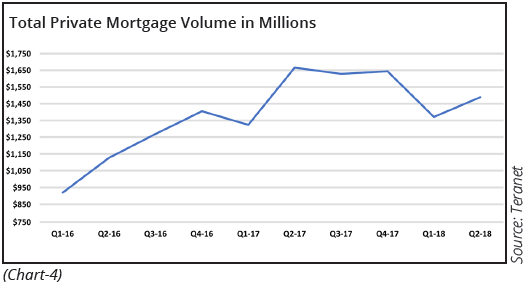
Total private mortgage volumes (Chart 4) have increased from $920M in the first quarter of 2016 to $1.5B during the second quarter of 2018. The dollar volume market share of private mortgages increased from 6% in Q1 2016 to 10% in the second quarter of 2018.
Growth in refinancing mortgage transactions financed by private lenders (Chart 5) has been on the rise in all five of the GTA’s regions.
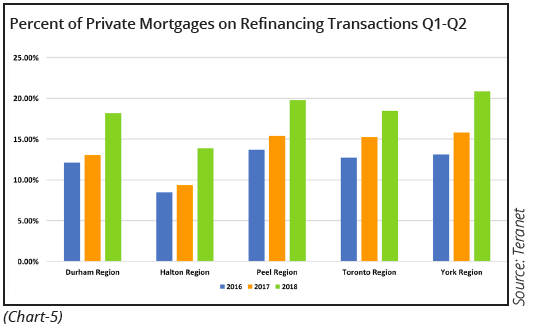
While Halton had the lowest percentage of private refinancing mortgages out of the 5 GTA regions, it has seen the fastest growth with private financing up 64% in 2018 over 2016 volumes.
York Region saw 21% of their refinancing mortgages in 2018 sourced from private lenders, the highest level of the five GTA regions.
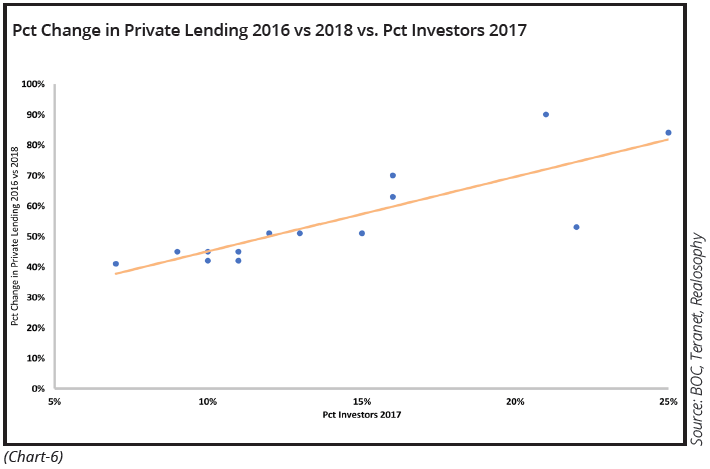
Previous research by Realosophy Realty found a significant increase in the number of houses being purchased by investors in 2016 and 2017 and that investor demand varied across GTA municipalities.
The growth in refinancing mortgage transactions financed from private lenders (Chart 6) was largest in municipalities that saw a high percentage of investors buying houses in 2017. It’s unclear if this increase was driven by investors taking on additional private financing on their investment properties after they purchased them or on their principal residences in cases where investors bought investment properties in their local market.
When looking at demographic trends for private mortgages over the last two and a half years (Chart 7), Generation X has remained the largest group of consumers who turn to private lenders. 42% of all private mortgage transactions and 43% of all private mortgage funds are provided to Gen X. In comparison to the market as a whole, Gen X represents 43% of all mortgage transactions and 48% of all mortgage value.
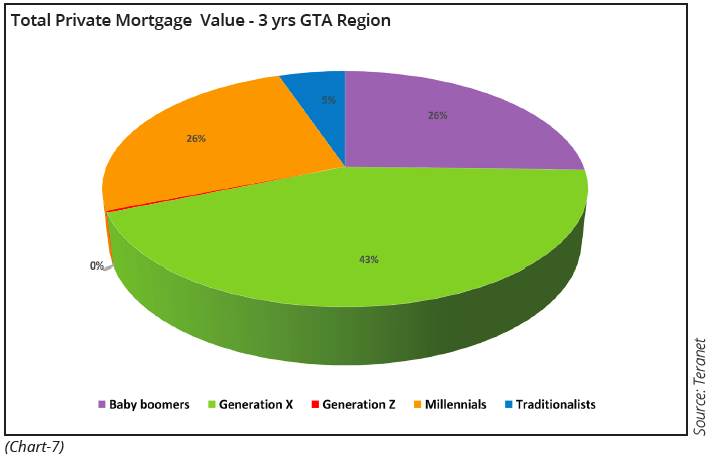
Why then are Gen X owners increasingly turning to private mortgages, vs traditional banks? The answers are not obvious. A portion of this increase may be driven by owners who prefer to do major renovations to their existing home vs upsizing to another house. Private lenders are often more willing than traditional banks to provide construction financing. But another possible explanation is that private debt is being used to help finance existing real estate investments - an explanation that is supported by the fact that the growth in private financing was highest in municipalities that had the highest rate of investor demand.
Looking at how financing sources on sale transactions (mortgages registered within 6 months of
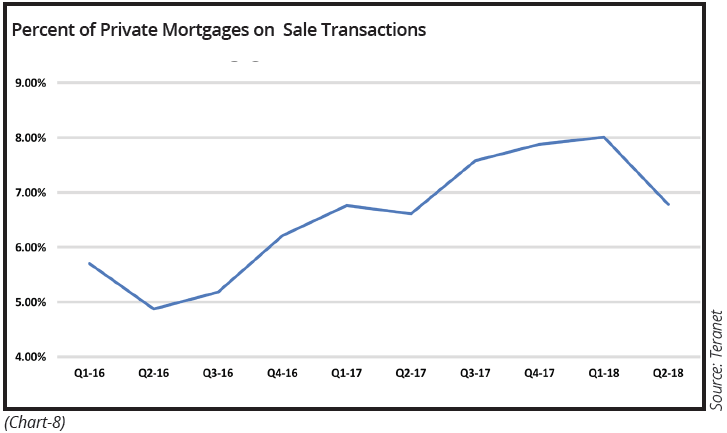
As home prices in the GTA fell between the second and third quarters of 2017 many home buyers struggled to obtain financing on the homes they bought because at the time of closing - typically several months after they bought - the houses were no longer worth what they had paid for them at the peak of the market. Many buyers walked away from their purchases losing their deposits and risking legal action from the seller. Many that did eventually close on their purchases may have turned to private lenders to fill the gap in their financing which may explain the surge in private financing towards the end of 2017.
The average private mortgage on sale transactions climbed from $253,533 in 2016 to $316,587 in 2018. The average non-private mortgage amount in 2018 was for $543,162. The average term on private mortgages was 1.7 years in 2018 compared to 3.92 years for non-private mortgages.
Borrowers do not appear to be circumventing the mortgage stress tests by obtaining financing from credit unions which are not regulated by OSFI, as there is no meaningful growth in the market share of credit unions that can be attributed to this policy change.
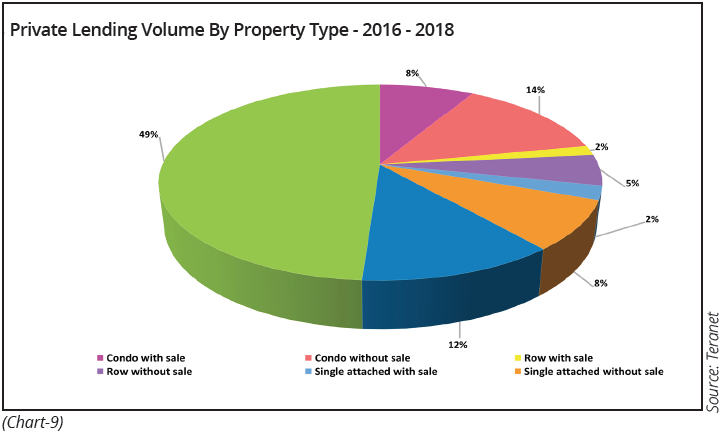
When looking at private lending from 2016 to the second quarter of 2018 (Chart 9), it is worth noting that almost 50% of private lending activity was conducted on detached properties that did not involve a sale. The next highest segment for private mortgages was for condominiums without a sale accounting for 14% of the volume.
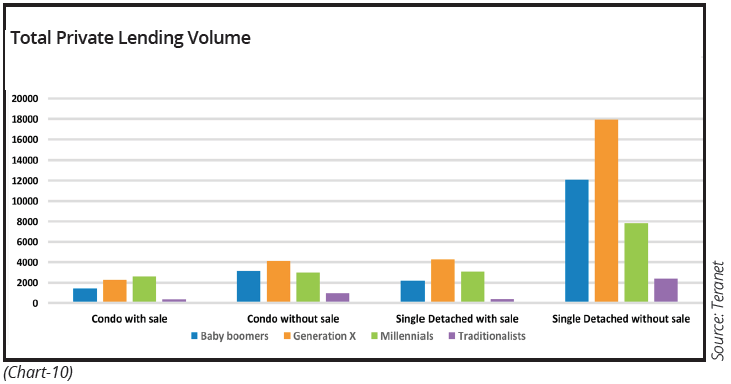
In the GTA, single detached houses represent approximately 61% of all private lending volume (Chart 10). When drilling down to look more closely at condos and single detached homes by cohort in the GTA, Generation X remains the top consuming cohort in almost
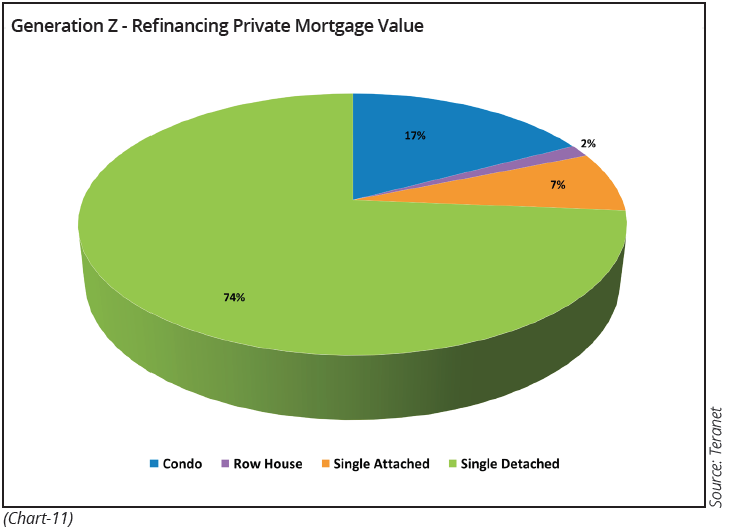
Focusing specifically on property type, on average approximately 8% of the total refinancing mortgage value is tied to condos. Generation Z, although small in size, leads the pack with 17% of the total mortgage value for that cohort being allocated to condos (Chart 11). Similar to other cohorts, single detached houses are the dominant house type for Gen Z, representing 74% of the overall mortgage value for refinancing private mortgages.
With interest rates expected to be on the rise over the next twelve months, it will be important to follow this segment of the market to see how homeowners are coping with a higher rate environment. Will the demand for private lending level off over the next six to twelve months or will their share of the market continue to grow as rates rise?